
- Moving the market
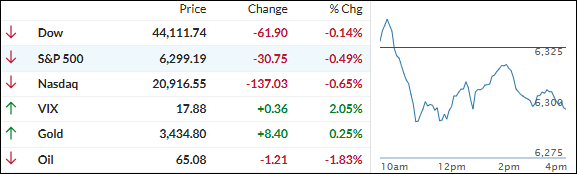
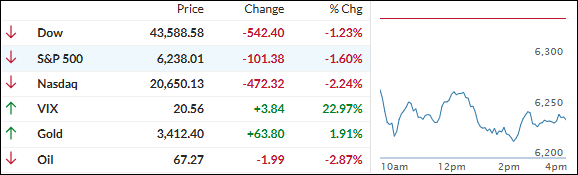
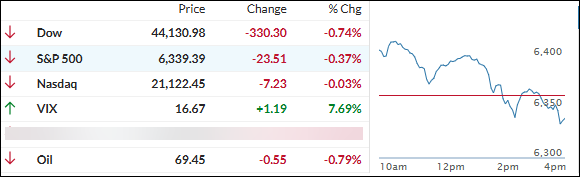
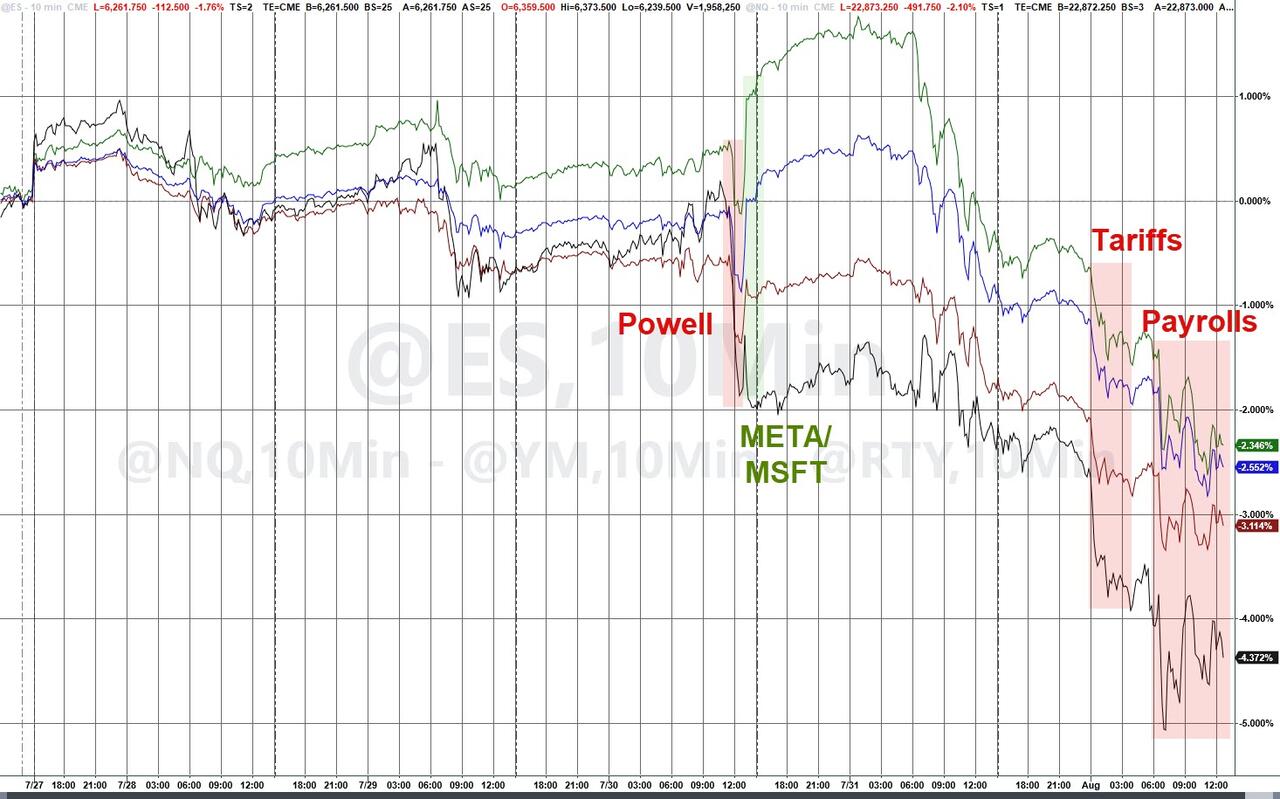
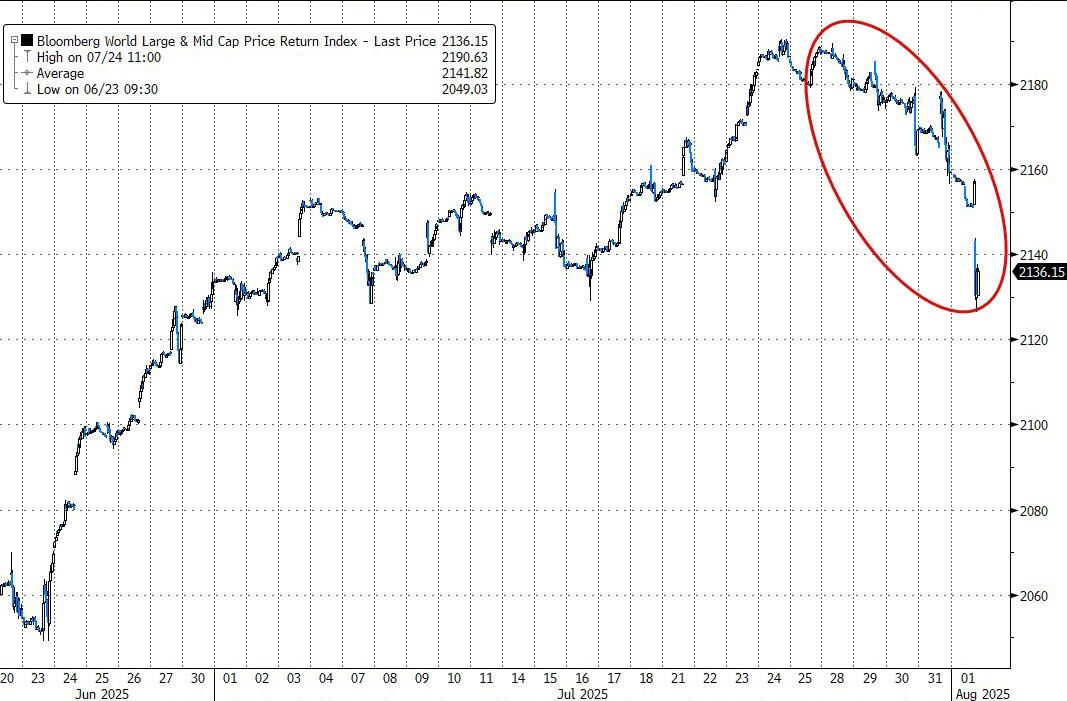
Stocks slipped across the board on Tuesday as traders reacted to some surprisingly weak economic data and fresh tariff talk from President Trump.
Earnings painted a mixed picture—Palantir jumped 8% after hitting a billion dollars in revenue for the first time, but Caterpillar stumbled on an earnings miss.
The big drag on the market came from the ISM Services index, which showed flat growth in July along with signs of higher inflation and shrinking employment. Since services make up about 70% of the U.S. economy, that hit a nerve—any slowdown here could spell trouble down the road.
Adding to the cautious mood, Trump announced upcoming tariffs on chips and pharmaceuticals, saying he wants more of both made in the U.S., with specifics promised “within a week or so.”
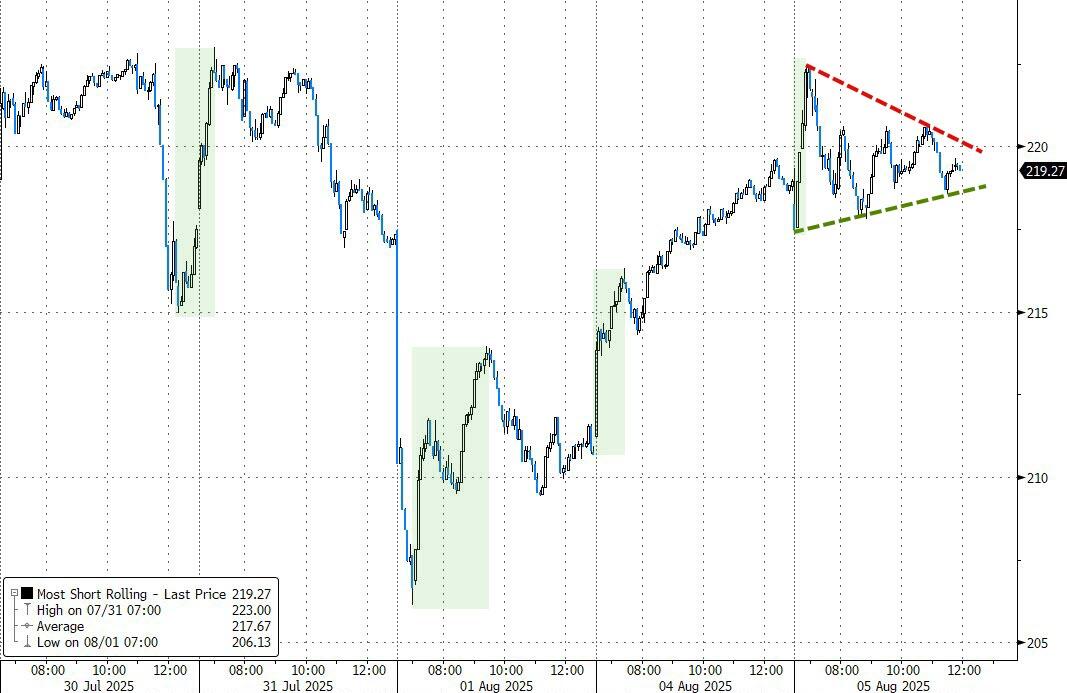
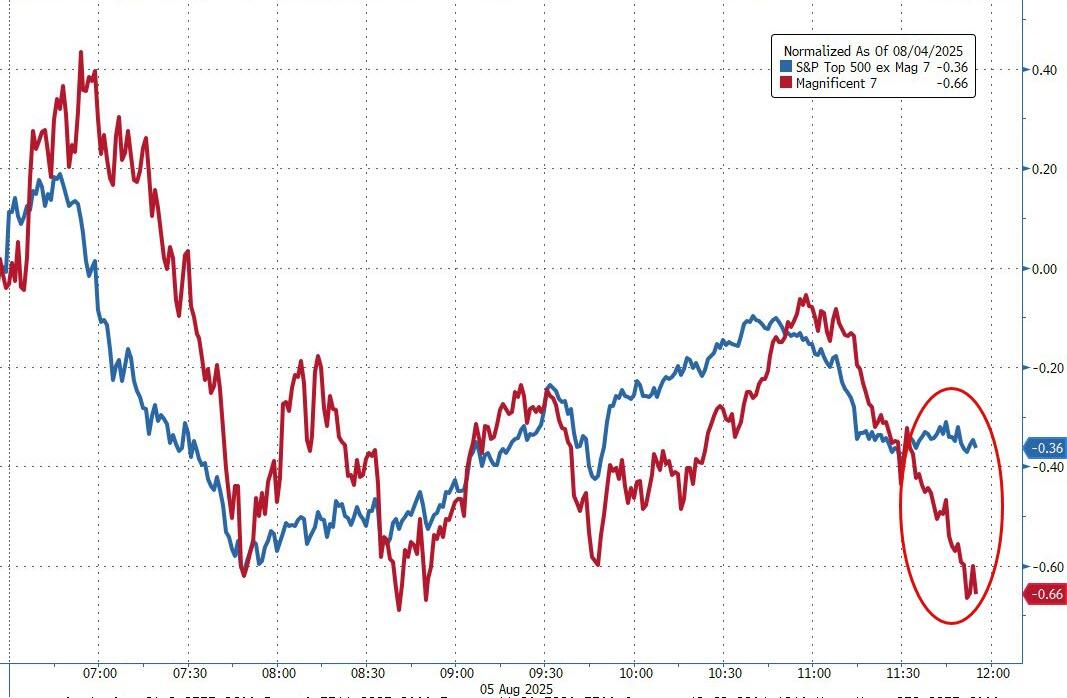
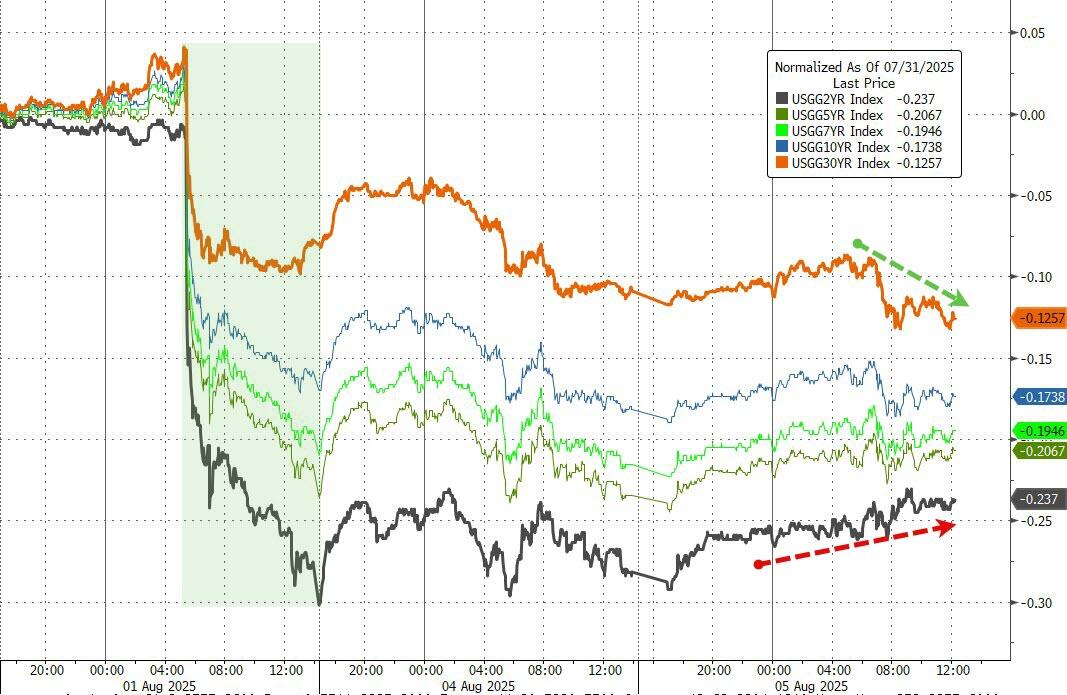
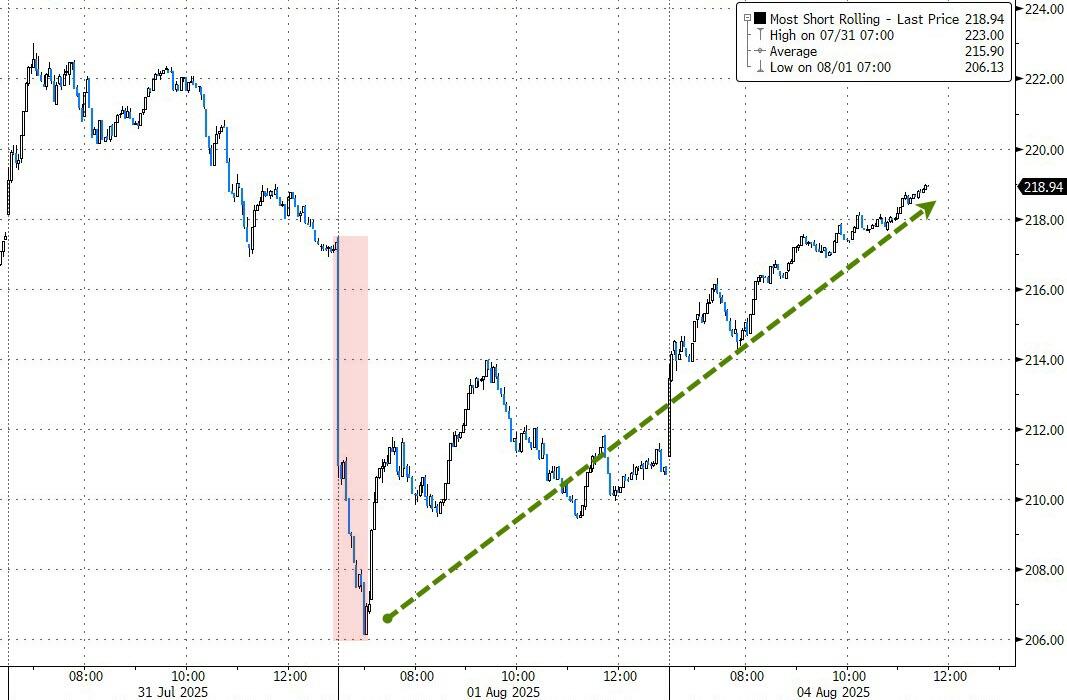
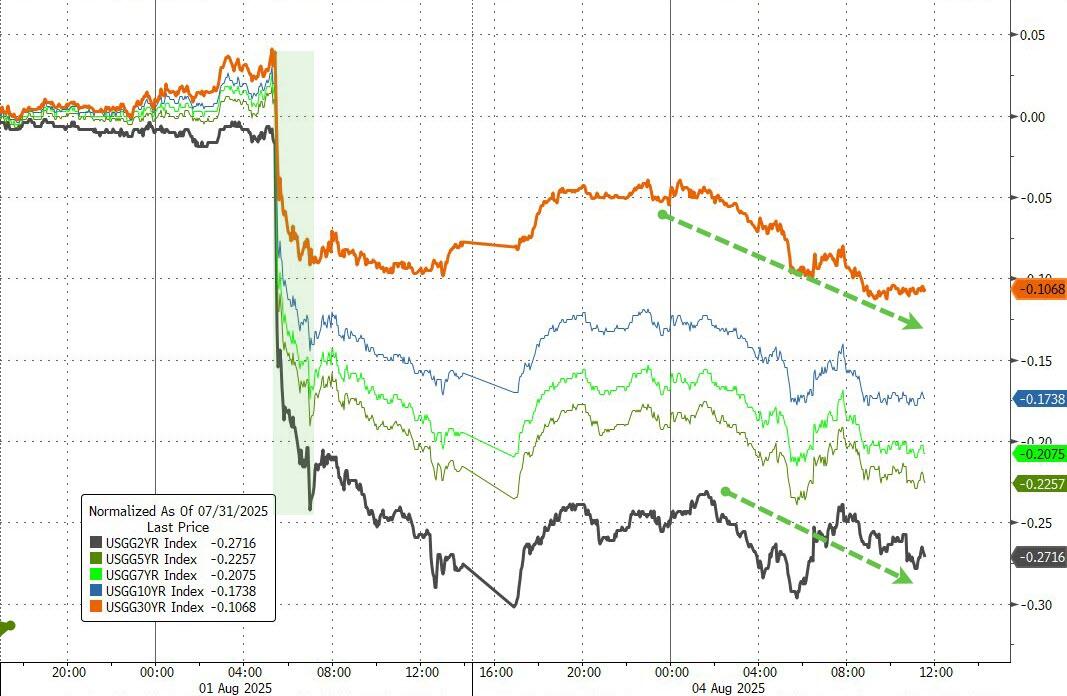
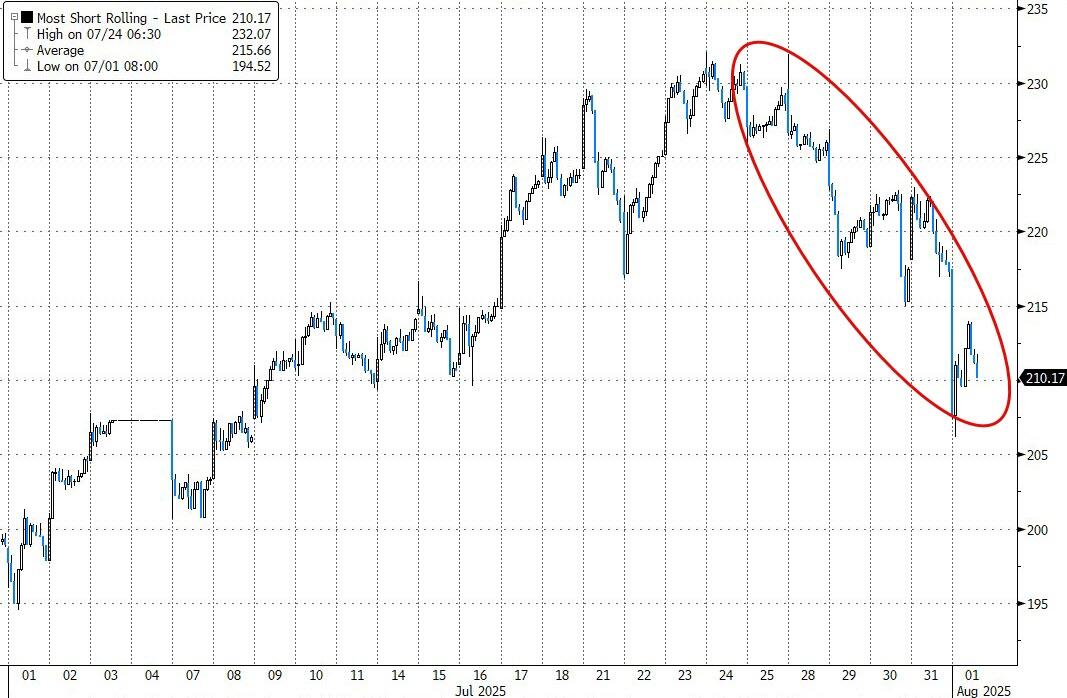
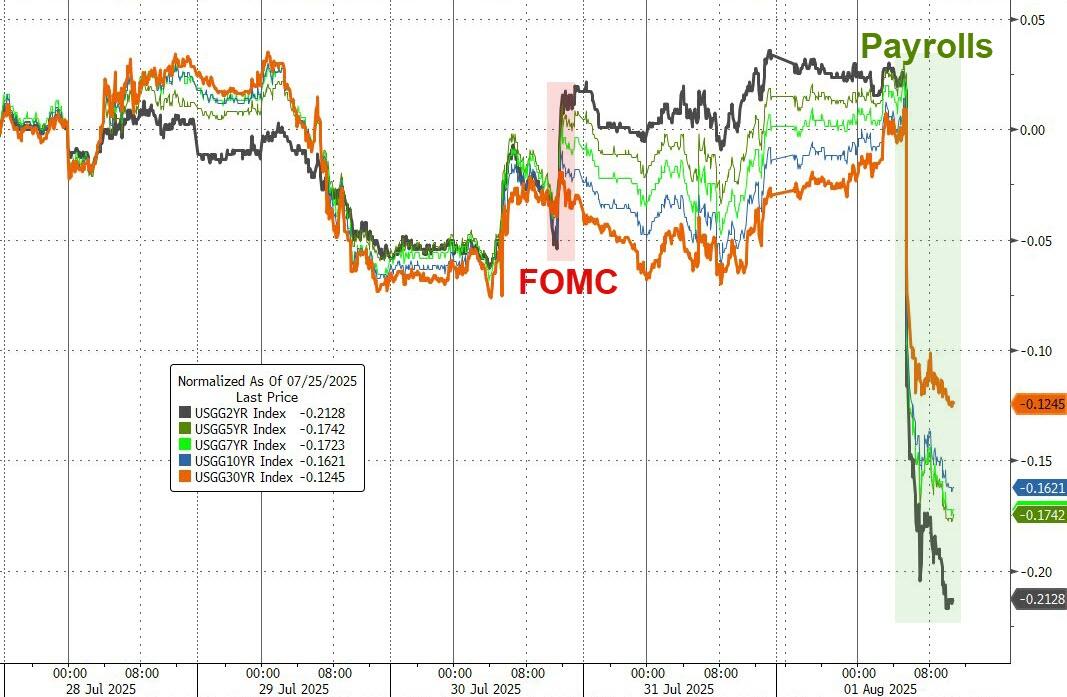
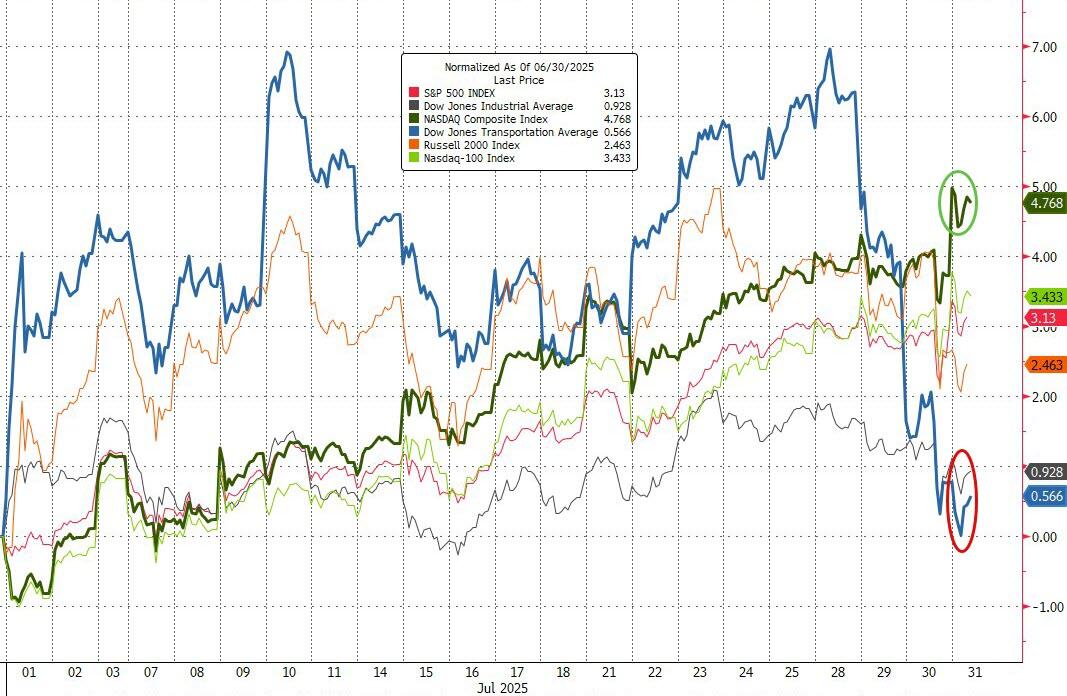
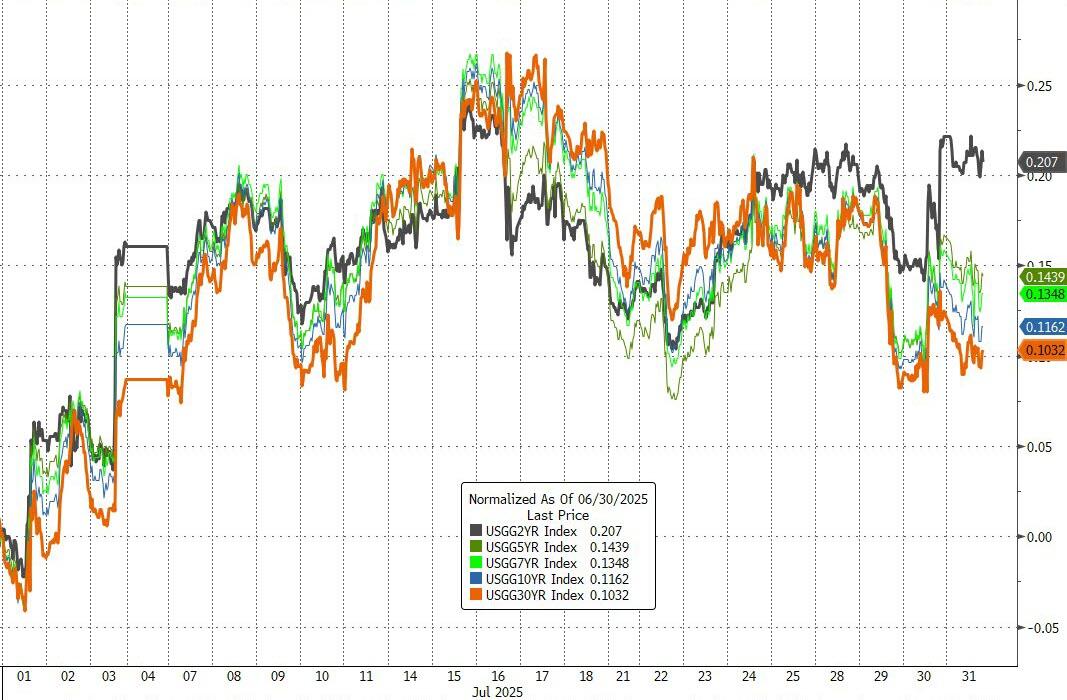
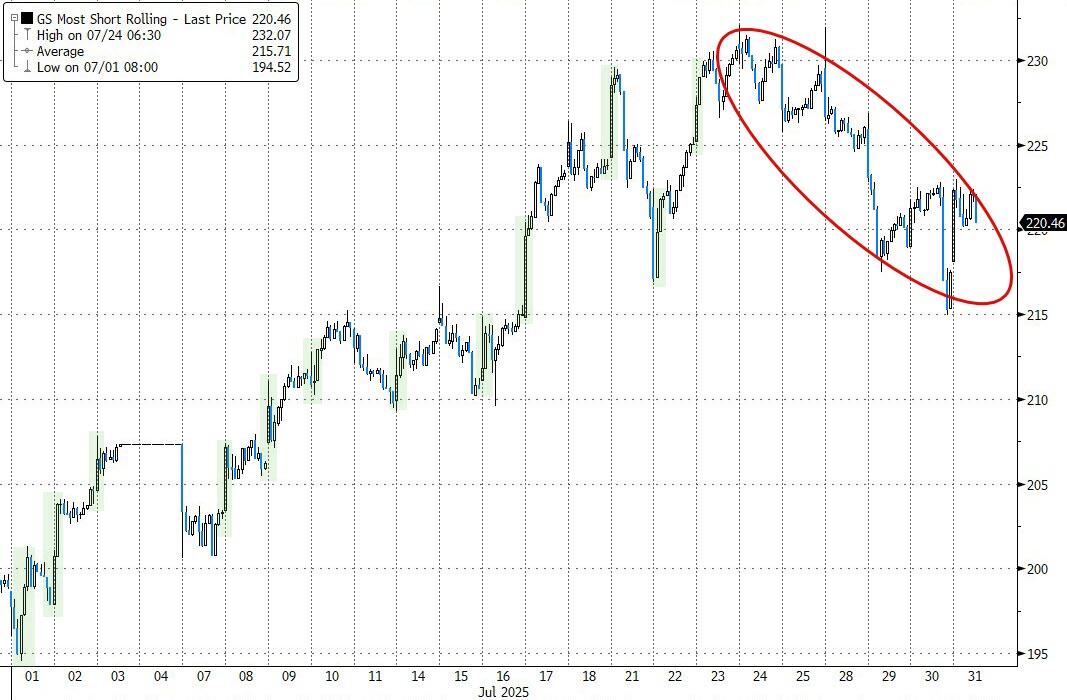
That did nothing to calm investors, especially as tech stocks lagged and an early short squeeze fizzled out. Small Caps managed to end modestly in the green, but the Magnificent Seven led the market lower. Meanwhile, bond yields offered no help, finishing the day mixed.
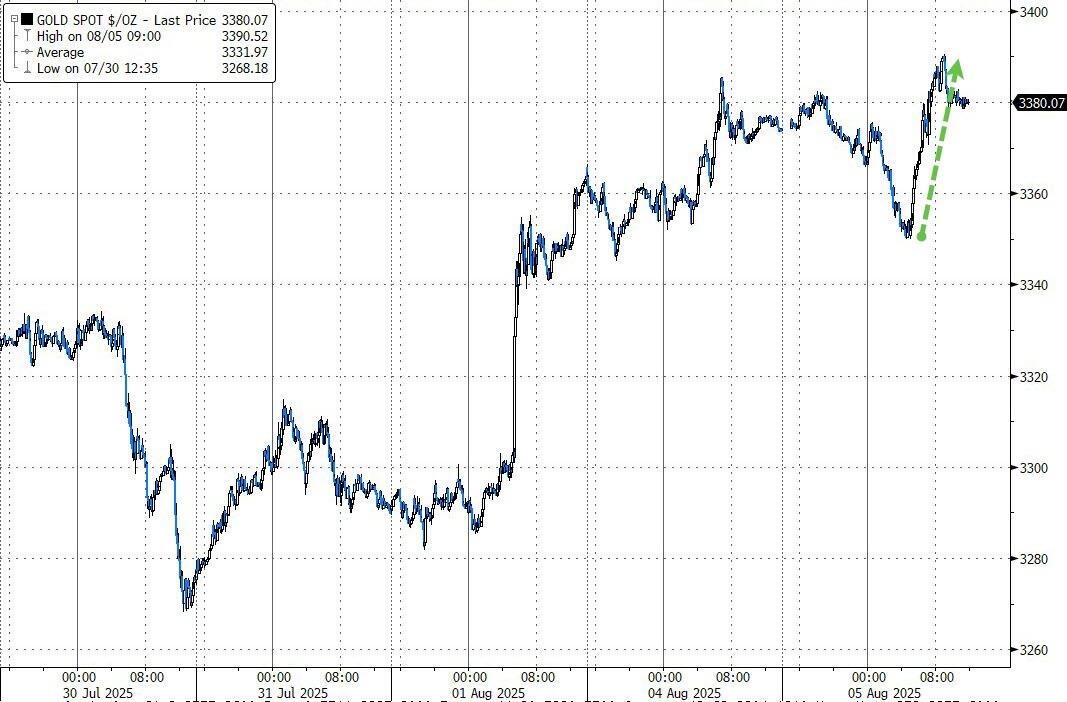
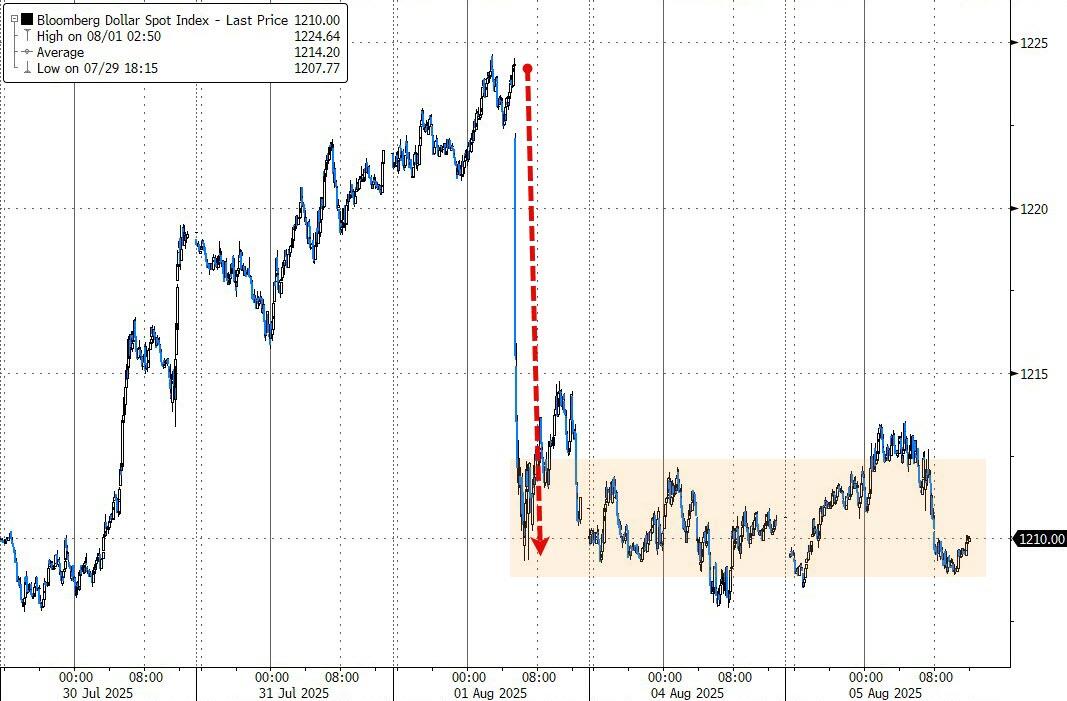
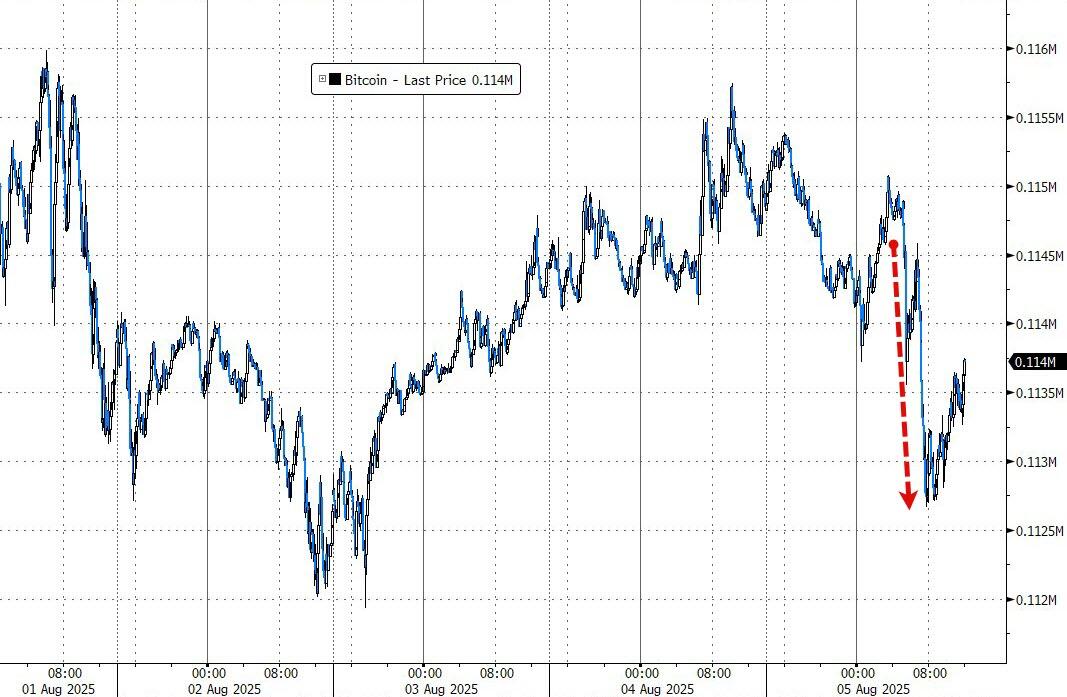
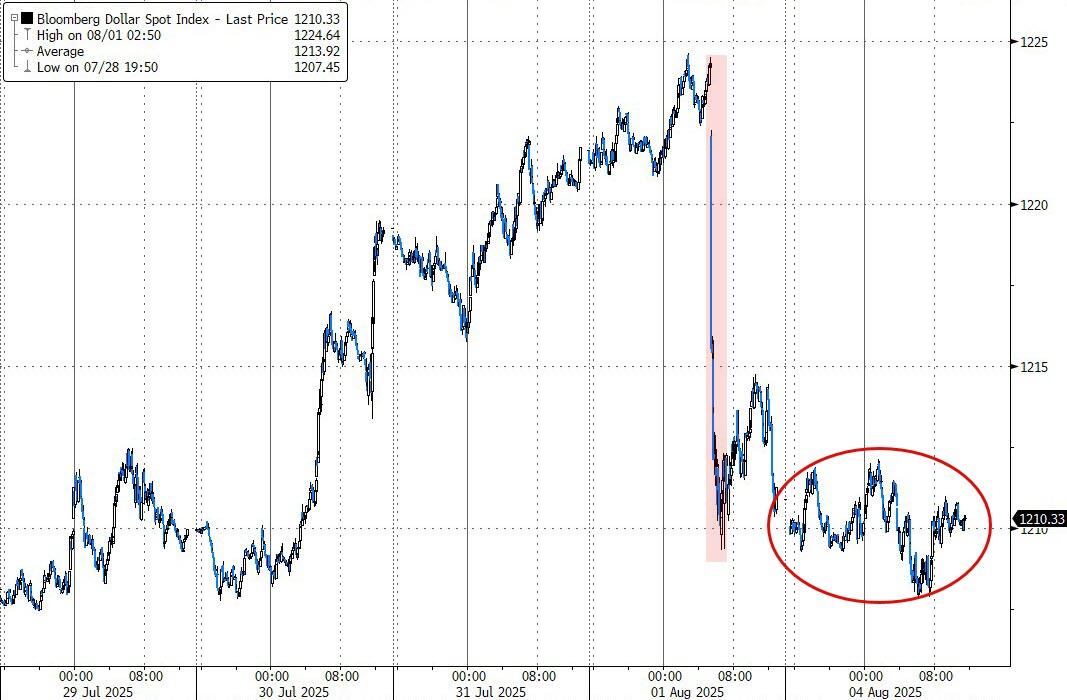
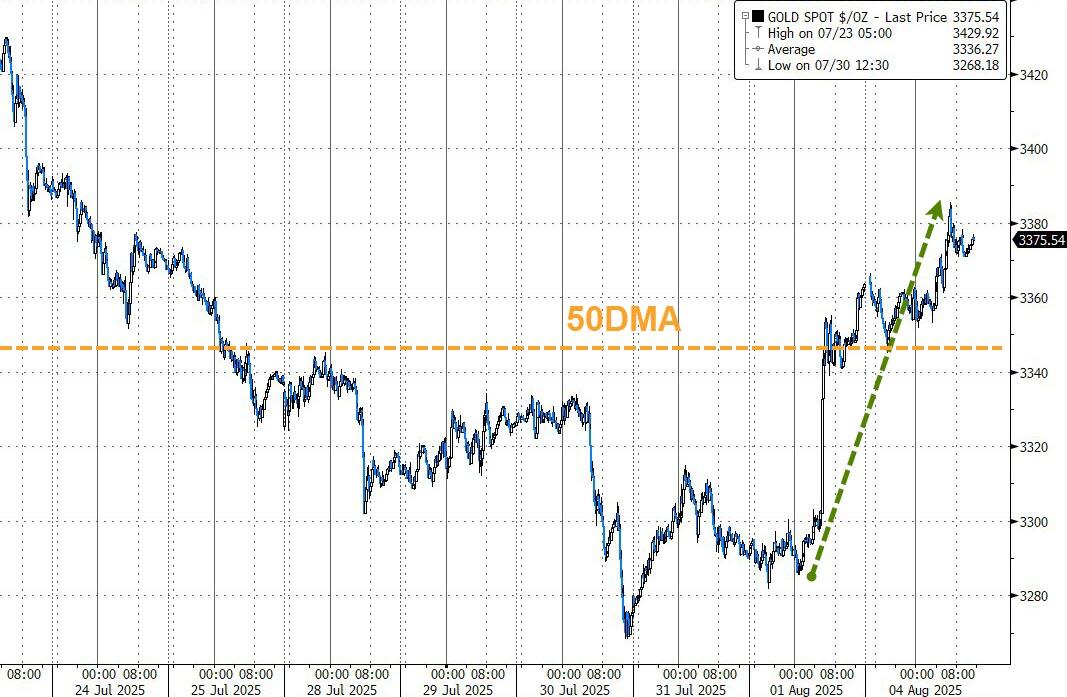
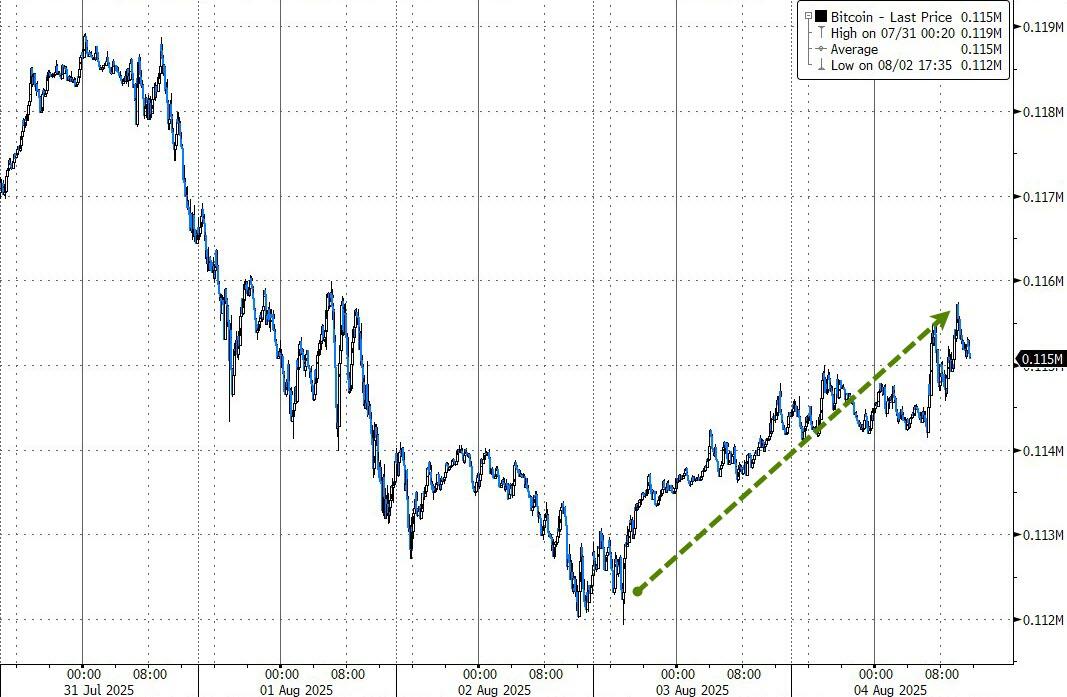
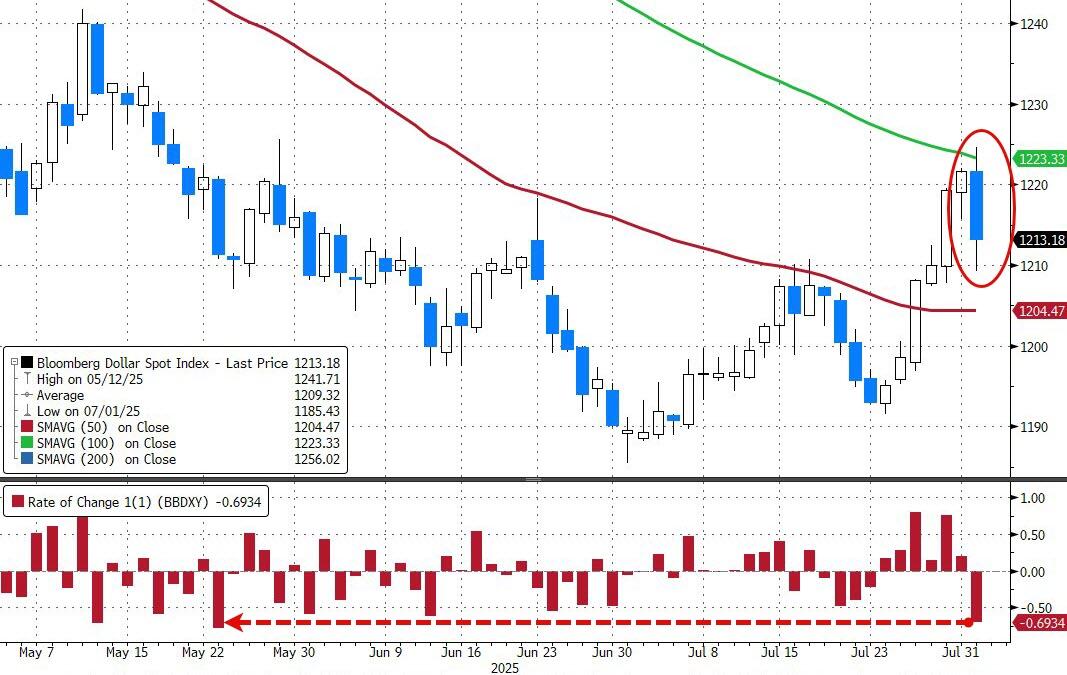
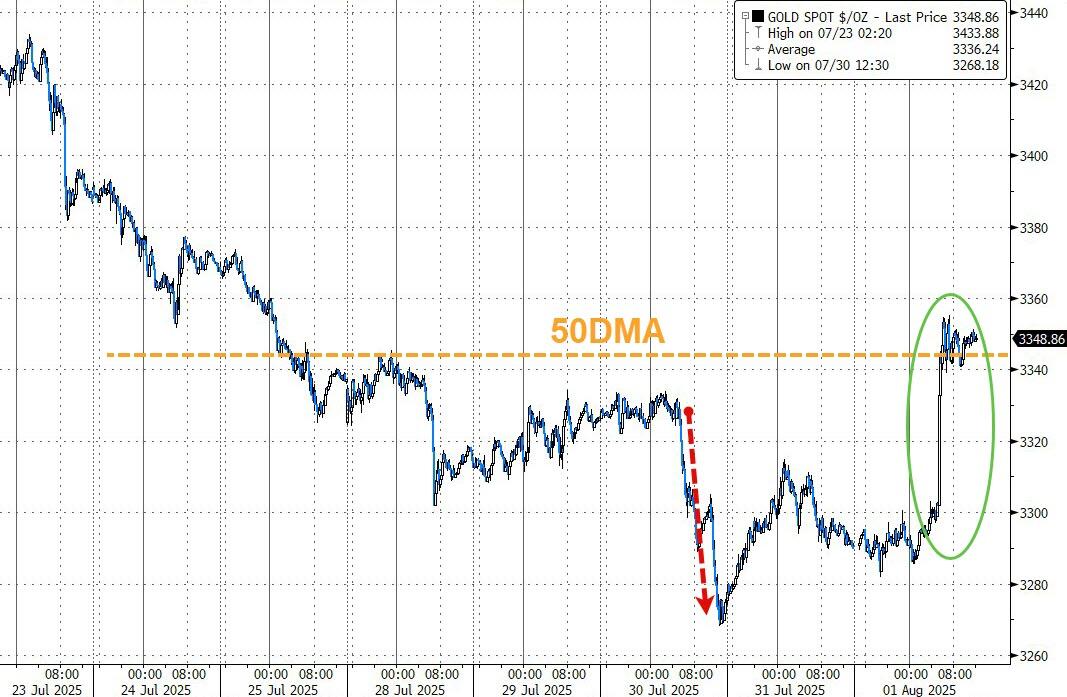
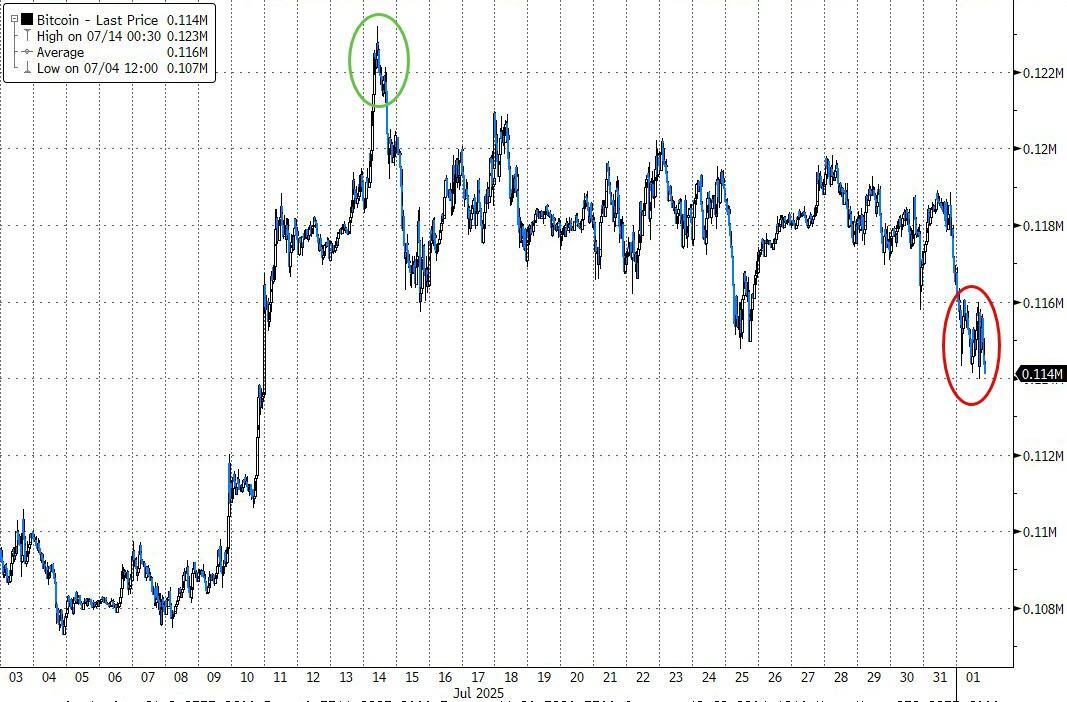
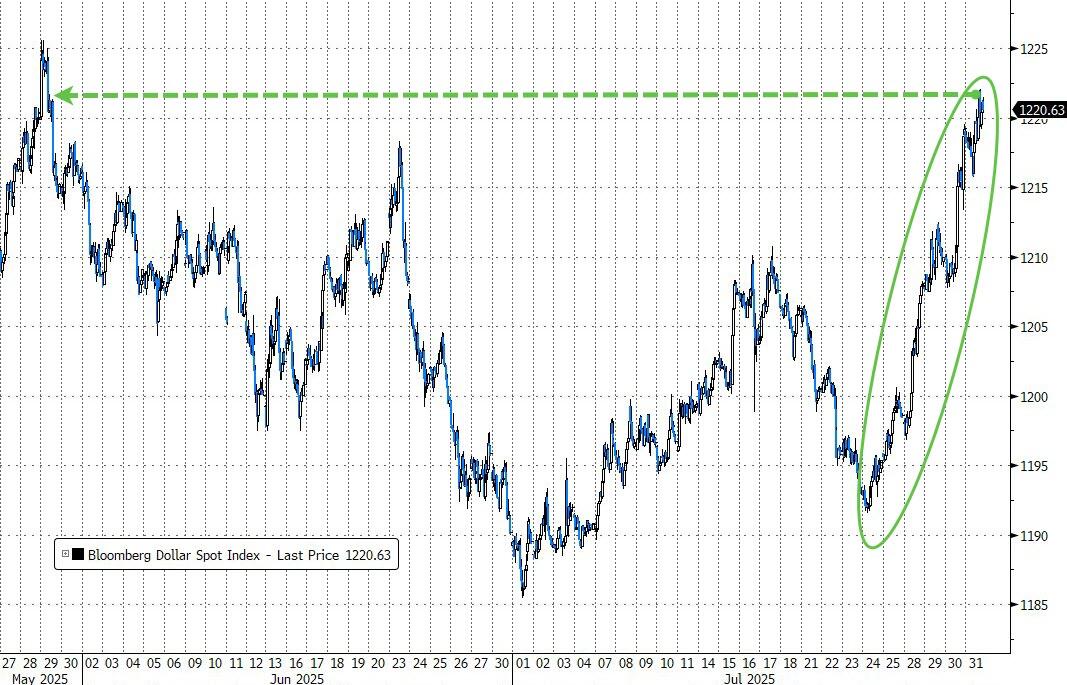
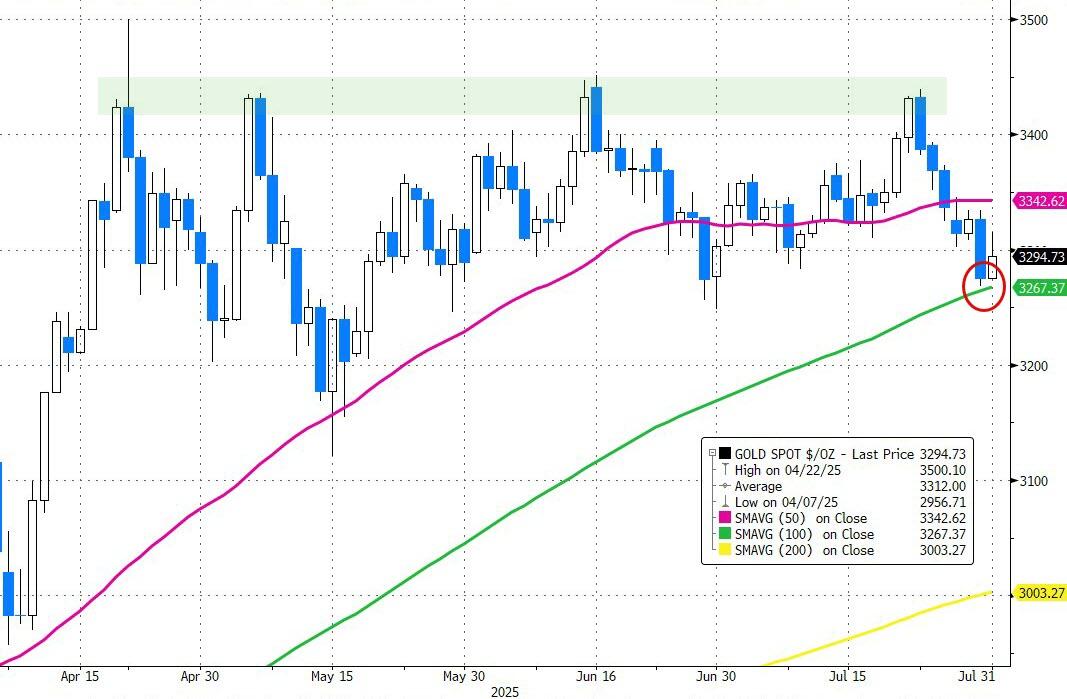
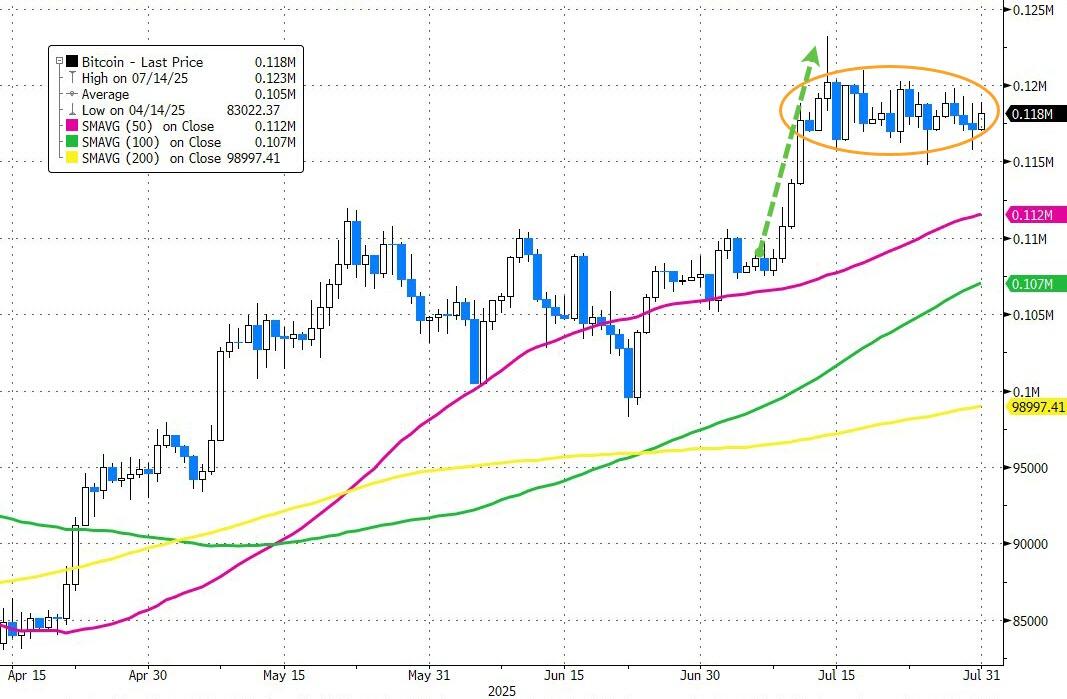
With inflation jitters creeping in, gold ticked higher, the dollar didn’t budge much, and Bitcoin had a rough day before bouncing back to around $113,000.
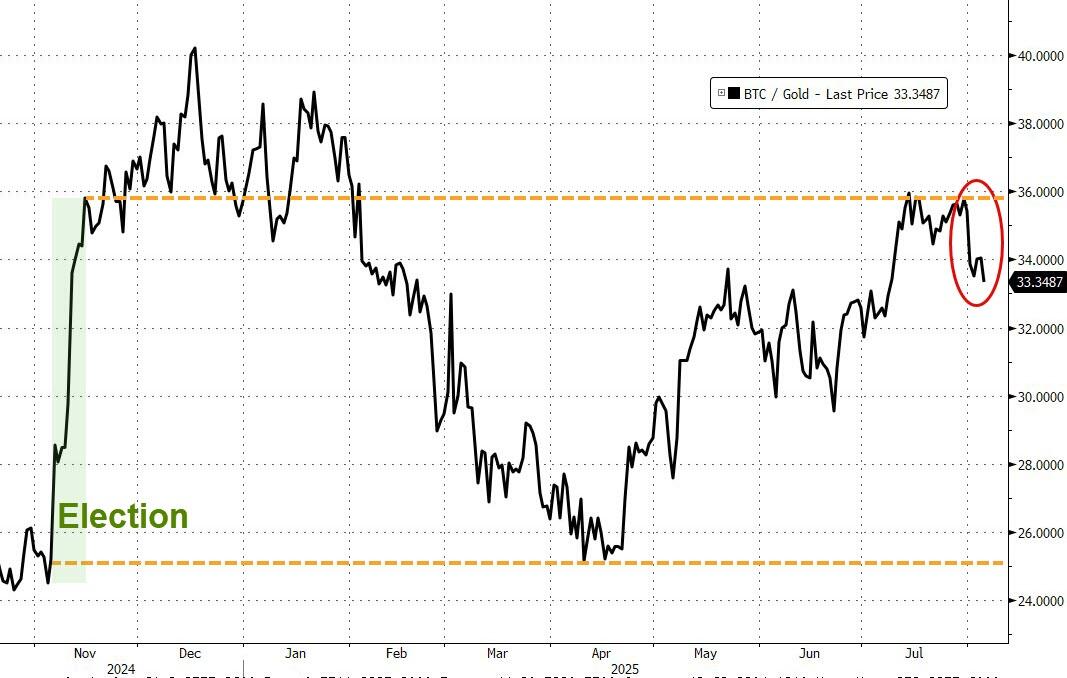
ZeroHedge noted that Bitcoin’s run of outperforming gold seems to have stalled. Could it be time for precious metals to shine again?
Read More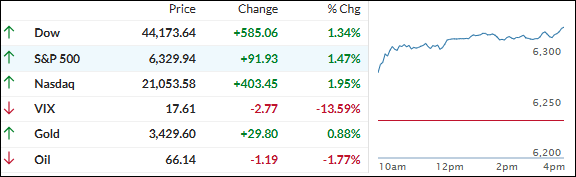
