Tech Titans Lead Nasdaq Rally Amid Earnings Surprises

Ulli Market Commentary Contact

[Chart courtesy of MarketWatch.com]

  1. Moving the market

The tech sector saw a significant boost, led by Advanced Micro Devices (AMD), which lifted the Nasdaq to an impressive gain after surpassing second-quarter expectations. Nvidia followed suit, achieving its largest single-day gain ever at 12%. Meanwhile, Microsoft experienced a decline due to underwhelming cloud business performance but managed to recover by the close of trading.

Despite reporting a larger-than-expected loss and disappointing revenue, Boeing’s shares rose by 2% following the announcement of a new CEO.

The Nasdaq led the charge, with all major indexes climbing higher in anticipation of more earnings reports and the Federal Reserve’s decision on interest rates. The Fed opted to keep rates unchanged, but traders were keenly focused on any hints of a potential rate cut in September.

Fed Chair Powell maintained cautious optimism, suggesting that if inflation data continues to improve, a rate reduction could be considered at the next meeting. The Fed’s post-meeting statement was more optimistic, noting progress towards the 2% inflation target. This positive outlook fueled further gains in the tech sector, with companies like Apple, Meta, and Amazon joining the rally.

In July, gold emerged as the top performer, followed closely by bonds, while the dollar and crude oil ended the month in the red. Small Caps surged ahead by 12%, contrasting with the Nasdaq’s 1.5% decline, highlighting a significant divergence.

The most shorted stocks saw substantial gains, sustaining the rally throughout the session. Bond yields dropped, and gold reached its highest monthly closing level ever. Crude oil recovered some losses amid rising tensions in the Middle East, and Bitcoin, although down from its $70k high, still posted gains.

Thanks to the day’s rebound, the S&P 500 managed a slight gain for July. As we move into August, will the index be able to maintain this upward trajectory?

Read More

Market Volatility: Dollar Steady, Gold Rises, Bitcoin Nears $66k

Ulli Market Commentary Contact

[Chart courtesy of MarketWatch.com]

  1. Moving the market

The stock market opened on a positive note but soon fluctuated around their respective unchanged lines, as traders focused on earnings reports and the Federal Reserve’s policy meeting. By the end of the session, only the Dow managed to close in positive territory, while the S&P 500 and Nasdaq ended in the red.

Interestingly, despite the Nasdaq being the top performer year-to-date and Small Caps lagging, today marked a point where both indices realigned.

Earnings reports have been well received so far, with about 80% of the more than 230 S&P 500 companies that have reported beating expectations. Analysts seem comfortable with the consensus earnings per share (EPS) and the corporate commentaries provided.

The two-day Federal Reserve meeting began this morning, with traders eagerly awaiting clearer signals about the timing and extent of rate cuts expected for the rest of the year. The likelihood of a rate cut in September has now risen to 100%.

The MAG7 stocks experienced a tumble but managed to rebound from their lows by the close. Meanwhile, most shorted stocks and semiconductors faced significant declines, reminiscent of last year’s performance.

The dollar suffered volatility but ended the day unchanged, while gold prices steadily increased. Bond yields slipped, Bitcoin approached $66,000, but Nvidia had a particularly rough day, losing nearly 8%.

This raises the question: Is this pattern still in play but on a much larger scale?

Read More

Tech Giants’ Earnings And Fed Meeting Keep Markets On Edge

Ulli Market Commentary Contact

[Chart courtesy of MarketWatch.com]

  1. Moving the market

With a busy week of earnings ahead, the major indexes began the session on a positive note.

However, after much fluctuation, they ended nearly unchanged. The tech sector is poised for significant movement as industry giants like Microsoft, Meta, Amazon, and Apple are set to report their earnings in the coming days.

Additionally, the Federal Reserve is scheduled to announce its latest policy statement on Wednesday. Although an interest rate cut is not anticipated, traders will be closely analyzing the Fed’s language for any hints of dovish changes that might occur during their September meeting.

Last week was marked by volatility in the markets, with major indexes showing divergence: the S&P 500 and Nasdaq declined, while the Dow and Small Caps saw gains. The tech sector’s cooling off contributed to the S&P 500 and Nasdaq’s drop.

Small Caps fell today as the short squeeze lost momentum, bond yields remained stagnant, and expectations for rate cuts in 2025 increased. The dollar strengthened, gold prices remained steady, and crude oil prices retreated to two-month lows. Bitcoin’s value dropped from $70k to $67k after the administration decided to transfer $2 billion from its stockpile.

It seems that traders and markets were on edge today, anticipating the Fed meeting and major earnings releases later this week. These upcoming events will certainly impact market sentiment.

But in which direction?

Continue reading…

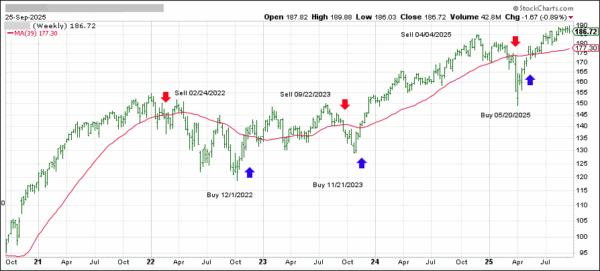
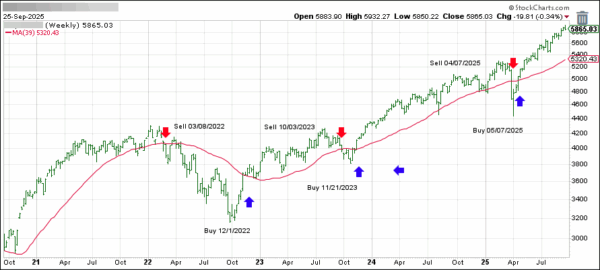
2. Current “Buy” Cycles (effective 11/21/2023)

Our Trend Tracking Indexes (TTIs) have both crossed their trend lines with enough strength to trigger new “Buy” signals. That means, Tuesday, 11/21/2023, was the official date for these signals.

If you want to follow our strategy, you should first decide how much you want to invest based on your risk tolerance (percentage of allocation). Then, you should check my Thursday StatSheet and Saturday’s “ETFs on the Cutline” report for suitable ETFs to buy.

3. Trend Tracking Indexes (TTIs)

Despite several early attempts to rally, the major indexes ultimately closed the session with minimal change, hovering just around the unchanged line.

Similarly, our TTIs showed little direction throughout the day, though they did manage to close slightly higher.

This is how we closed 07/29/2024:

Domestic TTI: +6.74% above its M/A (prior close +6.59%)—Buy signal effective 11/21/2023.

International TTI: +5.82% above its M/A (prior close +5.80%)—Buy signal effective 11/21/2023.

All linked charts above are courtesy of Bloomberg via ZeroHedge.

———————————————————-

WOULD YOU LIKE TO HAVE YOUR INVESTMENTS PROFESSIONALLY MANAGED?

Do you have the time to follow our investment plans yourself? If you are a busy professional who would like to have his portfolio managed using our methodology, please contact me directly to get more details.

ETFs On The Cutline – Updated Through 07/26/2024

Ulli ETFs on the Cutline Contact

Do you want to know which ETFs are hot and which ones are not? Then you need my High-Volume ETF Cutline report. It tells you how close or far each of the 311 ETFs I follow is from its long-term trend line (39-week SMA). These are the ETFs that trade more than $5 million a day, so they are not some obscure funds that nobody cares about.

The report is split into two parts: The winners that are above their trend line (%M/A), and the losers that are below it. The yellow line is the line of shame that separates them. You can see how many ETFs are in each group and how they have changed since the last report (276 vs. 269 current).

Take a peek:

The HV ETF Master Cutline Report

If you are confused by some of the terms we use, don’t panic. I have a helpful Glossary of Terms for you.

If you want to learn more about the Cutline method and how it can make you rich (or at least less poor), read my original post here.

ETF Tracker Newsletter For July 26, 2024

Ulli ETF Tracker Contact

ETF Tracker StatSheet          

You can view the latest version here.

MARKET AWAITS KEY MACRO EVENTS AFTER WEEK OF MIXED PERFORMANCES

[Chart courtesy of MarketWatch.com]

  1. Moving the market

Today, stocks staged a notable comeback, attempting to recover some of the declines experienced earlier in the week as traders analyzed the latest inflation data.

Several factors contributed to this rebound: Market sentiment was oversold, Thursday’s GDP report exceeded expectations, and there is growing optimism that the Federal Reserve may soon soften its interest rate policy.

June’s Personal Consumption Expenditure Price Index (PCE) rose by 0.1% month-over-month and 2.5% year-over-year, both figures aligning with estimates and providing no negative surprises.

Traders continued to rotate into cyclical sectors and Small Caps, which gained an additional 2%. Industrials, real estate, and financials also showed signs of recovery. The Dow led the charge with a 1.6% gain, partly driven by 3M’s impressive 20% surge, marking its best day since 1972.

The tech sector, however, faced a challenging period, with the MAG 7 stocks losing approximately $2 trillion in market value. Small Caps outperformed the Nasdaq, adding 3% while the Nasdaq lost 3%, a scenario reminiscent of the dotcom bubble peak.

Bond yields slipped as expectations for rate cuts increased slightly. The dollar edged higher, gold rebounded but closed lower for the week, and Bitcoin showed a mixed performance, bouncing back strongly to touch the $68k level. Meanwhile, oil prices declined.

Next week promises to be the busiest of the summer, with numerous macro events on the horizon, including the Federal Reserve meeting, CPI data, and earnings reports from 40% of the S&P 500 companies. These events are likely to significantly influence market direction.

But which way will the market go?

Read More

Weekly StatSheet For The ETF Tracker Newsletter – Updated Through 07/25/2024

Ulli ETF StatSheet Contact

ETF Data updated through Thursday, July 25, 2024

How to use this StatSheet:

  1. Out of the 1,800+ ETFs out there, I only pick the ones that trade over $5 million per day (HV ETFs), so you don’t get stuck with a lemon that nobody wants to buy or sell.
  1. Trend Tracking Indexes (TTIs)

These are the main indicators that tell you when to buy or sell Domestic and International ETFs (section 1 and 2). They do that by comparing their position to their long-term M/A (Moving Average). If they cross above, and stay there, it’s a green light to buy. If they fall below, and keep going, it’s a red light to sell. And to make sure you don’t lose your shirt if things go south, I also use a 12% trailing stop loss on all positions in these categories.

  1. All other investment areas don’t have a TTI and should be traded based on the position of each ETF relative to its own trend line (%M/A). That’s why I call them “Selective Buy.” In other words, if an ETF goes above its own trend line, you can buy it. But don’t forget to use a trailing sell stop of 12%, or less if you’re feeling nervous.

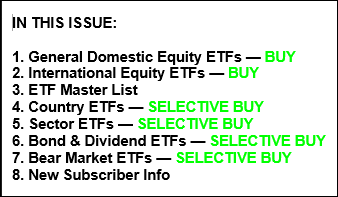
If some of these words sound like Greek to you, please check out the Glossary of Terms and new subscriber information in section 9.

  1. DOMESTIC EQUITY ETFs: BUY— since 11/21/2023

Click on chart to enlarge

This is our main compass, the Domestic Trend Tracking Index (TTI-green line in the above chart). It has broken above its long-term trend line (red) by +5.73% and is in “Buy” mode as posted.

Read More