
- Moving the markets
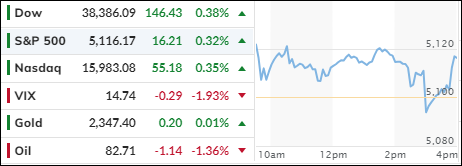
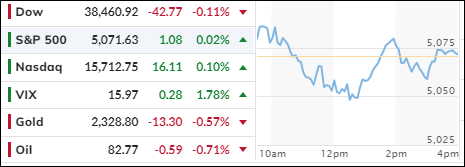
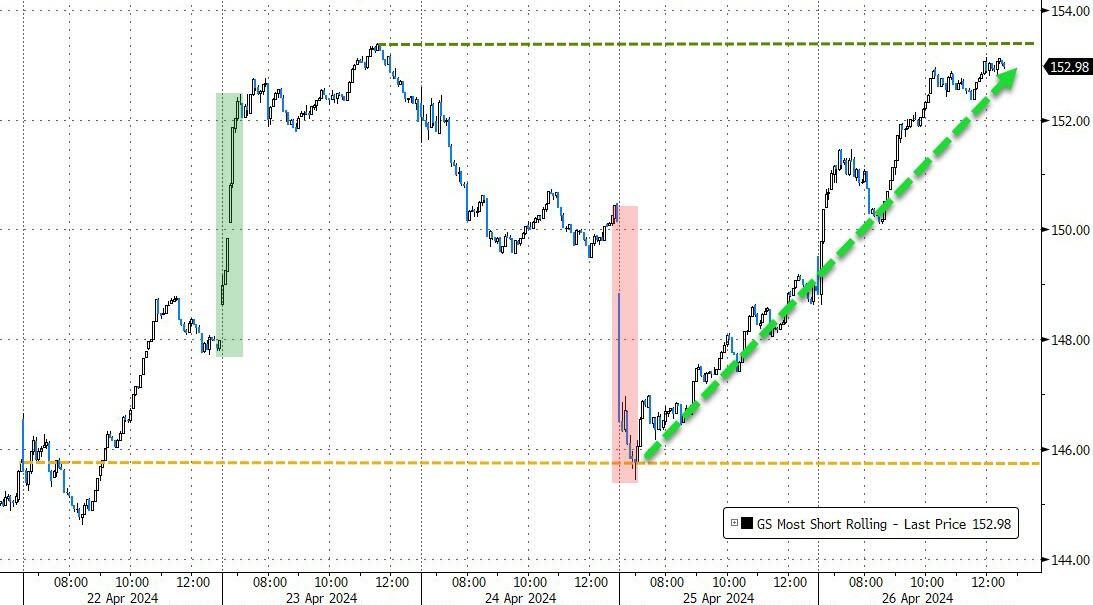
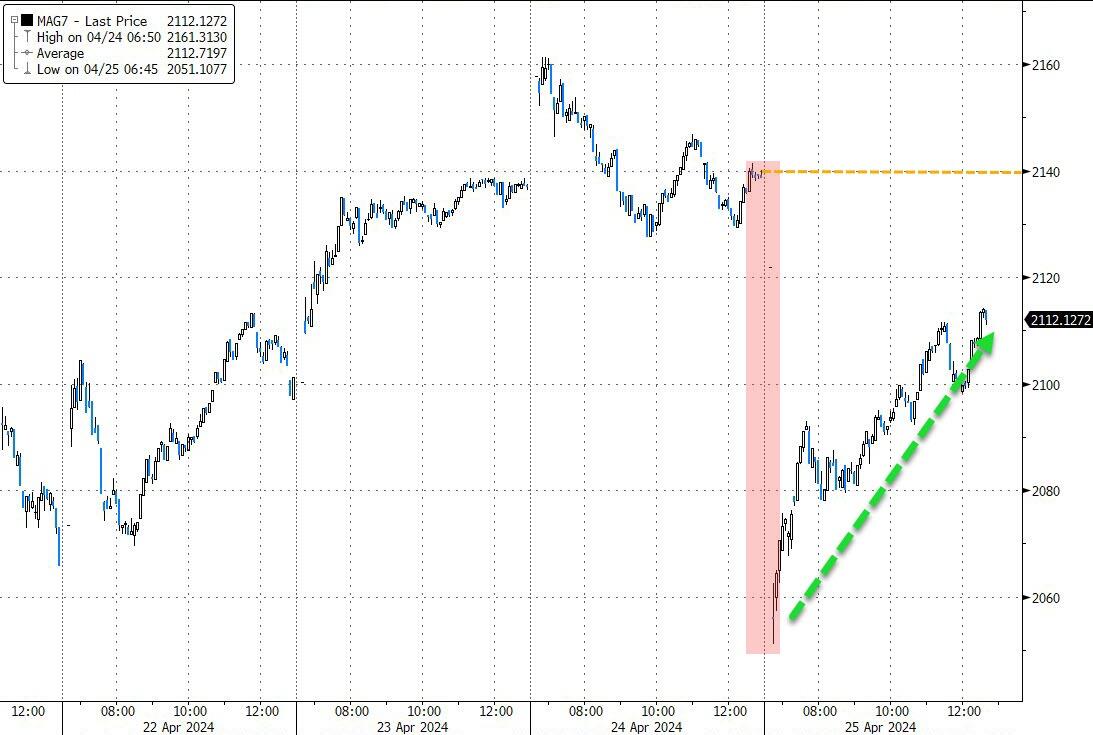
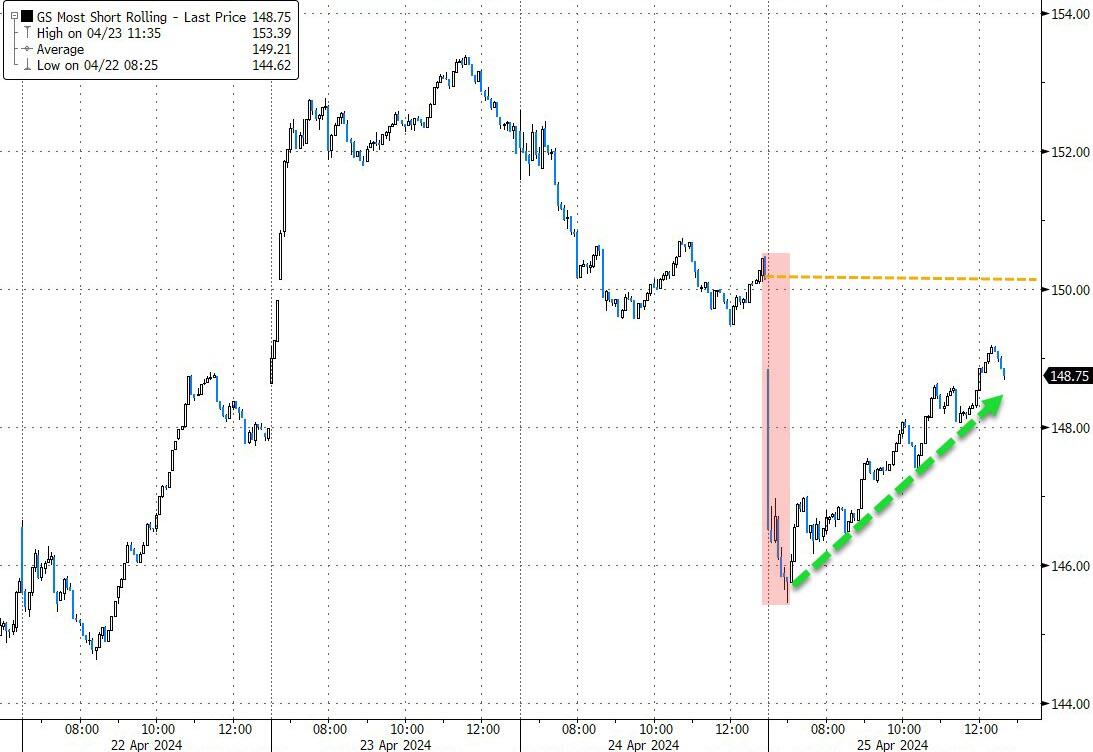
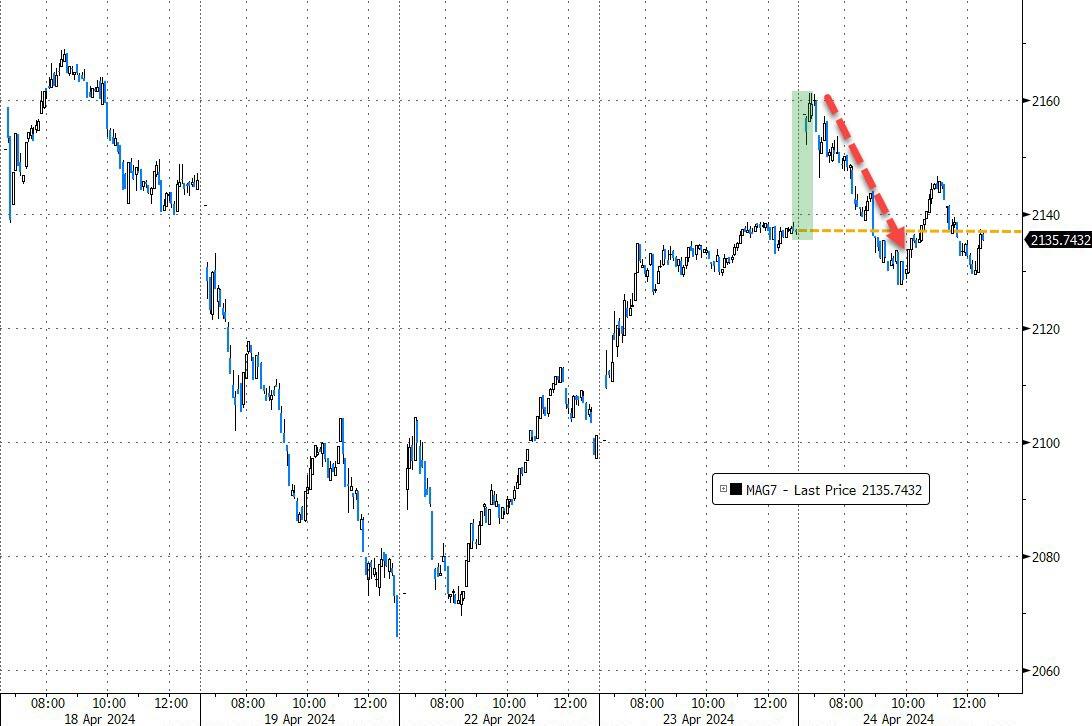
In today’s market session, traders witnessed a cautious upward trajectory with a hint of optimism. The major indexes, guided by selected mega-cap technology stocks, edged higher. However, beneath the surface, conflicting forces played out.
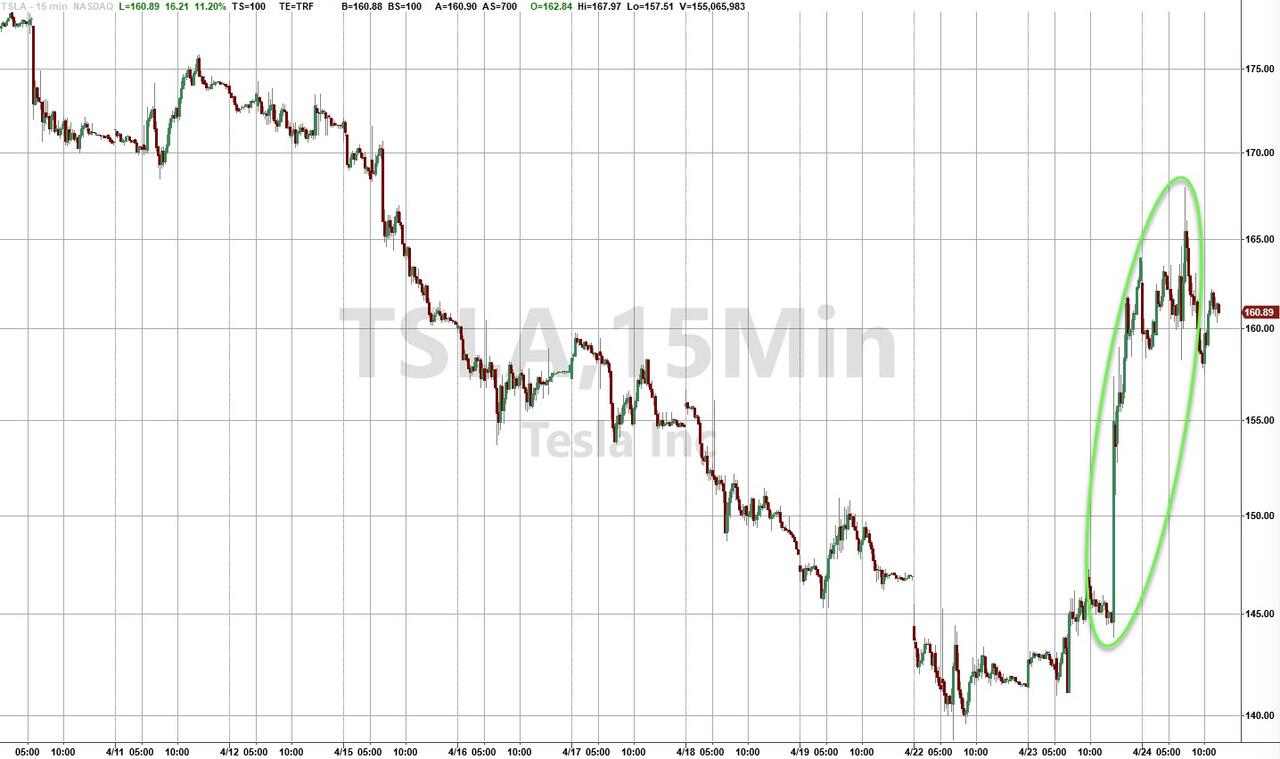
Tesla, the electric vehicle giant, surged nearly 11% after overcoming a significant regulatory hurdle related to its full self-driving technology in China. Meanwhile, Apple enjoyed a more than 3% boost following a bullish upgrade from investment firm Bernstein. However, other tech heavyweights—Microsoft, Alphabet, Meta, and Nvidia—struggled and traded lower.
The ongoing earnings season paints a mixed picture. Of the S&P 500-listed firms that have reported results so far, approximately 80% have surpassed expectations. This positive trend underscores the resilience of corporate America amid economic challenges.
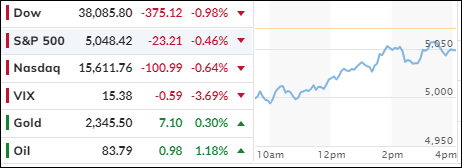
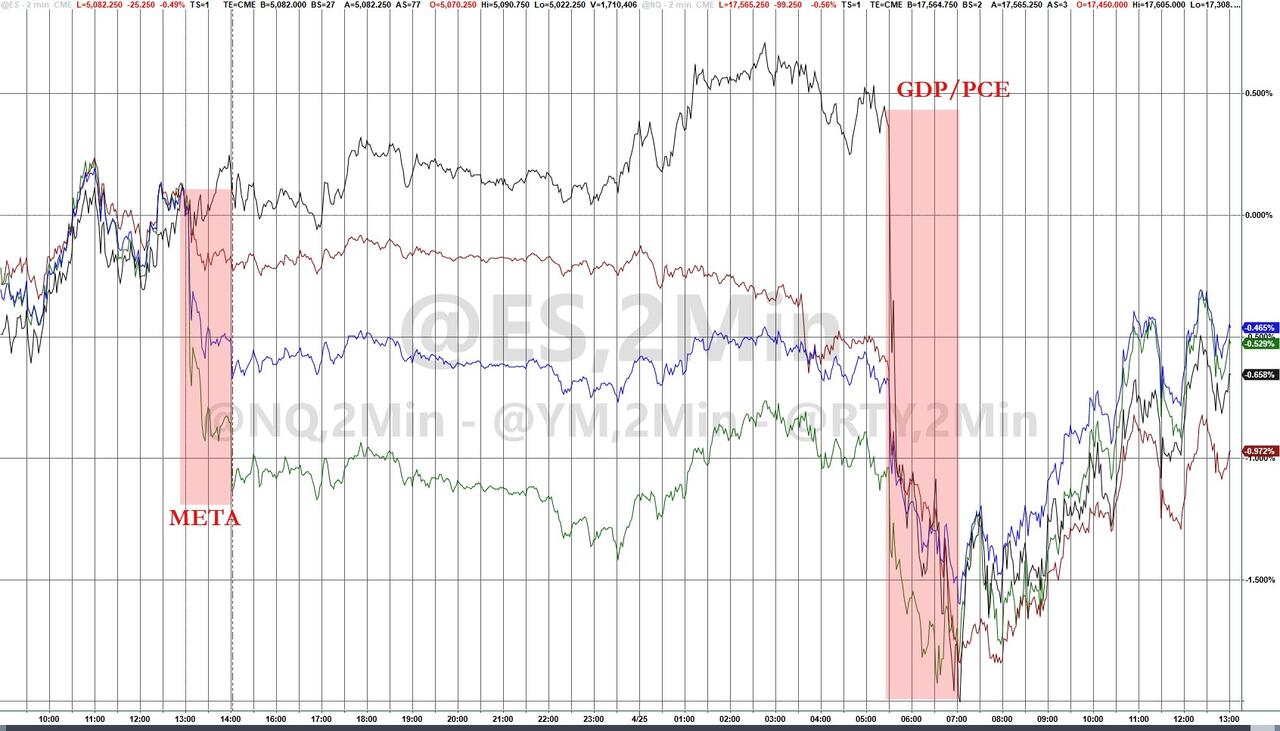
Today’s action provided a reprieve from the recent market downtrend, yet it was marked by choppiness. The broad S&P 500 and tech-heavy Nasdaq are both poised to end April down more than 2%, while the blue-chip Dow faces a potential slide of over 3%. Investors remain cautiously optimistic, balancing short-term volatility with long-term prospects.
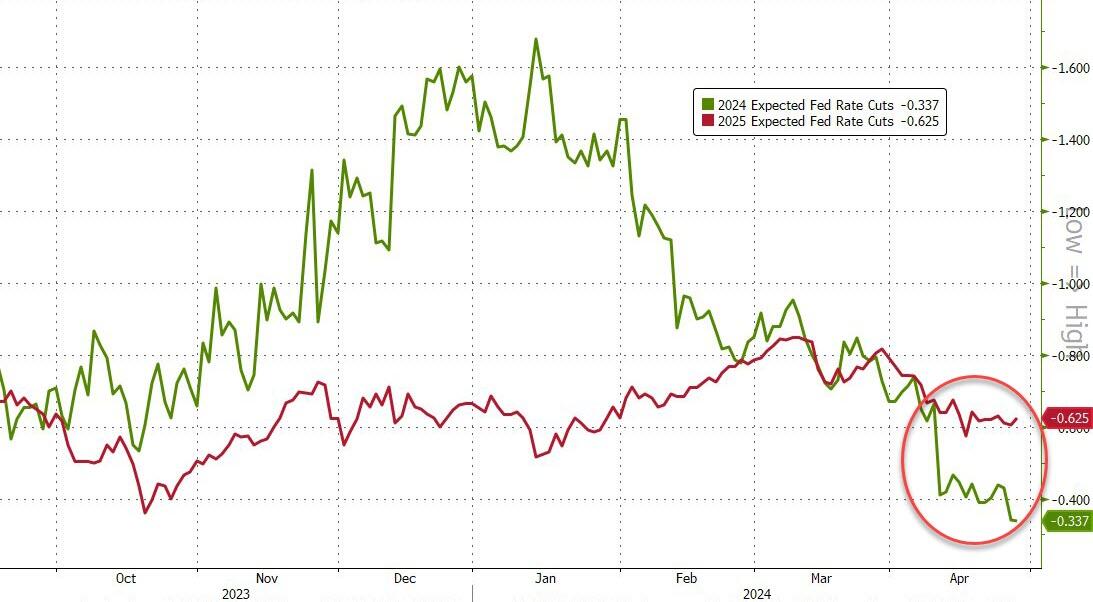
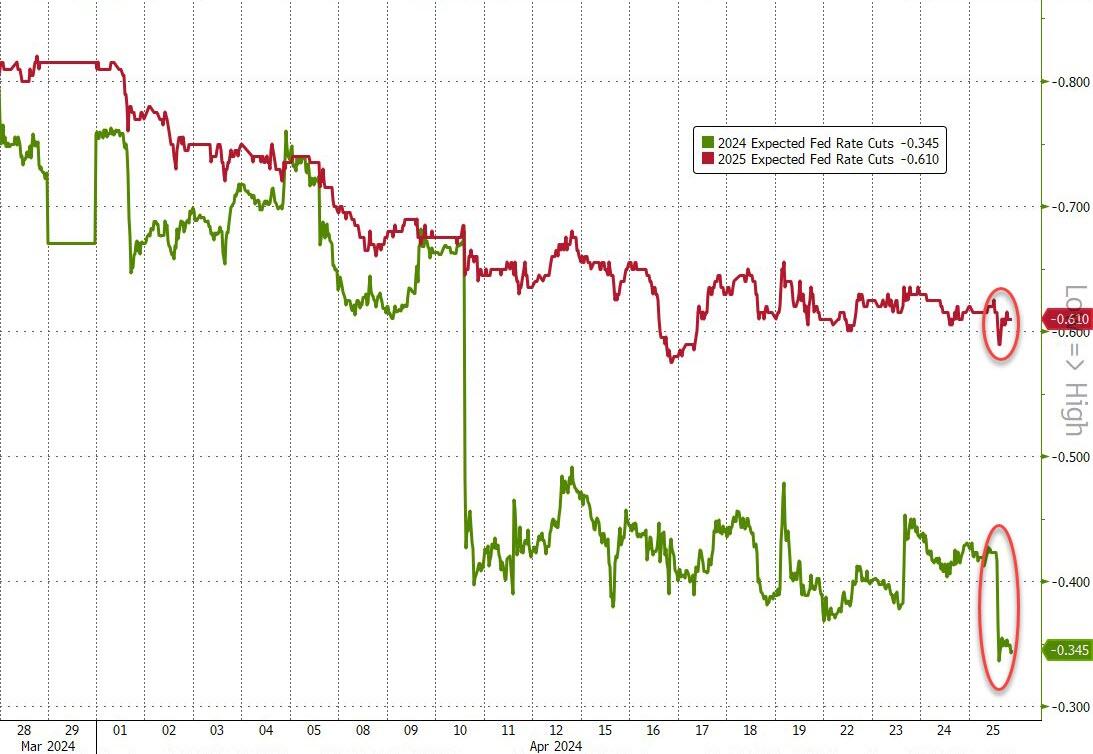
Later this week, all eyes will be on the Federal Reserve’s latest interest rate announcement, scheduled for Wednesday. While the central bank is widely expected to maintain borrowing costs unchanged, traders eagerly await Chair Jerome Powell’s post-announcement press conference. Will the Fed’s communication provide clarity on inflation concerns and the path forward?
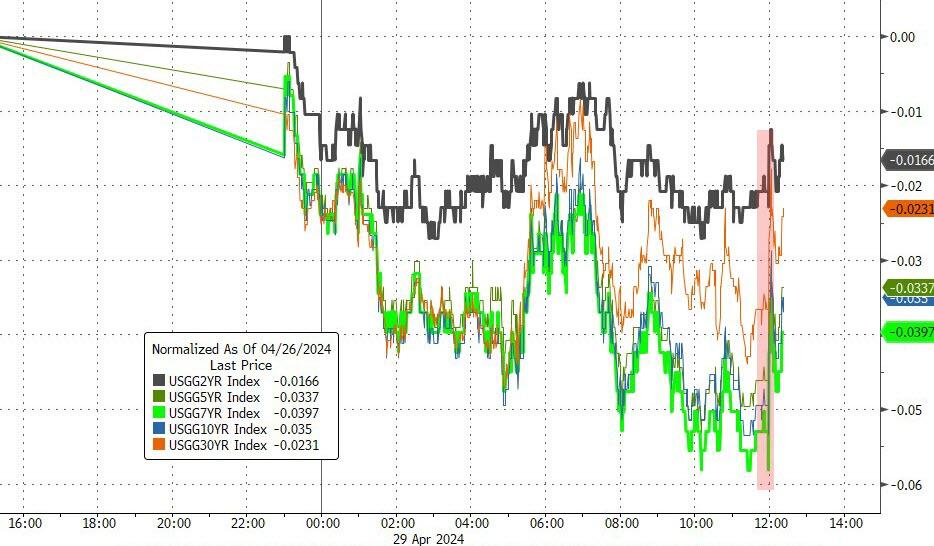
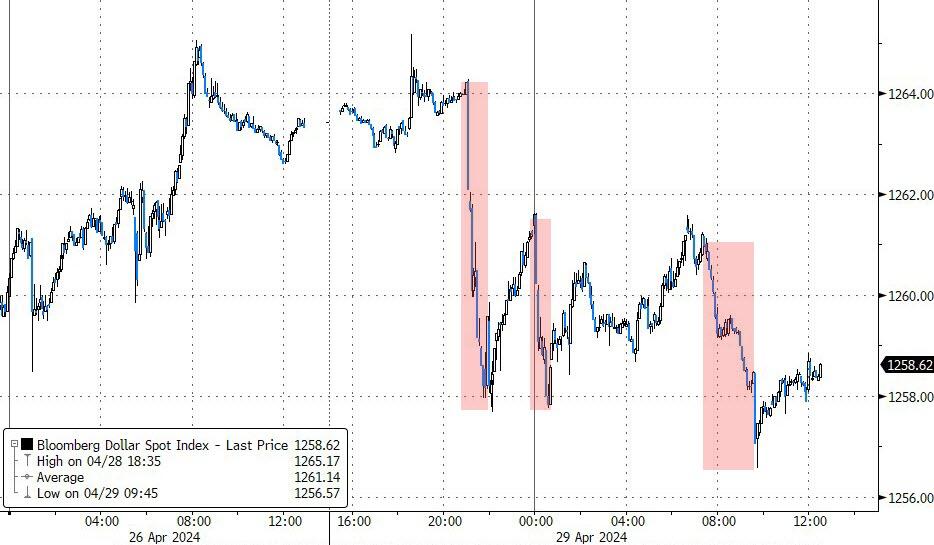
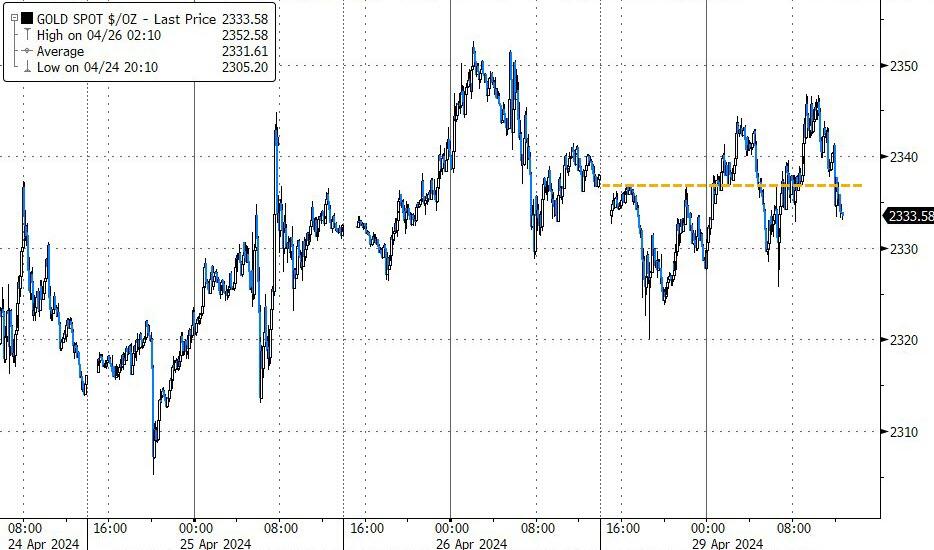
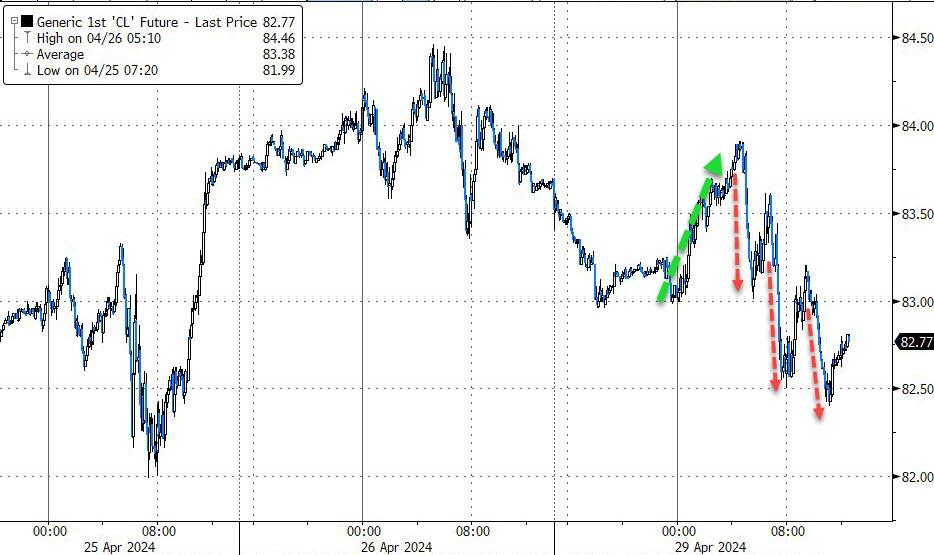
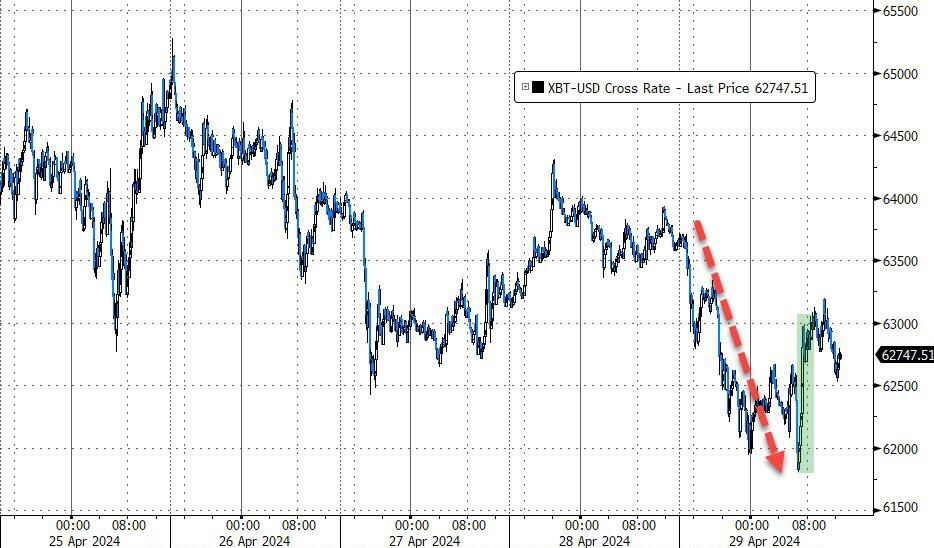
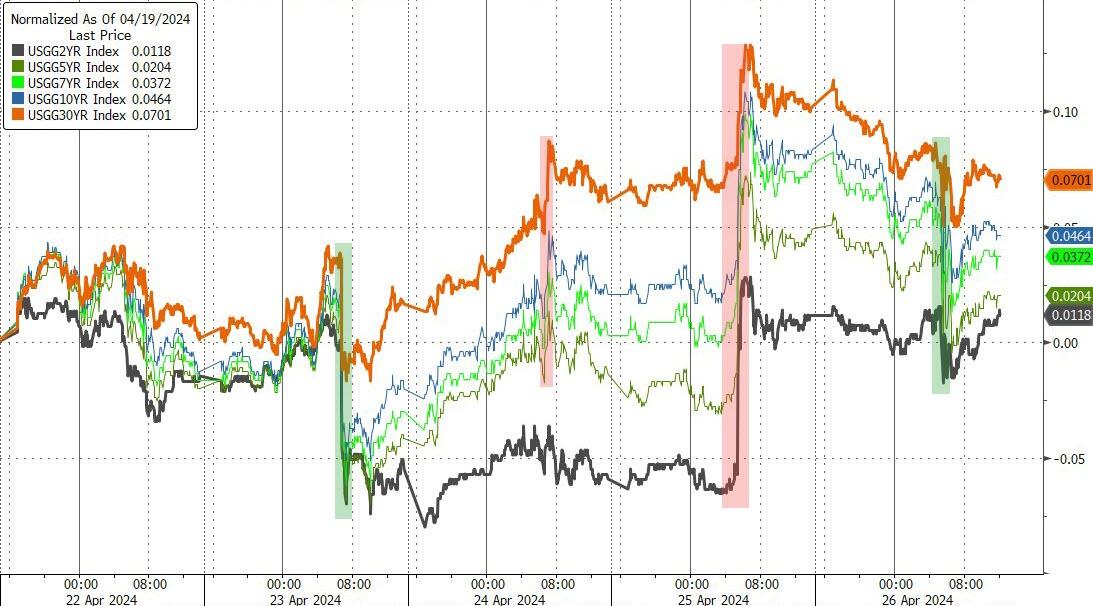
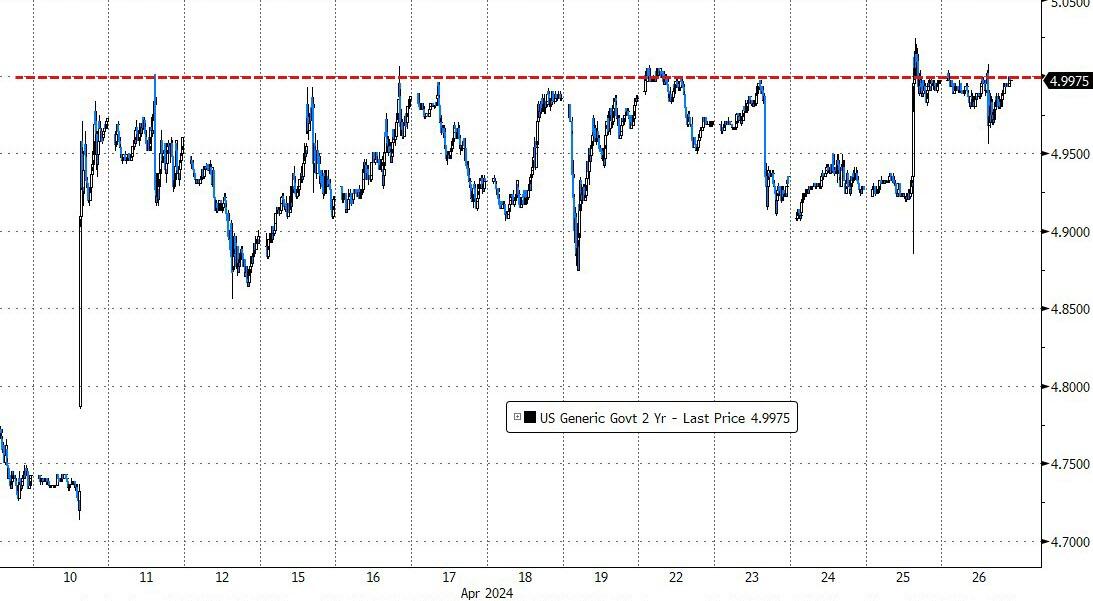
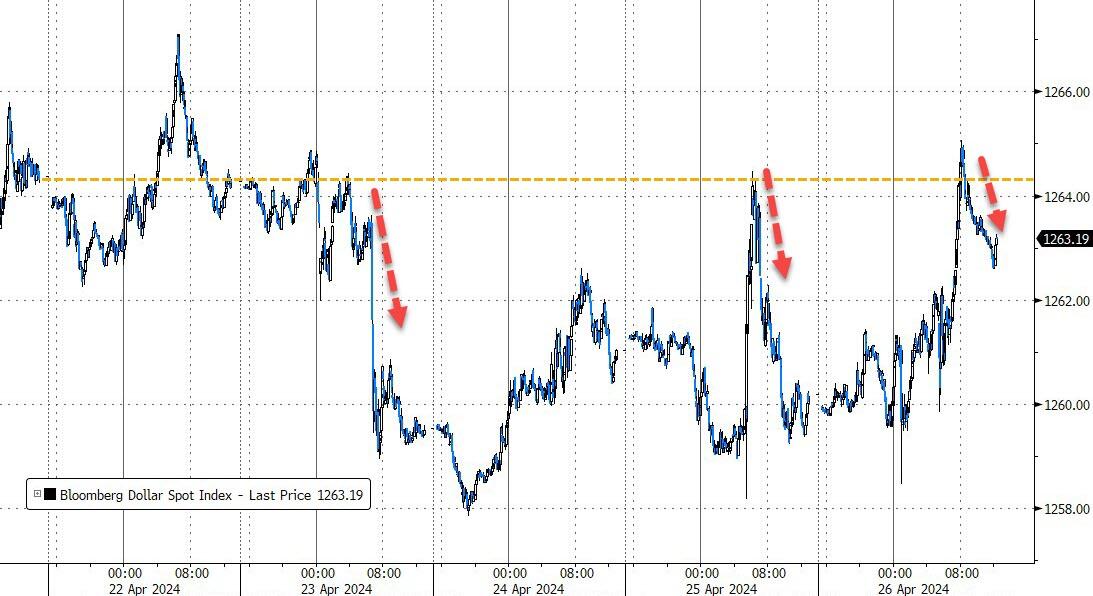
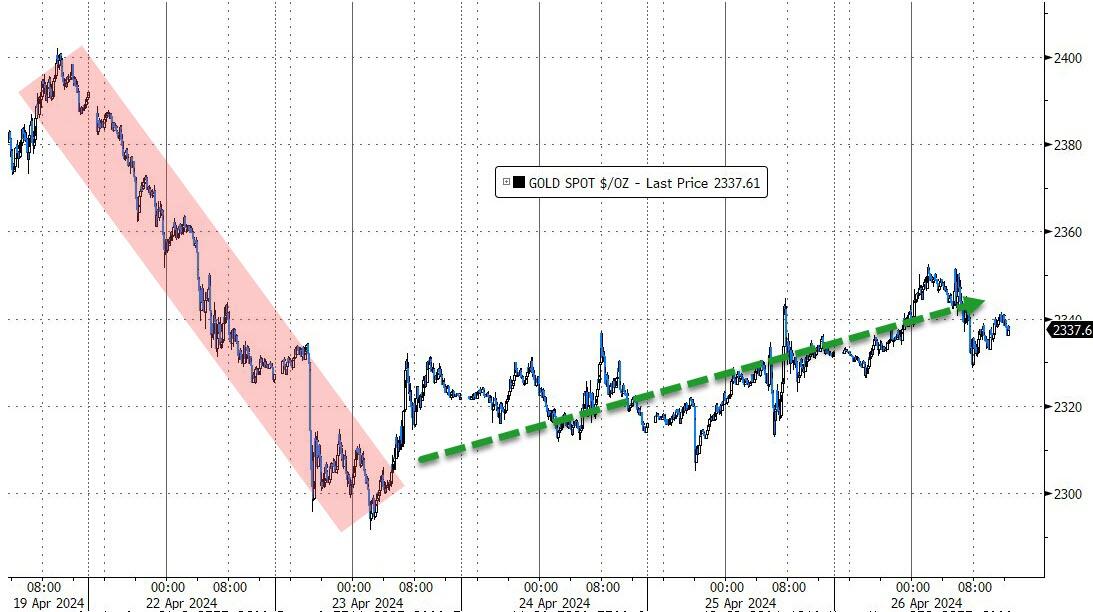
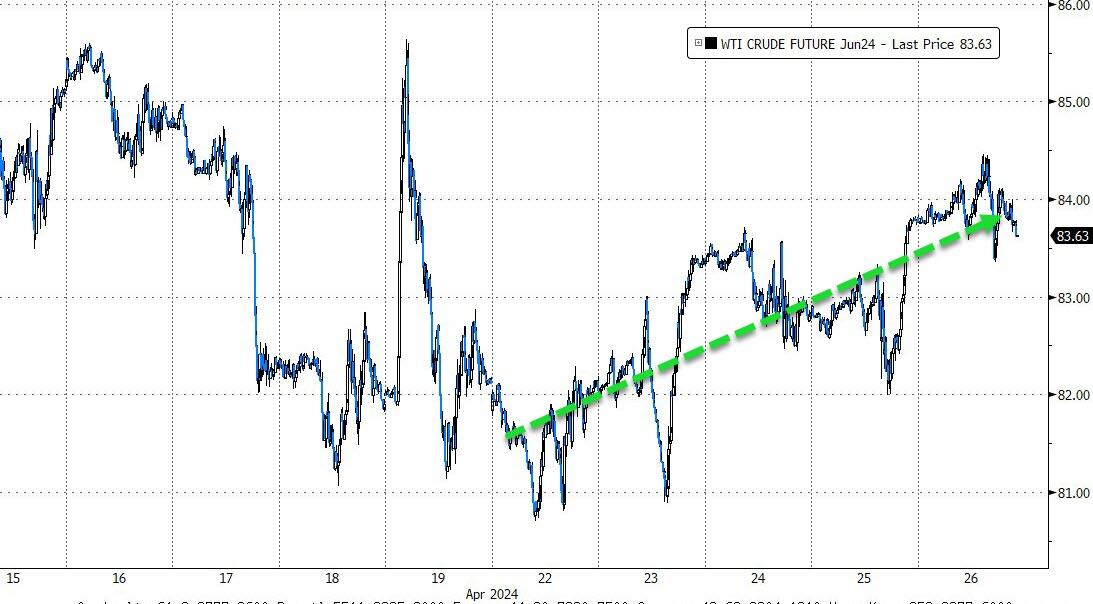
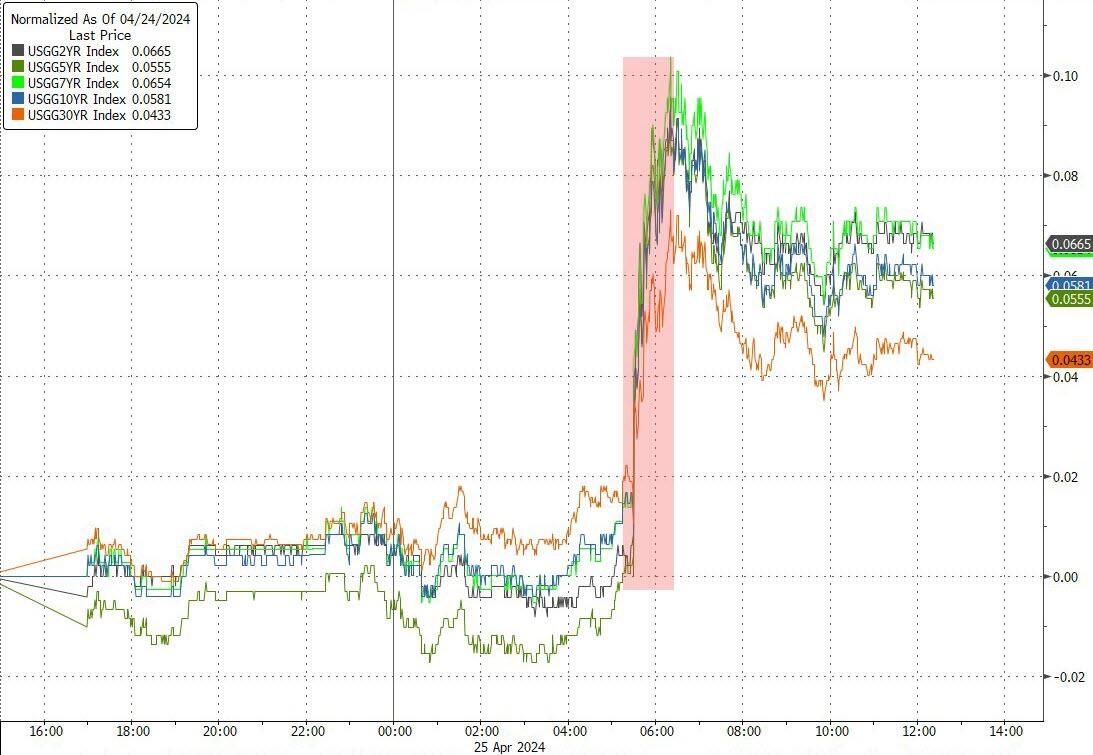
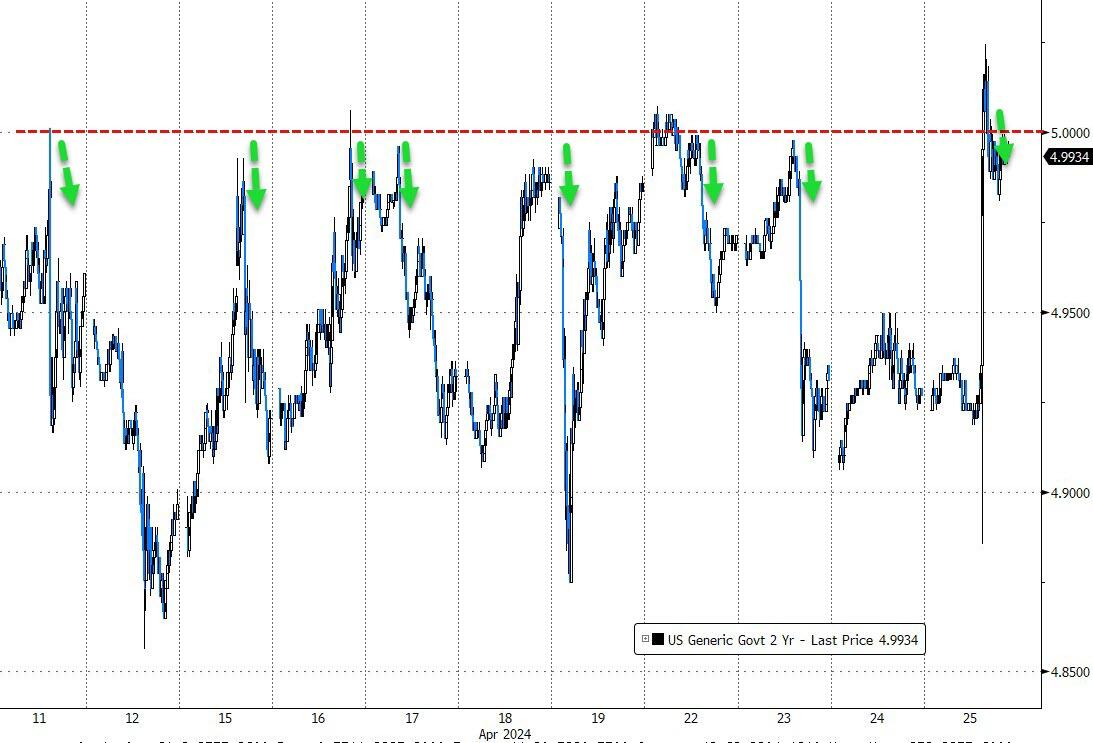
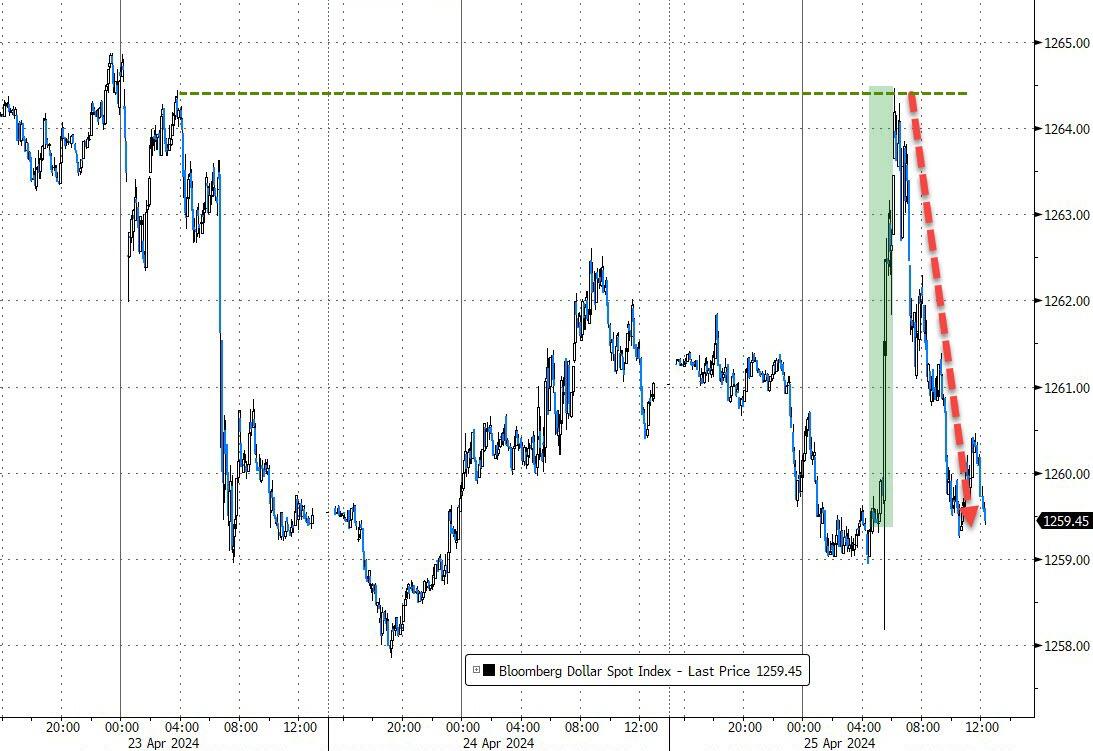
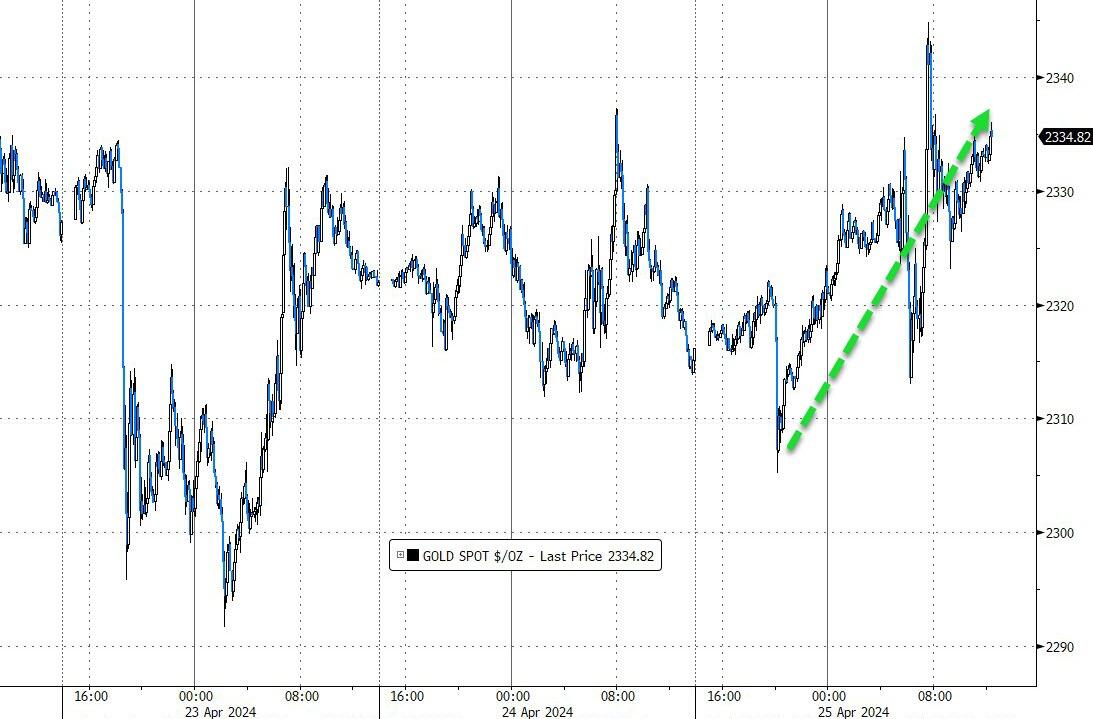
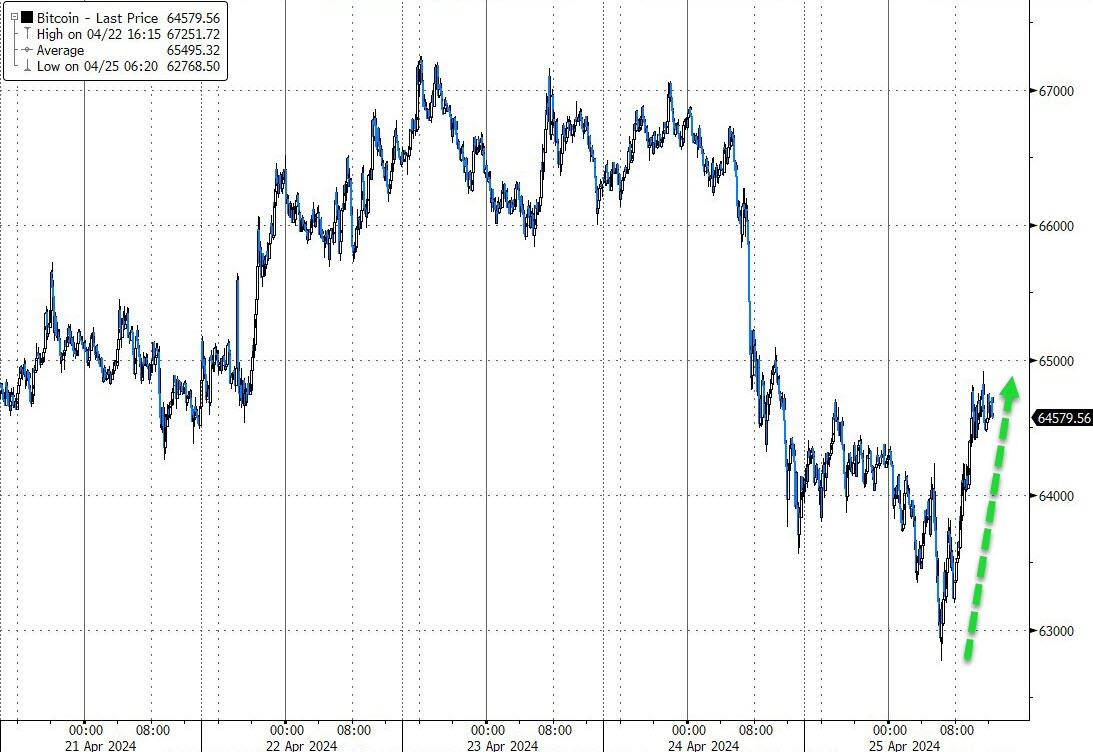
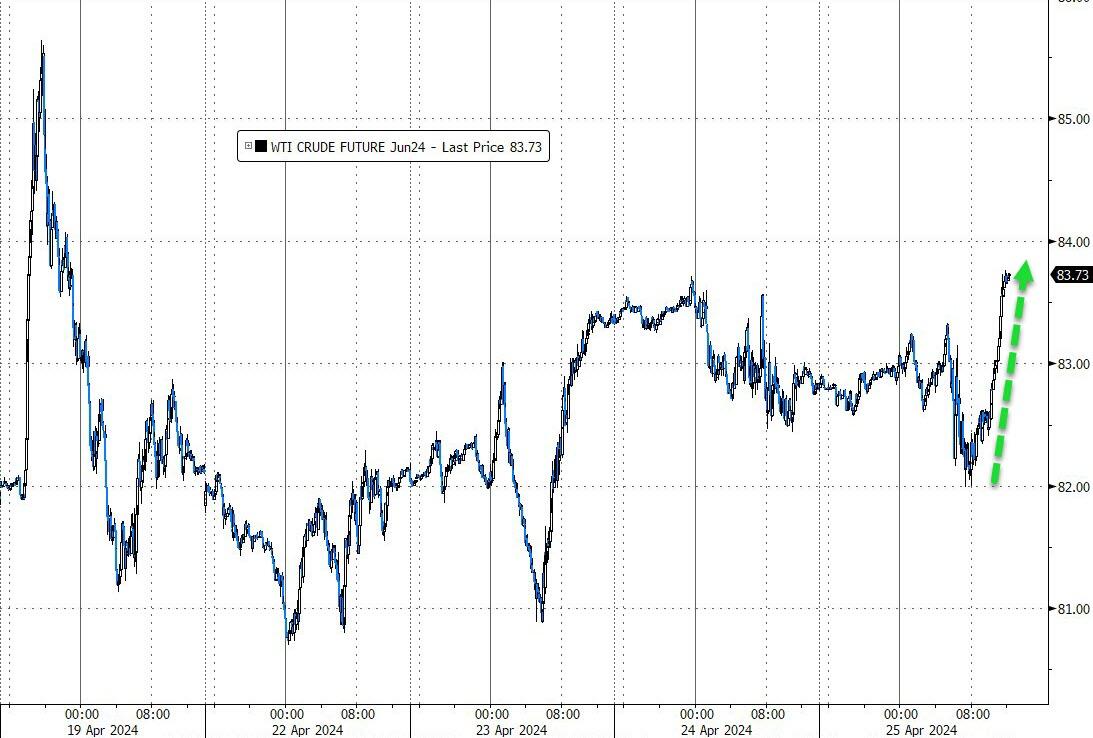
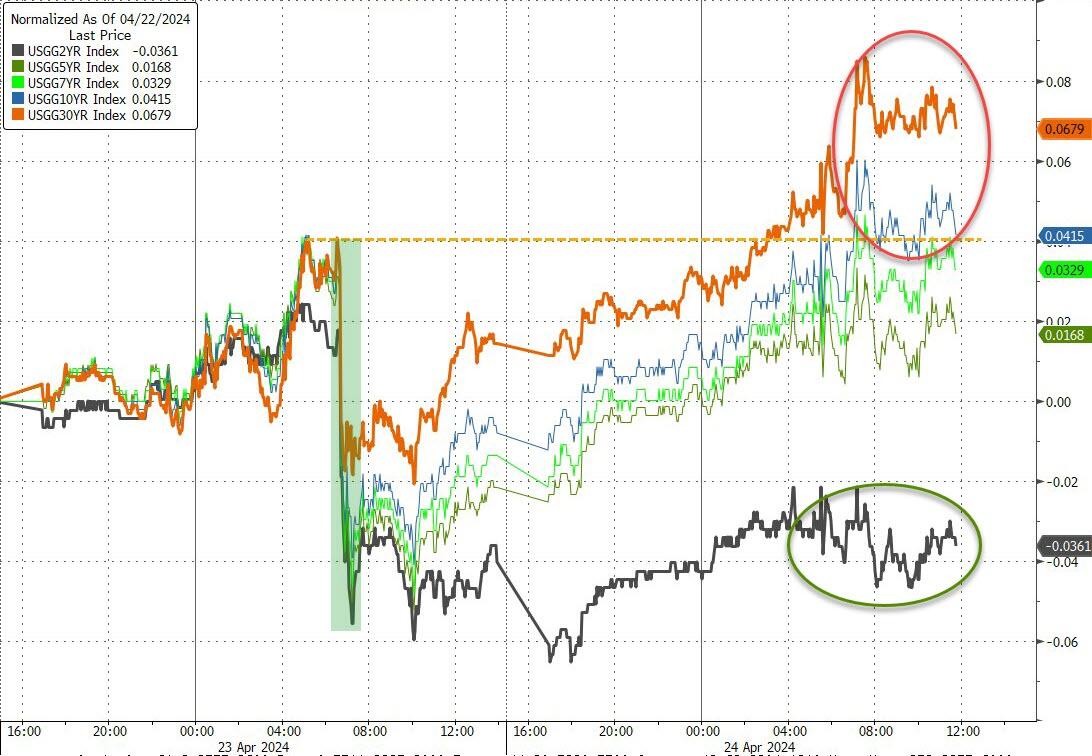
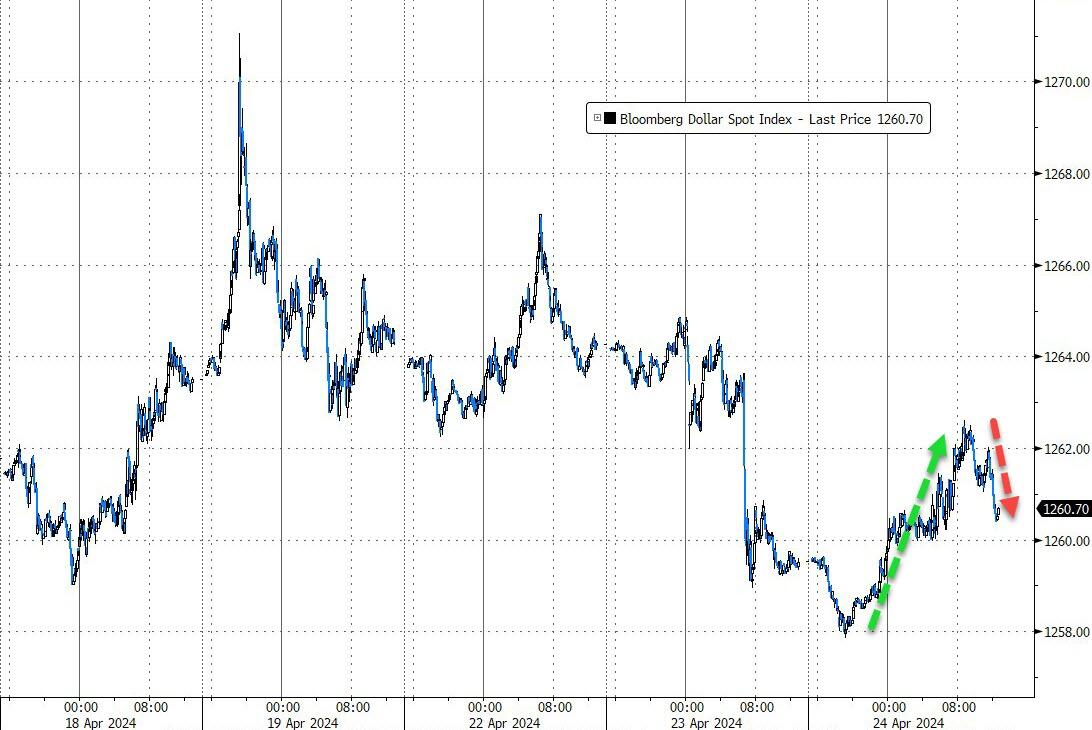
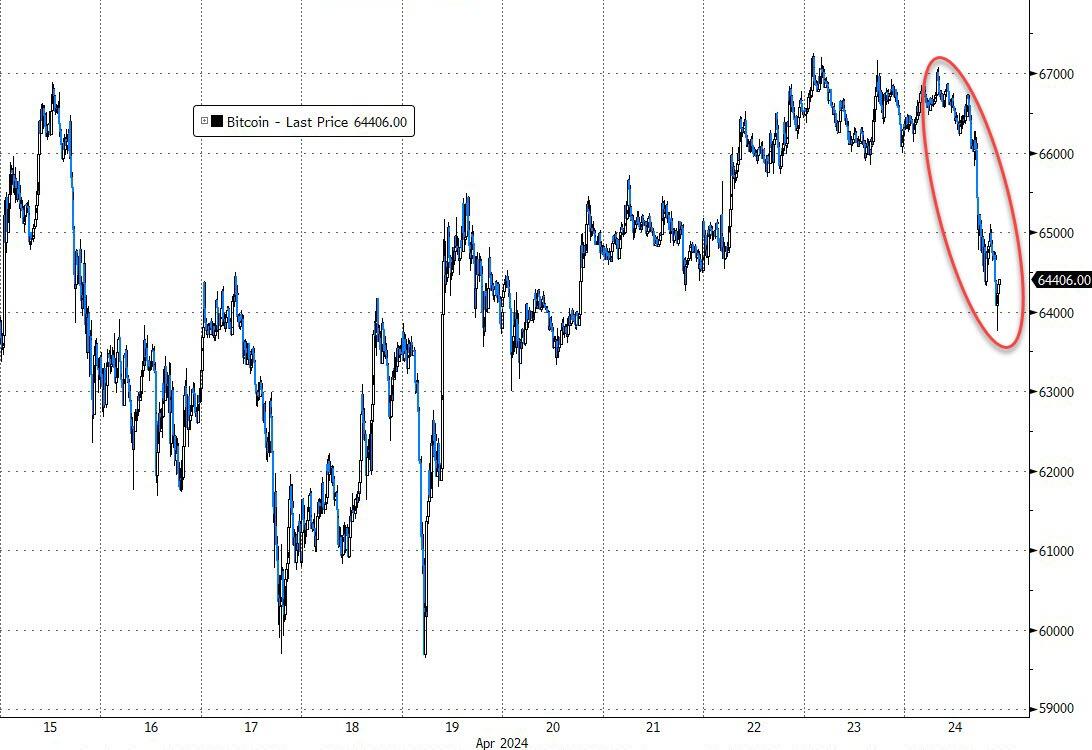
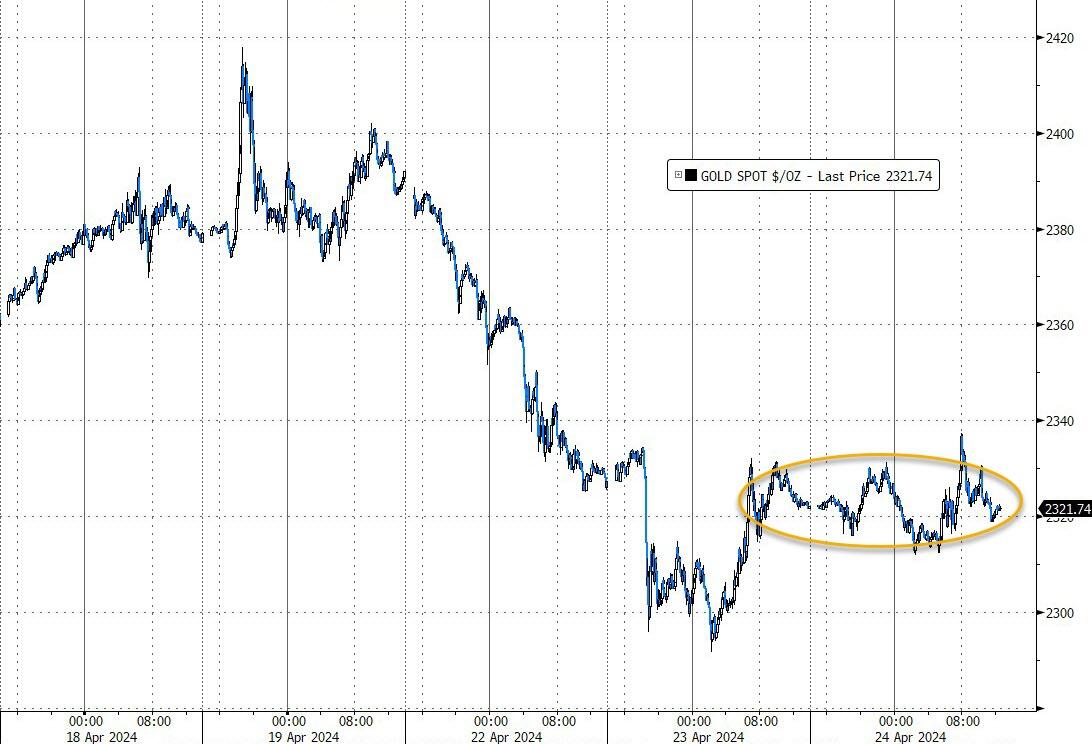
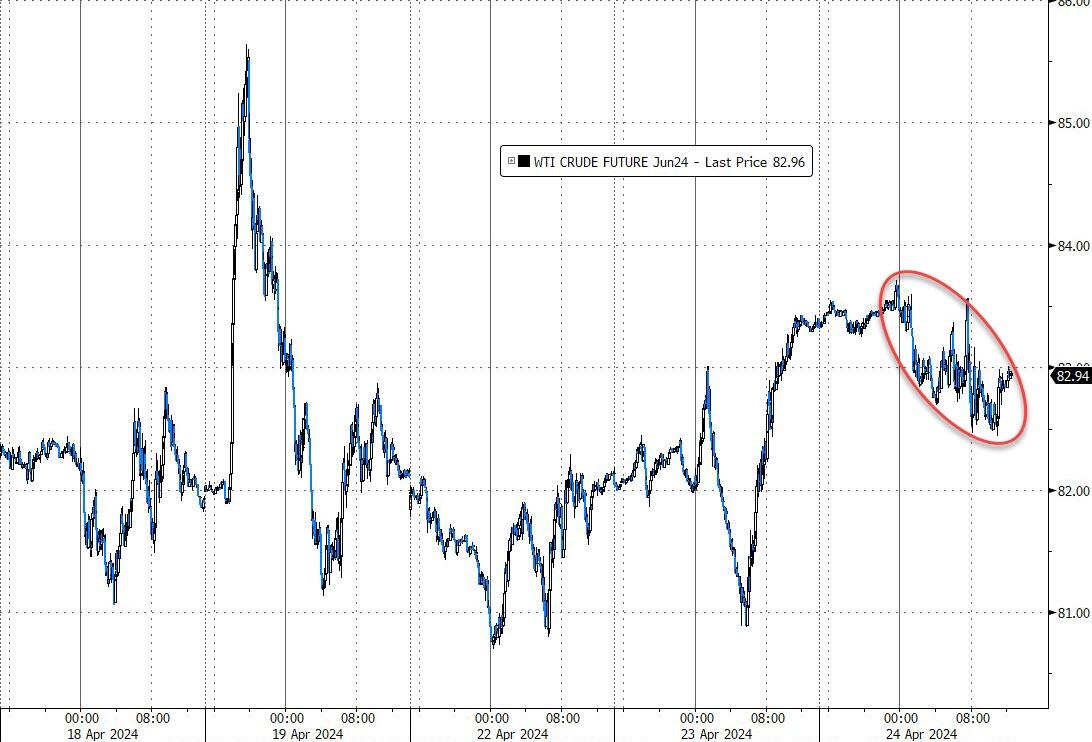
Bond yields experienced a knee-jerk reaction, remaining below Friday’s close. The dollar initially bounced but ultimately retreated during the session. Gold maintained a quiet stance, treading water. Crude oil not only lost momentum but also dipped below the $83 mark. Bitcoin drifted lower but found support around $62,000.
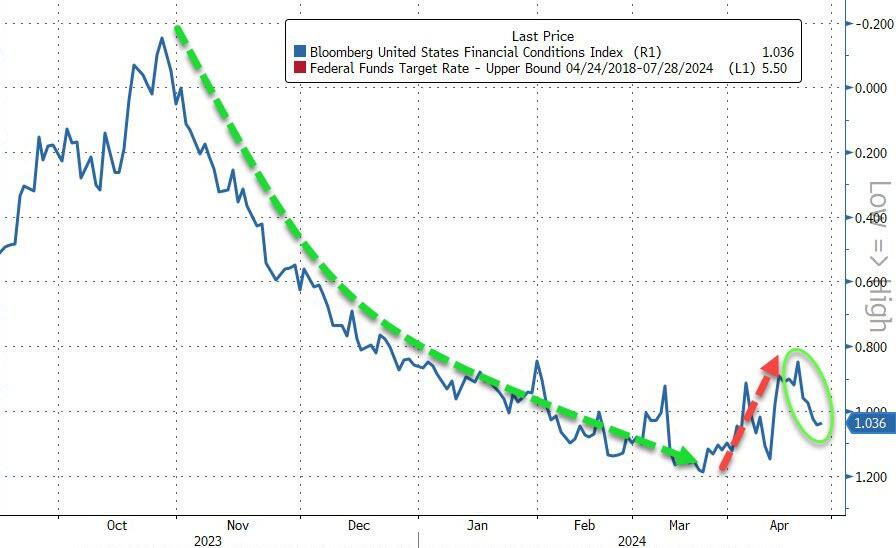
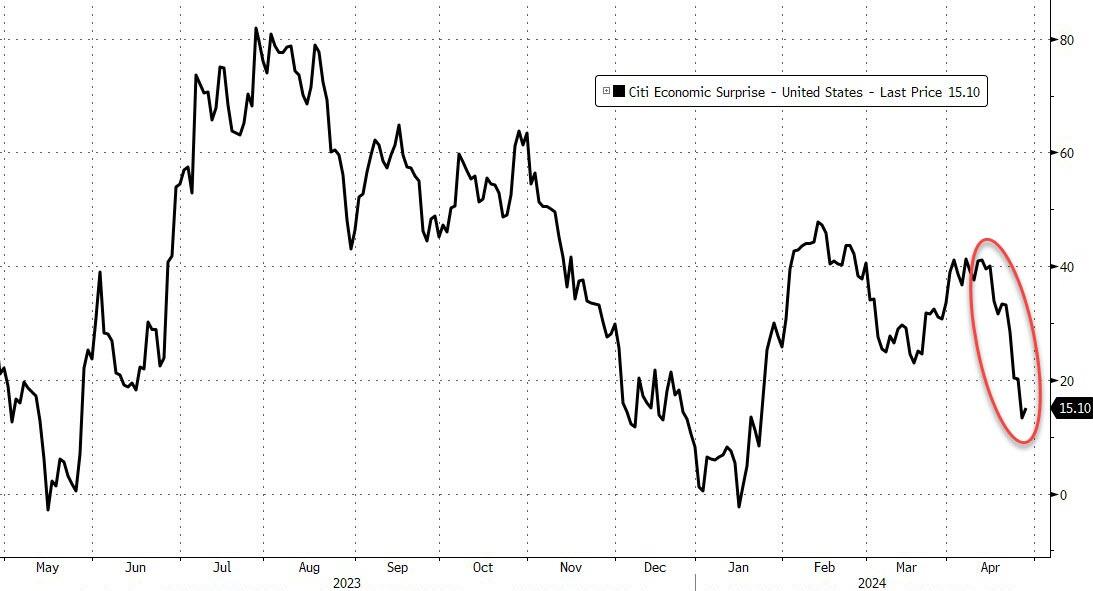
As financial conditions ease once again, I wonder:
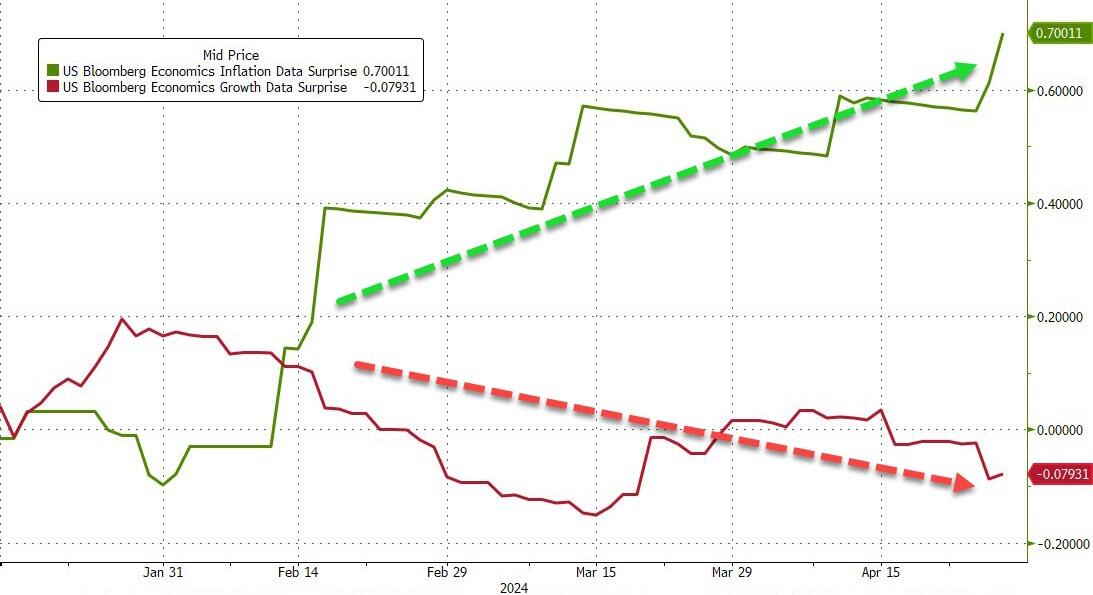
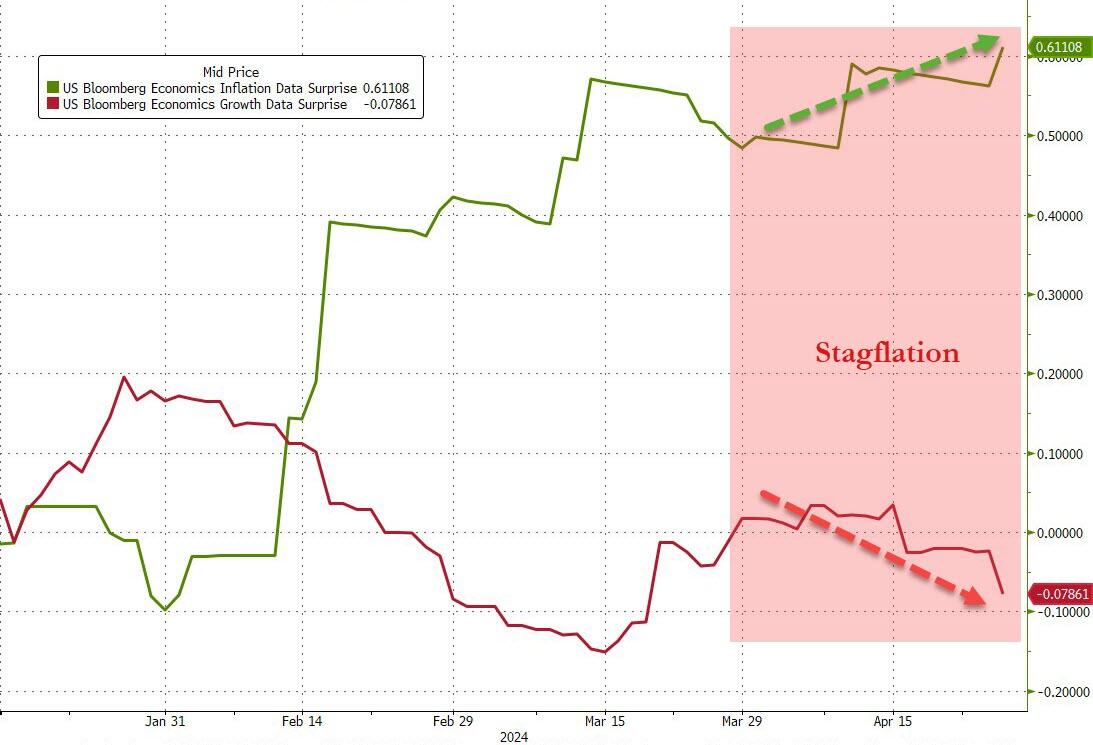
Will the Fed introduce any surprises on Wednesday? Inflation remains a persistent concern, and the central bank’s stance could sway market sentiment.
Read More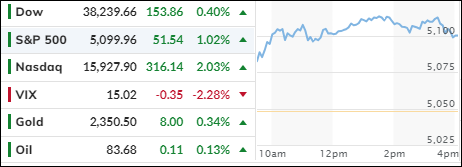
