Do you want to know which ETFs are hot and which ones are not? Then you need my High-Volume ETF Cutline report. It tells you how close or far each of the 311 ETFs I follow is from its long-term trend line (39-week SMA). These are the ETFs that trade more than $5 million a day, so they are not some obscure funds that nobody cares about.
The report is split into two parts: The winners that are above their trend line (%M/A), and the losers that are below it. The yellow line is the line of shame that separates them. You can see how many ETFs are in each group and how they have changed since the last report (265 vs. 278 current).
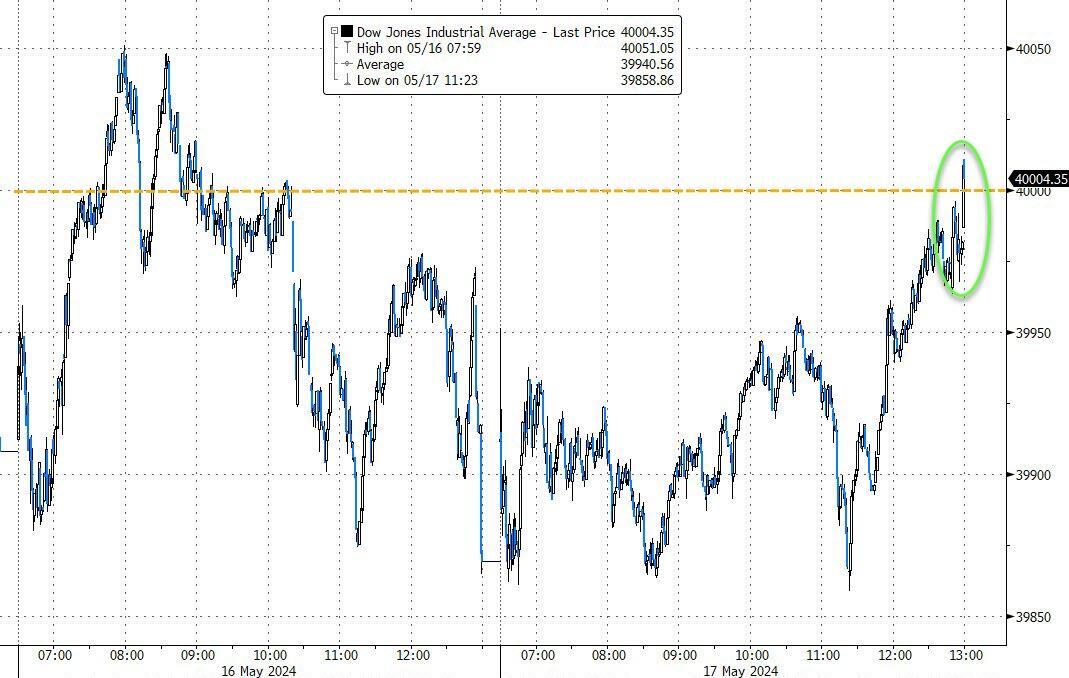
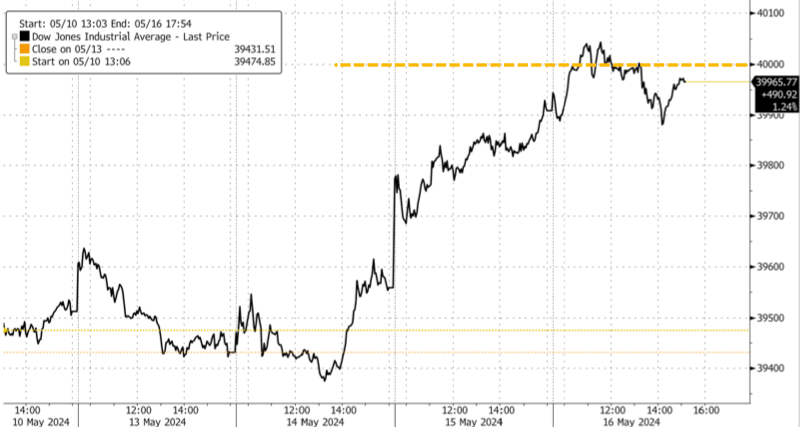
The Dow meandered near the flat line today, after the index briefly topped the key 40,000 level for the first time in the previous session. A last hour drive by the algos pushed 2 of the 3 majors back into the green to end Thursday’s run on a positive note, with the Dow closing above 40k for the first time.
This week’s rally has helped thrust the three indexes into positive territory for the second quarter despite a sluggish start. The S&P 500 and Nasdaq are now each up more than 11% in 2024, while the Dow has climbed more than 5% on the year. Yet, gold remains the top performer with a gain of almost 17%.
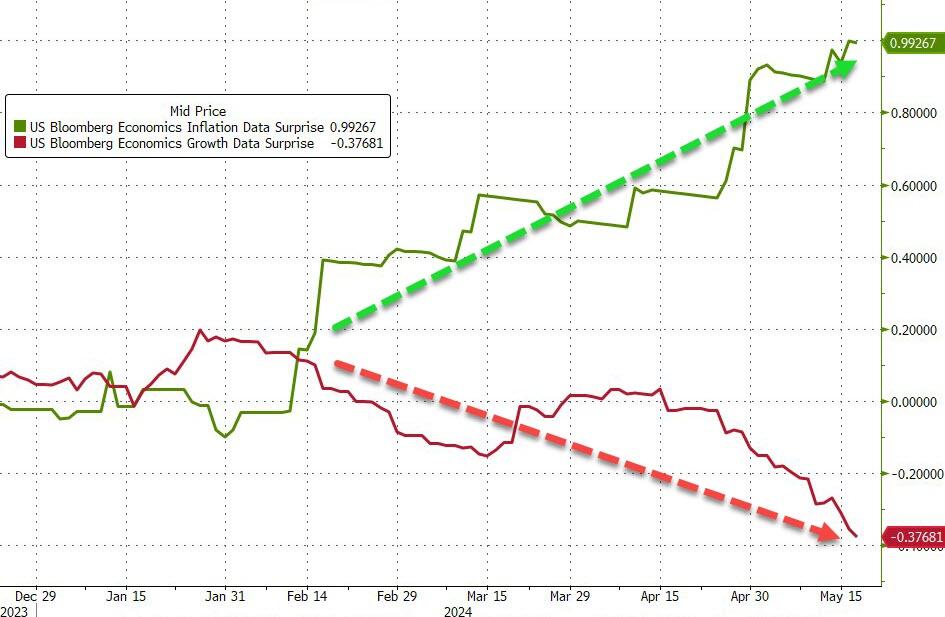
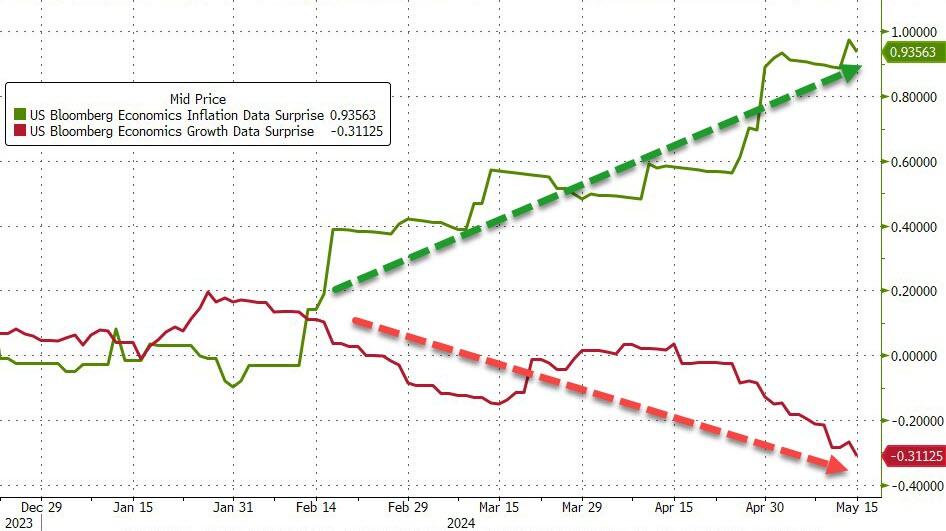
Traders still insist that positive economic growth and weakening inflation will continue to be the driver for higher prices, but reality is that we have moved into a stagflation environment, with accelerating inflation and slower growth now being the dominant forces.
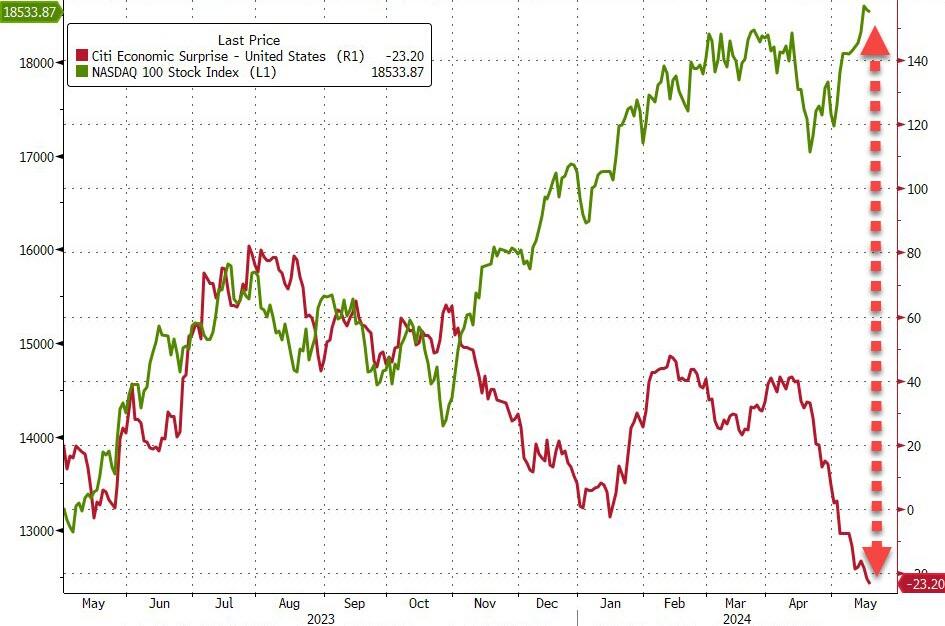
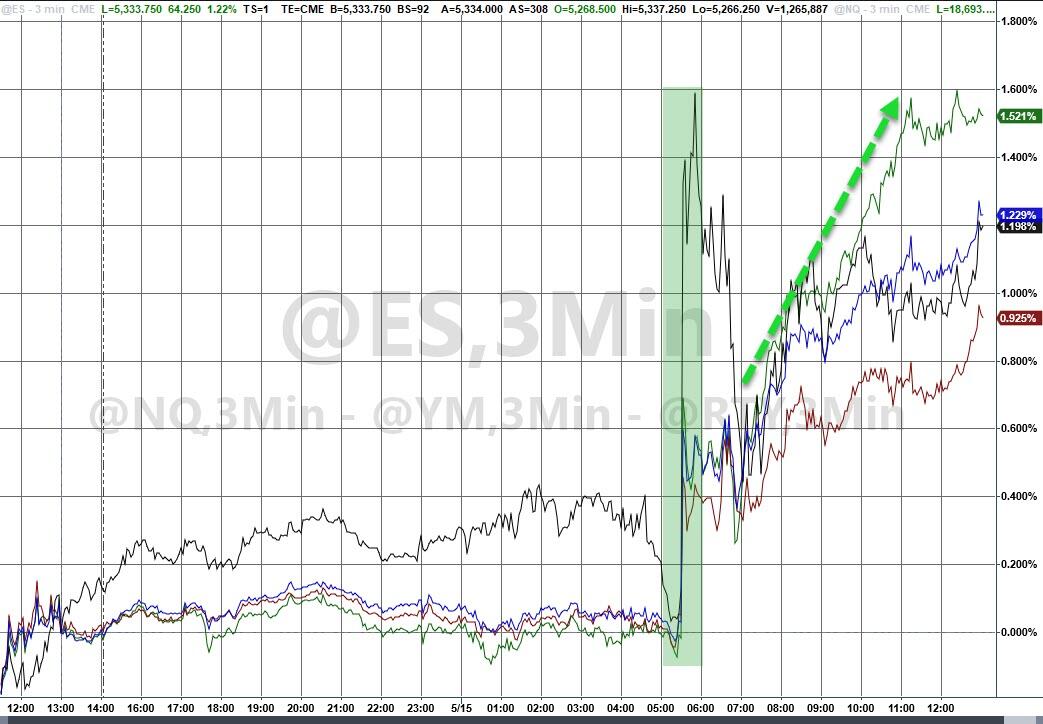
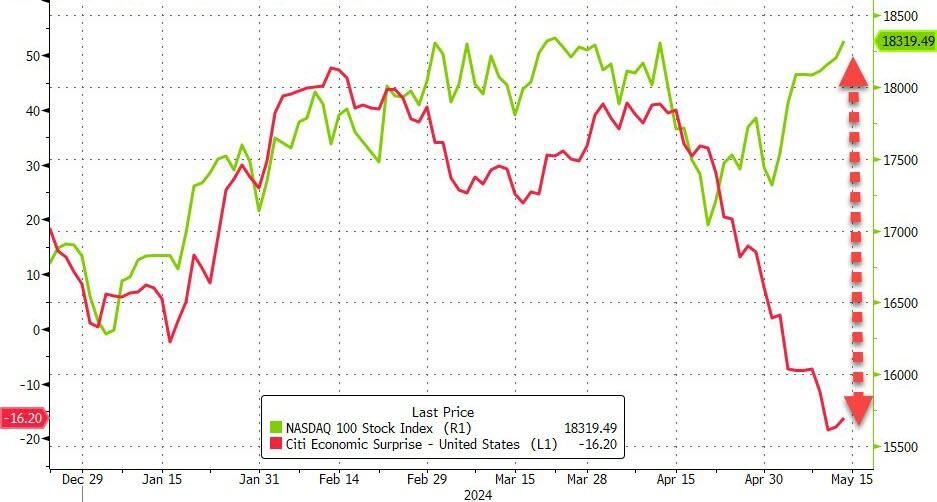
The US Macro Surprise index declined for the sixth straight week to its weakest since January 2023, as Zero Hedge pointed out. While that is bad news, Wall Street considers it good news, as risky stocks have risen in the face of a slowing economic environment, with the spread increasing almost daily. Go figure…
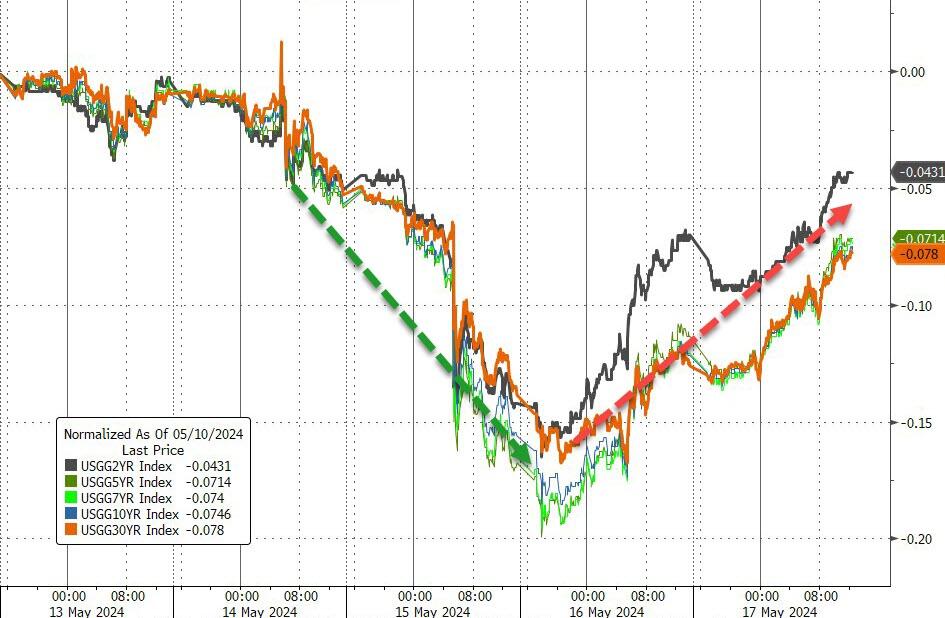
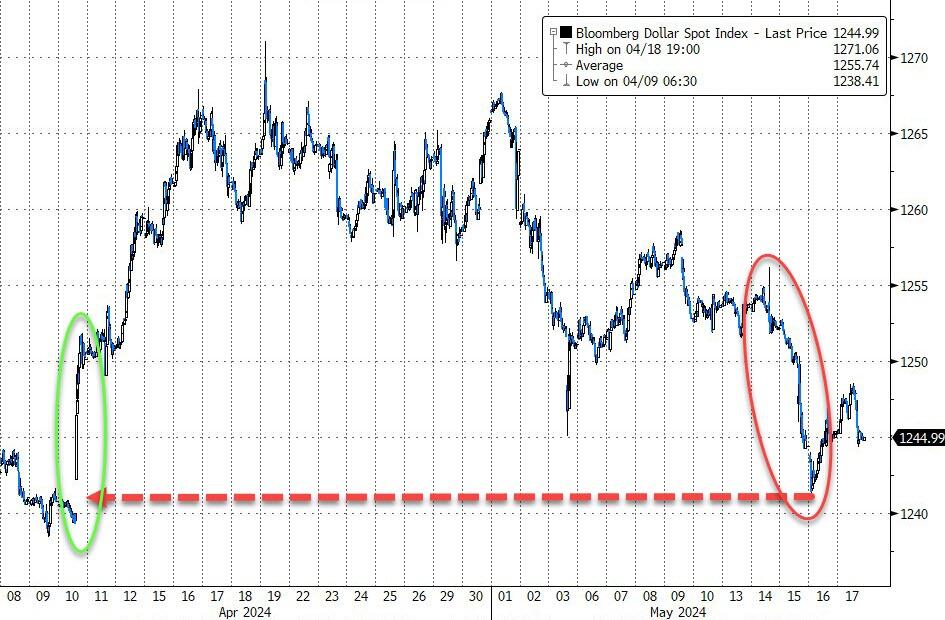
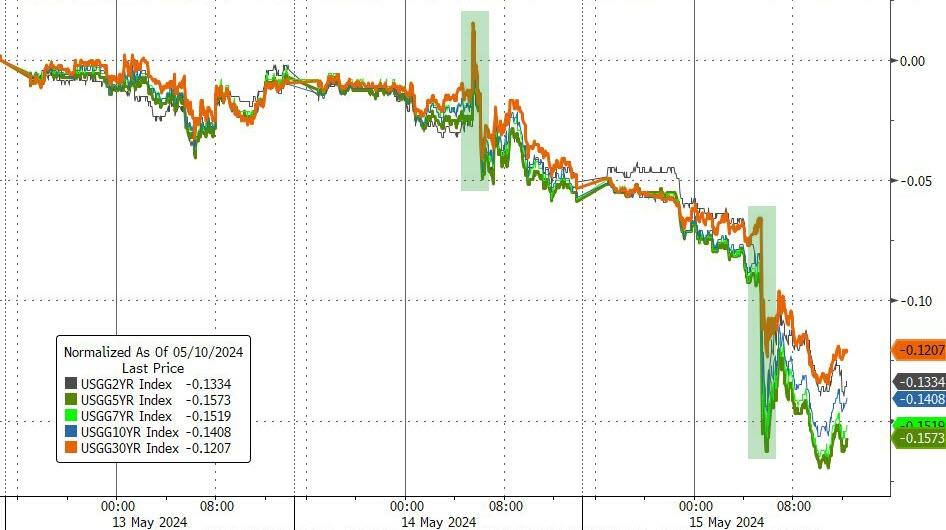
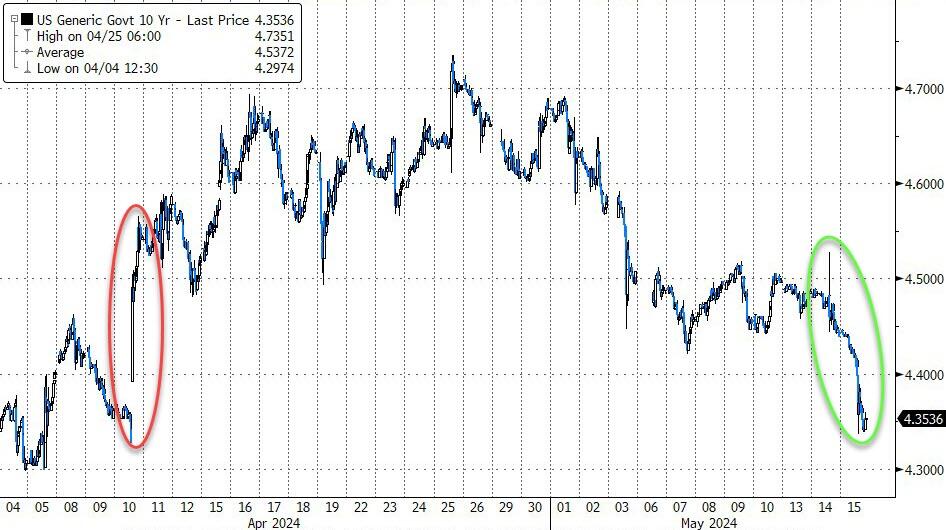
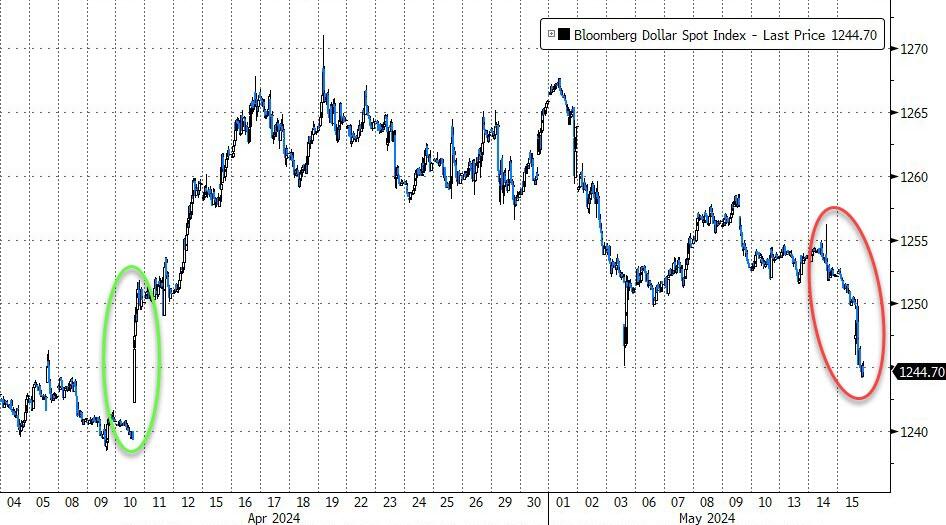
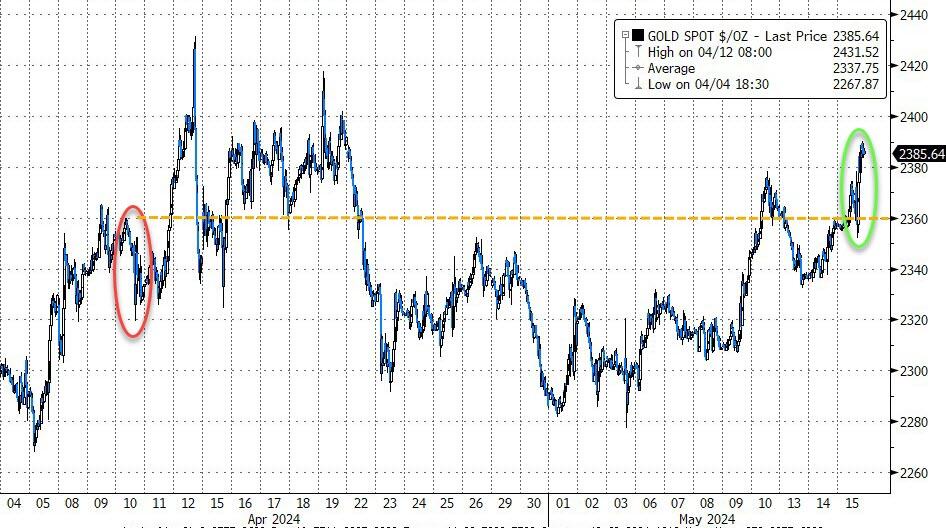
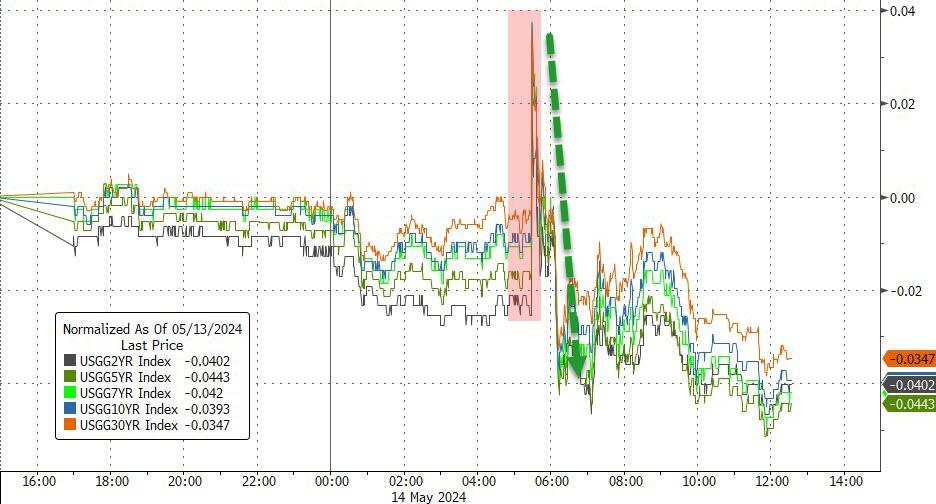
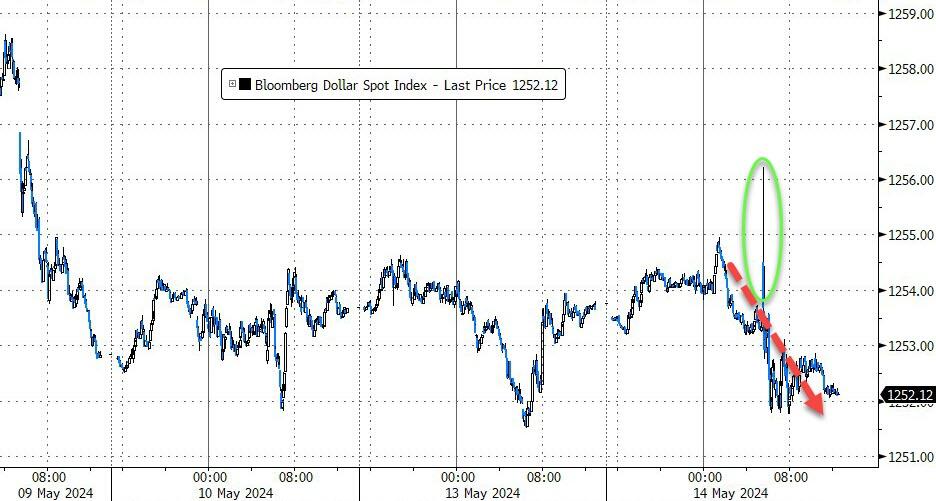
Monday’s short squeeze faded as the week went on, Bond yields slipped despite increasing rates over the past couple of days, and the dollar lost momentum. Gold surged to a new record closing high.
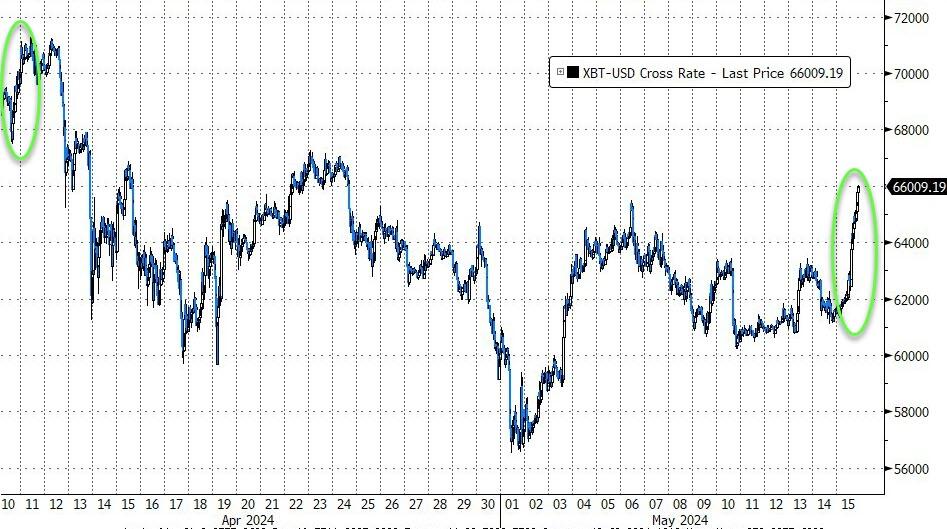
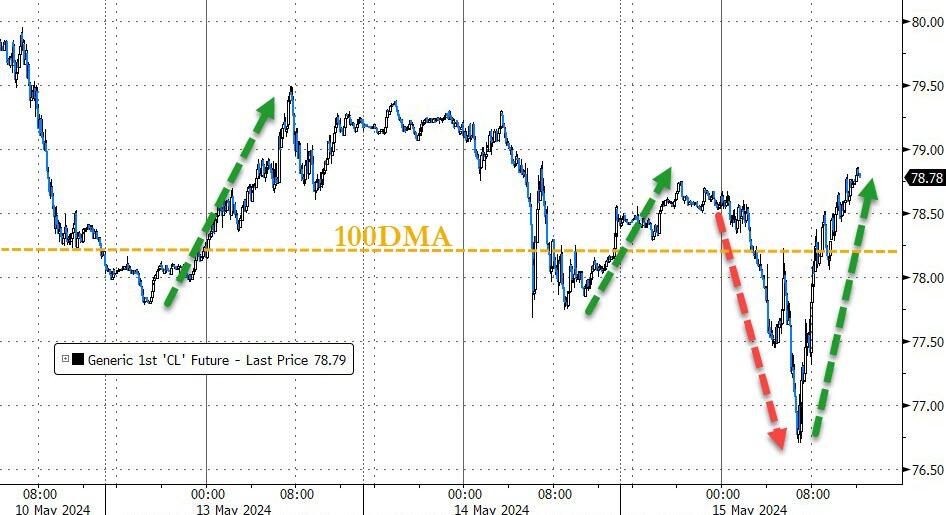
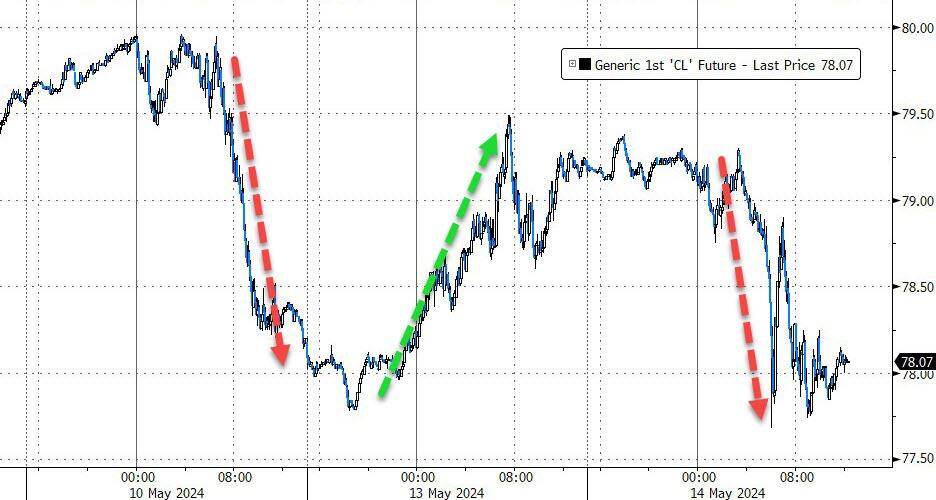
Bitcoin had a big week and raced back above its $67k level, and even oil prices jumped and nibbled at the $80 resistance level. Silver dramatically outperformed gold, as it topped its $30 price for the first time in many years.
And again, as traders are hanging on to the dream of lower rates, this chart makes it very clear that inflation remains a serious threat, and if it is to be conquered, interest rates need to move higher and not lower.
I think the Fed now realizes what it means to be caught between a rock and a hard place.
Out of the 1,800+ ETFs out there, I only pick the ones that trade over $5 million per day (HV ETFs), so you don’t get stuck with a lemon that nobody wants to buy or sell.
Trend Tracking Indexes (TTIs)
These are the main indicators that tell you when to buy or sell Domestic and International ETFs (section 1 and 2). They do that by comparing their position to their long-term M/A (Moving Average). If they cross above, and stay there, it’s a green light to buy. If they fall below, and keep going, it’s a red light to sell. And to make sure you don’t lose your shirt if things go south, I also use a 12% trailing stop loss on all positions in these categories.
All other investment areas don’t have a TTI and should be traded based on the position of each ETF relative to its own trend line (%M/A). That’s why I call them “Selective Buy.” In other words, if an ETF goes above its own trend line, you can buy it. But don’t forget to use a trailing sell stop of 12%, or less if you’re feeling nervous.
If some of these words sound like Greek to you, please check out the Glossary of Terms and new subscriber information in section 9.
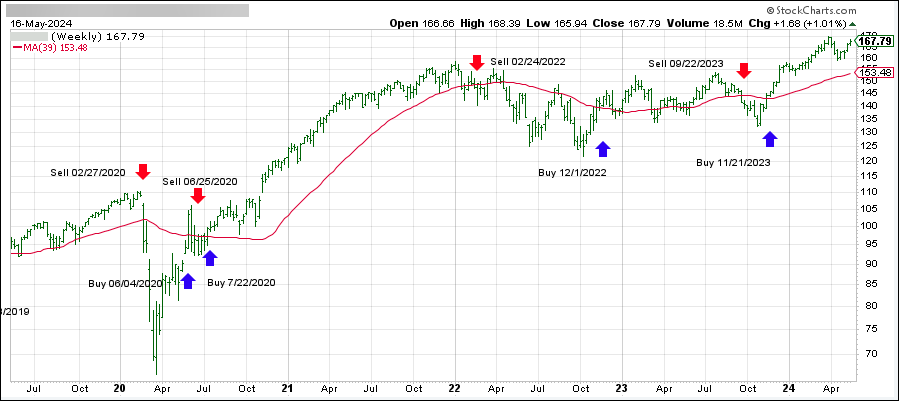
DOMESTIC EQUITY ETFs: BUY— since 11/21/2023
Click on chart to enlarge
This is our main compass, the Domestic Trend Tracking Index (TTI-green line in the above chart). It has broken above its long-term trend line (red) by +9.73% and is in “Buy” mode as posted.
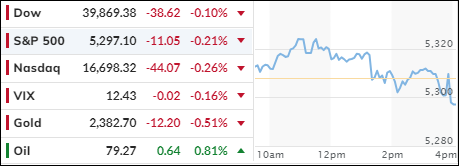
The major indexes inched higher early in, with the Dow conquering the milestone level of 40,000, a once thought to be an impenetrable level. In the end, momentum waned, and the majors closed off the highs.
The Dow’s progression toward 40,000 comes as unyielding belief of interest rate cuts and enthusiasm around artificial intelligence boosted investor sentiment, a trend that has been in motion for the past year.
Yesterday, the April reading of the CPI, a broad measure of how much goods and services cost at the cash register, increased 0.3% from the prior month, which was below the estimation of 0.4%.
As a result, the major indexes went on a rip, with the S&P 500 closing above 5,300 for the first time, a level which the index surrendered today.
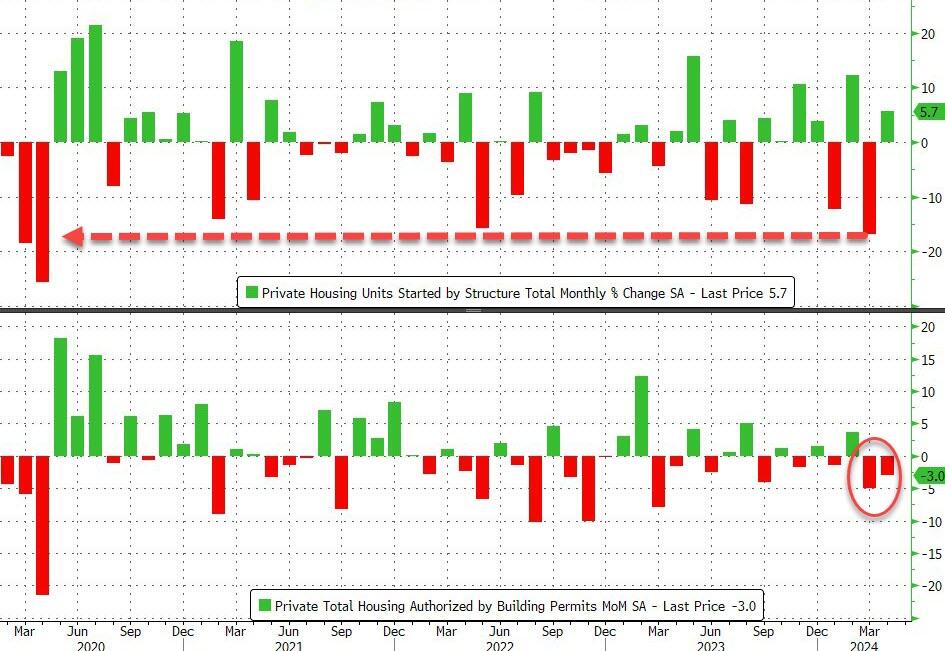
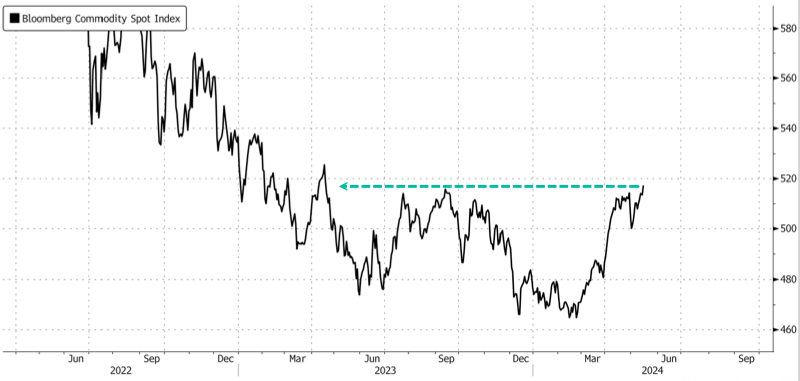
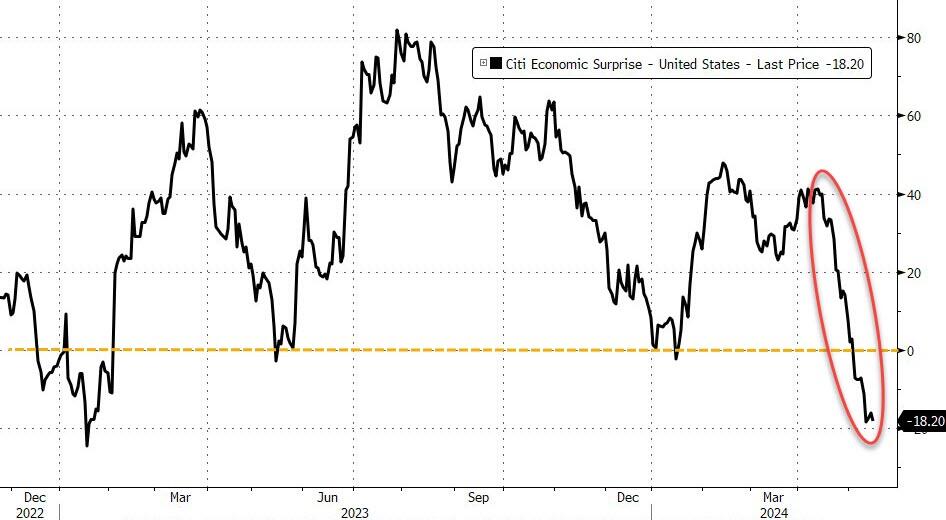
Economic news painted a bleak picture with Industrial Production disappointing, US housing starts/permits coming in below expectations, and the Commodity index hitting its highest in a year, a clear sign that inflation is still out of control. All of this has pulled the Citi ECO Surprise index down to its lowest level since September 2022.
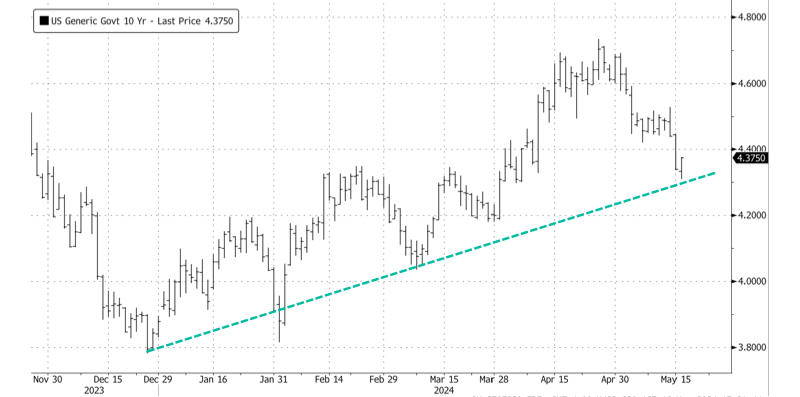
Bond yields rose, with the 10-year bouncing off its trendline. The dollar rebounded a tad, gold pulled back after yesterday’s strong surge, and crude oil rose but fell short of reaching its $80 level.
The economy continues to weaken, while inflation remains ever present, a set up that the Fed will have a hard time dealing with.
After all, if they raise rates, the economy will collapse, if they lower them, inflation will surge.
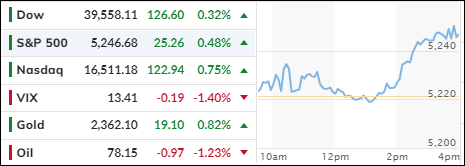
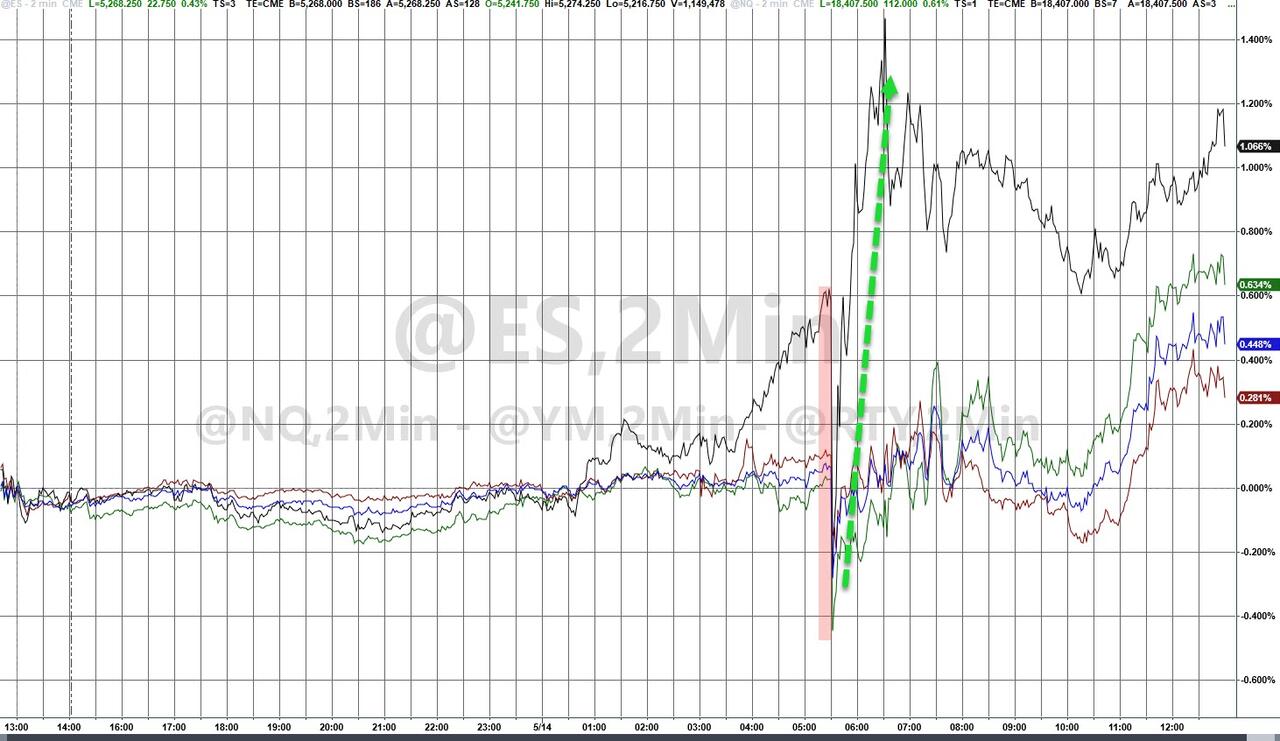
The much-awaited CPI report pushed the S&P 500 and Nasdaq to record highs, as this crucial number turned out to be better than expected.
The index rose 0.3% for the month of April, which was less than the estimate for a 0.4% monthly increase. The indicator changed by +3.4% year over year, in line with expectations. Monthly and yearly numbers for the core CPI, which excludes volatile food and energy prices, were both in line as well.
The only fly in the ointment was Retail sales, which remained flat in April. Economists had expected a 0.4% leap, but then again “bad news” is “good news” when it comes to potential rate cuts. The Citi Economic Surprise Index reflects the weaking economy, as the stagflationary threat continues to worsen.
Traders’ expectations for a softening of the Fed’s stance on rate cuts were boosted, as its likelihood of an easing at the September meeting increased to almost 58%. While that is a substantial jump from yesterday’s 45%, we’ve seen this type of relentless hope turn into disappointment before.
Still, the continuing outlook for lower rates coupled with enthusiasm around AI has lifted traders’ sentiment all year. The S&P is currently up some 11% YTD, but gold still rules the race by being ahead with a gain of over 15%.
Bond yields slipped, with the 10-year dropping down to towards April lows. The dollar dipped, while oil rode the roller coaster but managed to close in the green. Gold surged towards its record closing high of $2,392 and reached the same level it had before April’s CPI report.
Bitcoin soared some 7% by conquering its $66k level, with the coin having its best day since March 2023. Crude oil recovered from an early drop and eked out a 1% gain.
I don’t think today’s party is justified due to today’s CPI report only playing a small part in the battle to conquer inflation. After all, as long as this country has to borrow $1 trillion every 100 days, the real inflation monster has not been unleashed yet.
Today’s stock market narrative unfolded with a twist, as traders grappled with the implications of April’s Producer Price Index (PPI) report. The PPI, a barometer of inflation at the wholesale level, rose unexpectedly, signaling that inflationary pressures might not be subsiding as hoped.
This revelation initially sent a shiver through the markets, but the initial shock was mitigated by downward revisions to March’s wholesale prices, which suggested that inflation might still be on a downward trajectory.
Despite the mixed signals, the markets rallied, buoyed by the belief that the Federal Reserve might maintain its current policy stance. The Fed, led by Chair Jerome Powell, has indicated a need for patience, suggesting that the path to stabilizing inflation will be a marathon, not a sprint. Powell’s remarks hint at a cautious approach, with the central bank poised to let its restrictive policies gradually temper the inflationary heat.
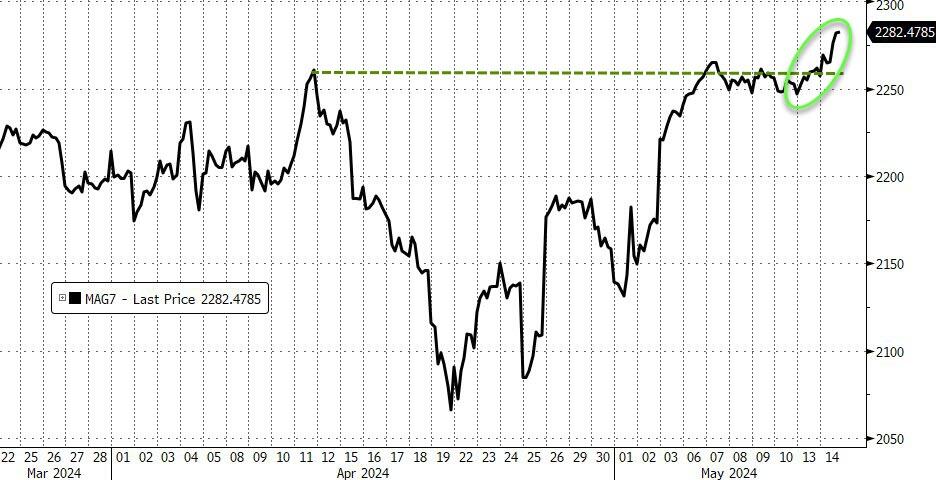
Amidst this backdrop, meme stocks and Small Caps seized the spotlight, while the Nasdaq and the MAG 7 stocks soared to new records. The bond market, however, experienced volatility, with yields reflecting the day’s inflationary concerns and subsequent reassurances. The dollar’s fluctuations and gold’s luster provided a contrasting picture of stability and uncertainty.
Cryptocurrency and crude oil, on the other hand, relinquished their previous gains, painting a picture of the market’s fickleness. The stark contrast between the Nasdaq’s performance and the broader US Macro data raises questions about the sustainability of this divergence.
Considering these developments, one can’t help but ponder the resilience of the current financial conditions. With the Fed Fund rate at its highest in over two decades, and the market seemingly unfazed by potential risks, what could be the catalyst that aligns these divergent paths?
Could there be an unforeseen event on the horizon that will reconcile the optimistic market sentiment with the cautionary economic indicators?


