
- Moving the market
Stocks pushed higher early on, even though trading stayed pretty choppy. The move built on yesterday’s big comeback as oil prices finally cooled off and traders kept a close watch on the escalating conflict with Iran.
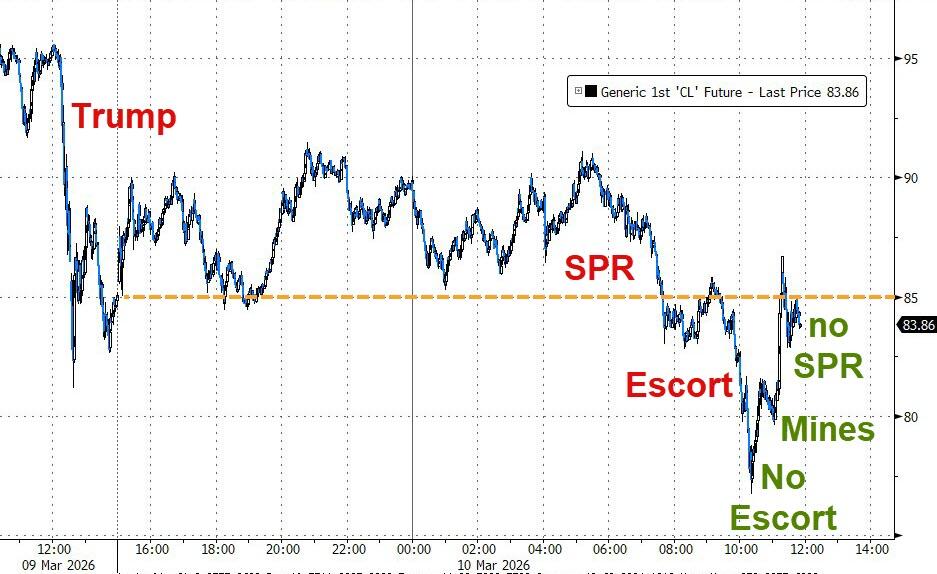
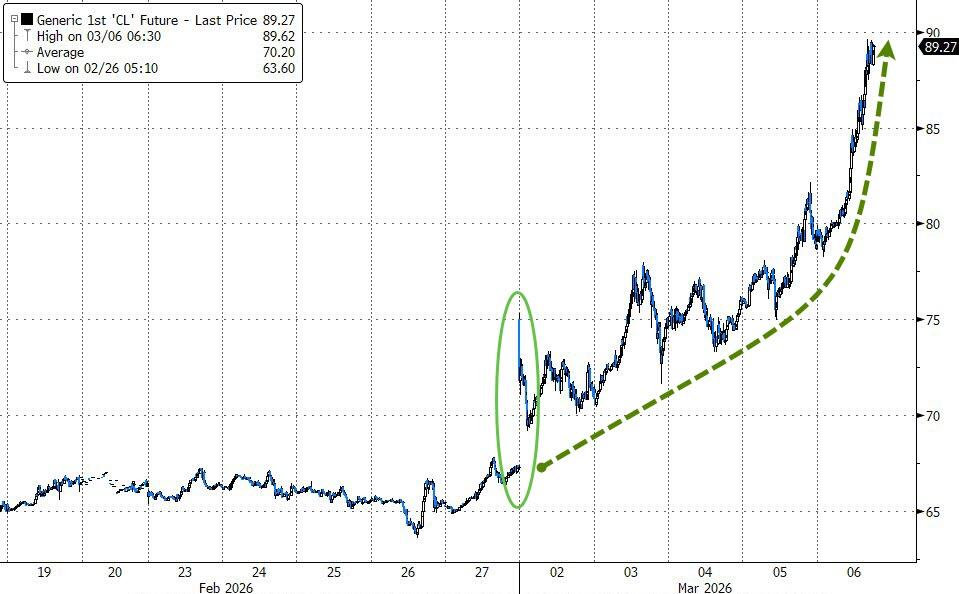
After a strong run, crude took a sharp dive today on expectations that several countries might tap their emergency oil reserves to soften the impact of the conflict. The International Energy Agency said it would meet later Tuesday to assess the situation and decide whether a coordinated release of stockpiles is needed.
This all comes after a wild session Monday, when the Dow clawed its way back from an 800‑point drop as oil retreated. The rebound got extra fuel when President Trump suggested the conflict might wrap up soon, saying the U.S. was making “major strides” toward its military goals.
Still, Defense Secretary Hegseth made it clear the operation wasn’t exactly winding down, calling today the “most intense day of strikes inside Iran” and claiming Iran is “badly losing.”
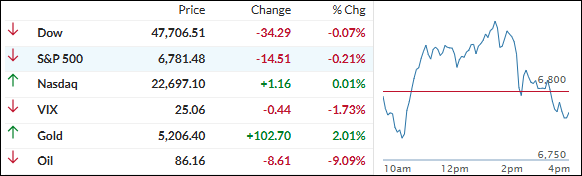
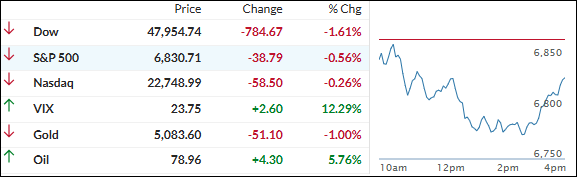
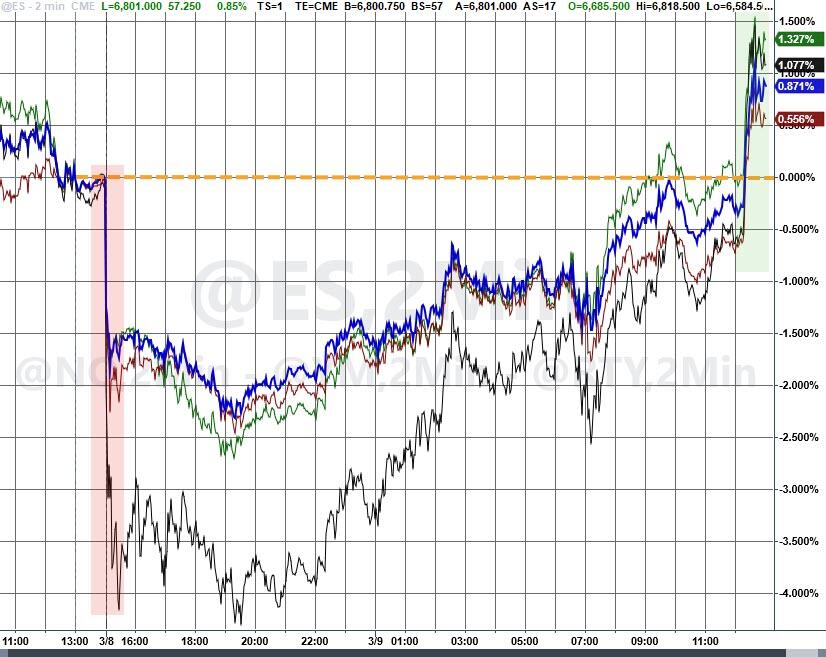
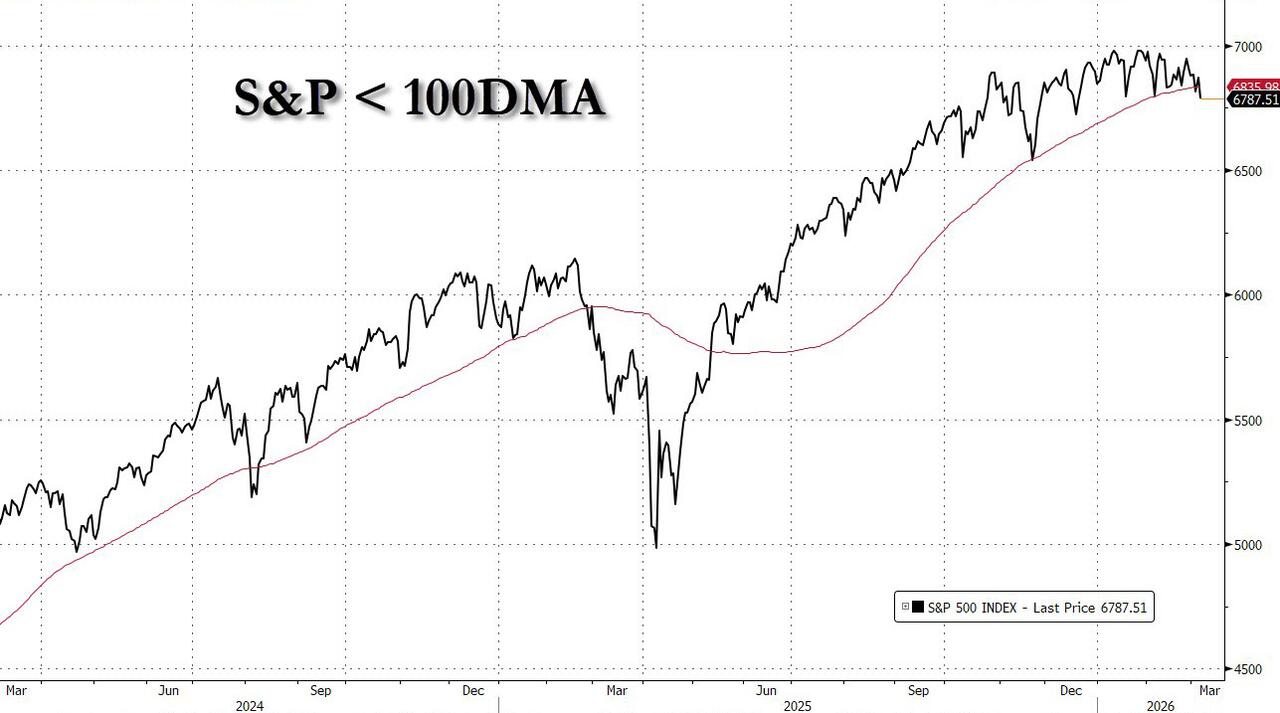
Even with Monday’s comeback, stocks couldn’t hold the momentum. The major indexes finished near flat as crude oil whipped around and kept markets off balance.
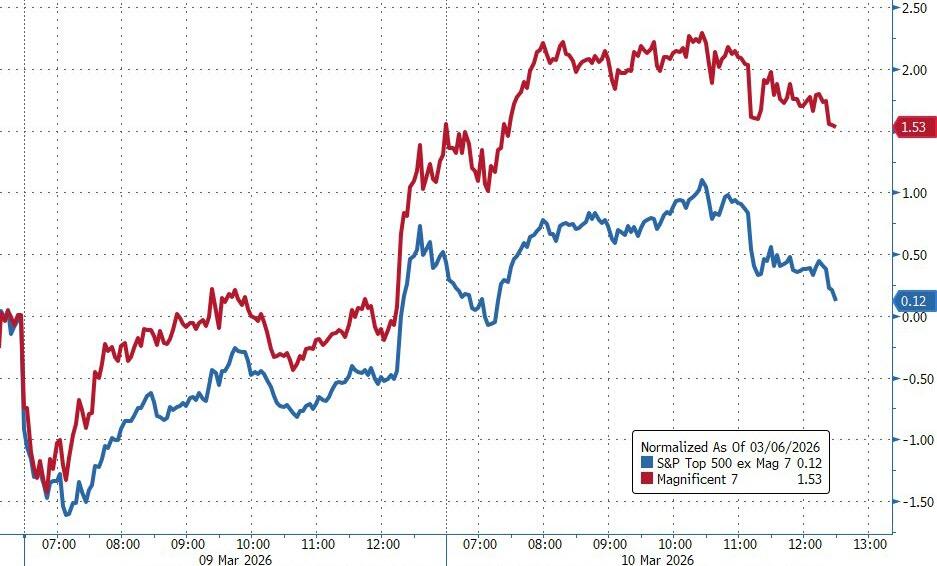
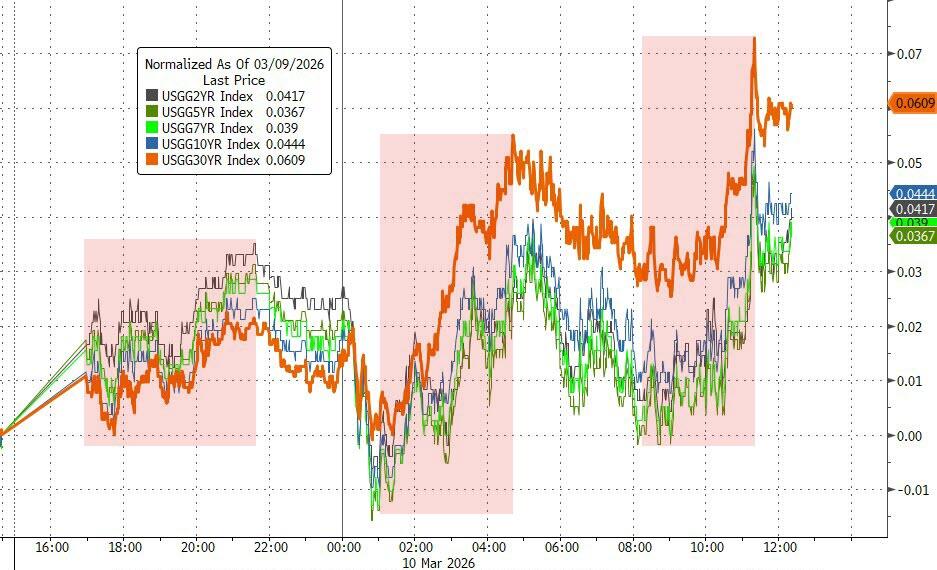
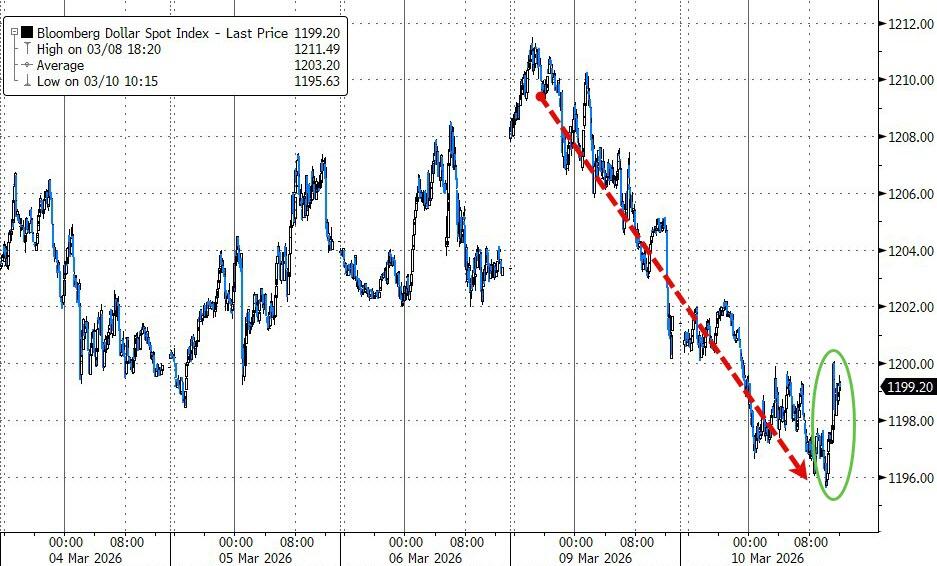
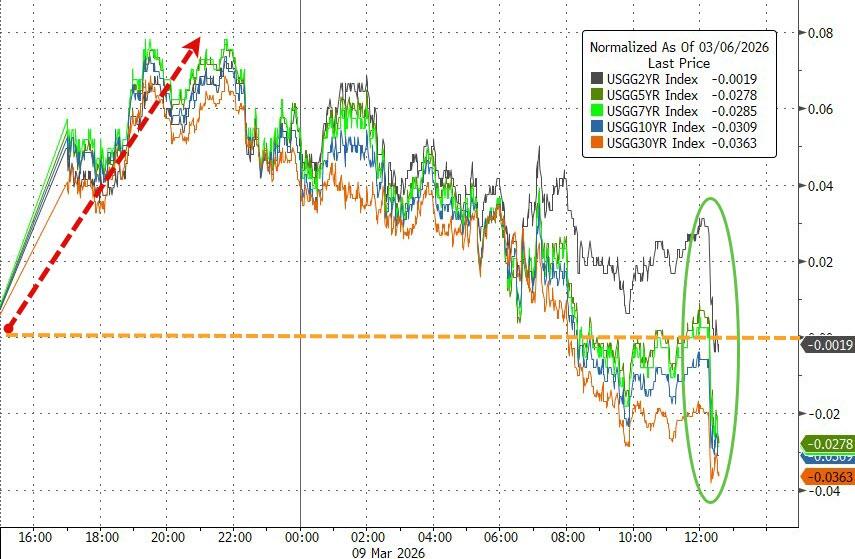
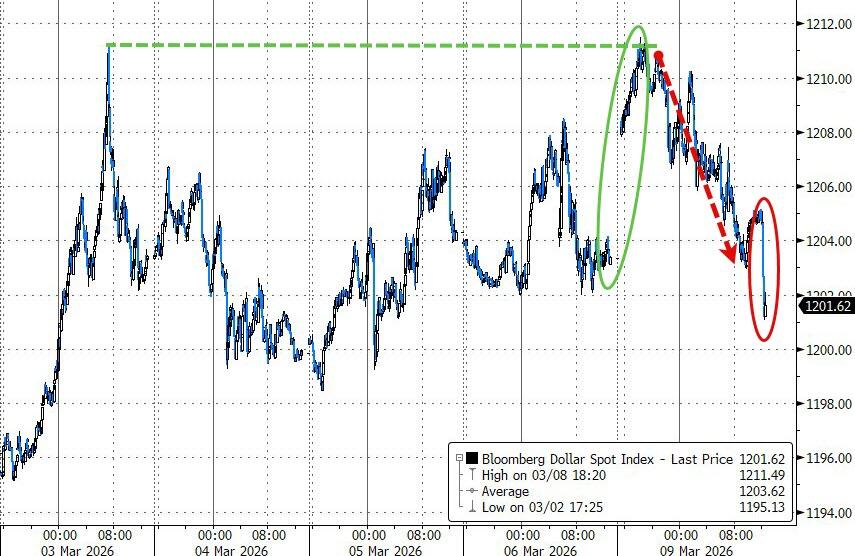
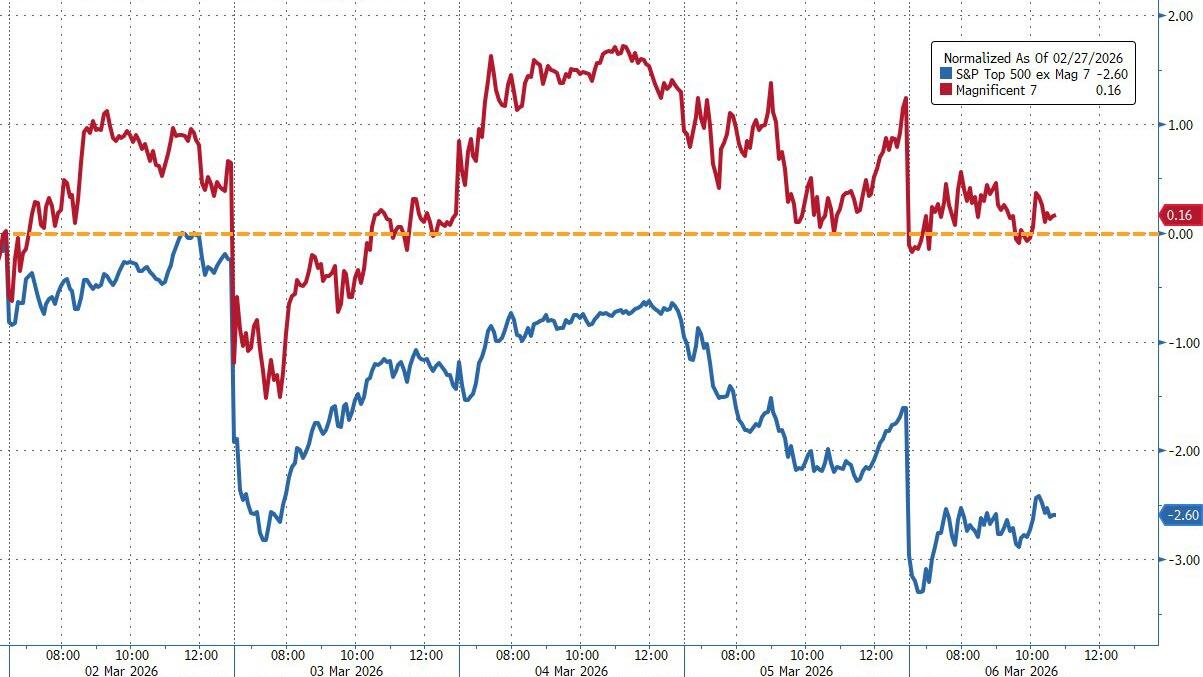
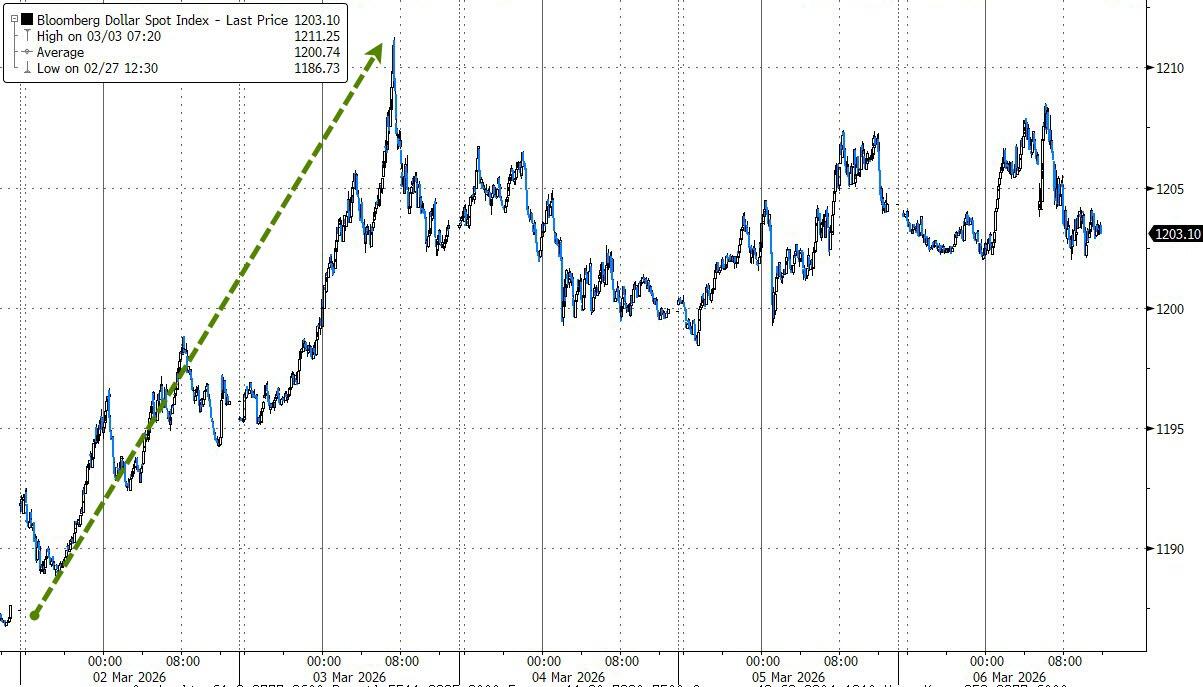
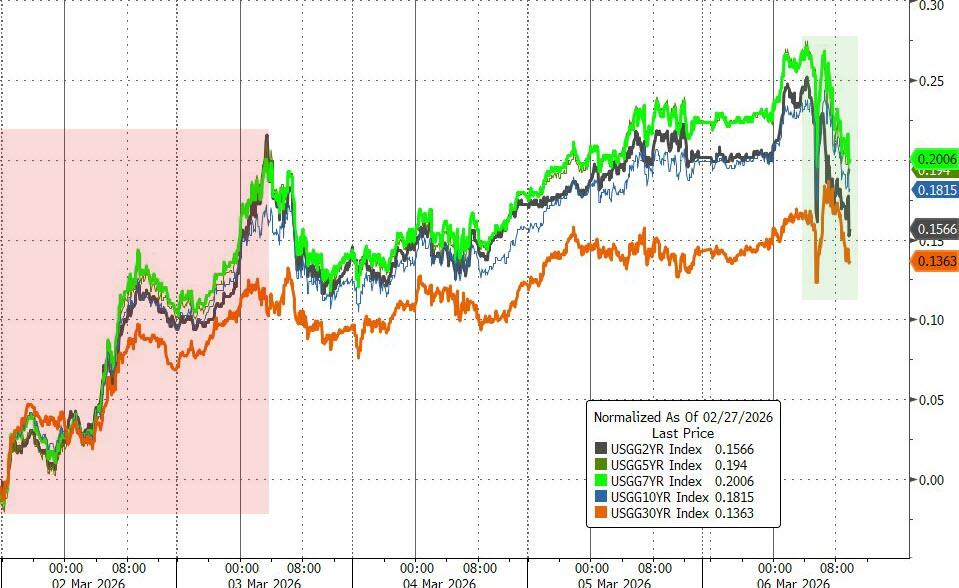
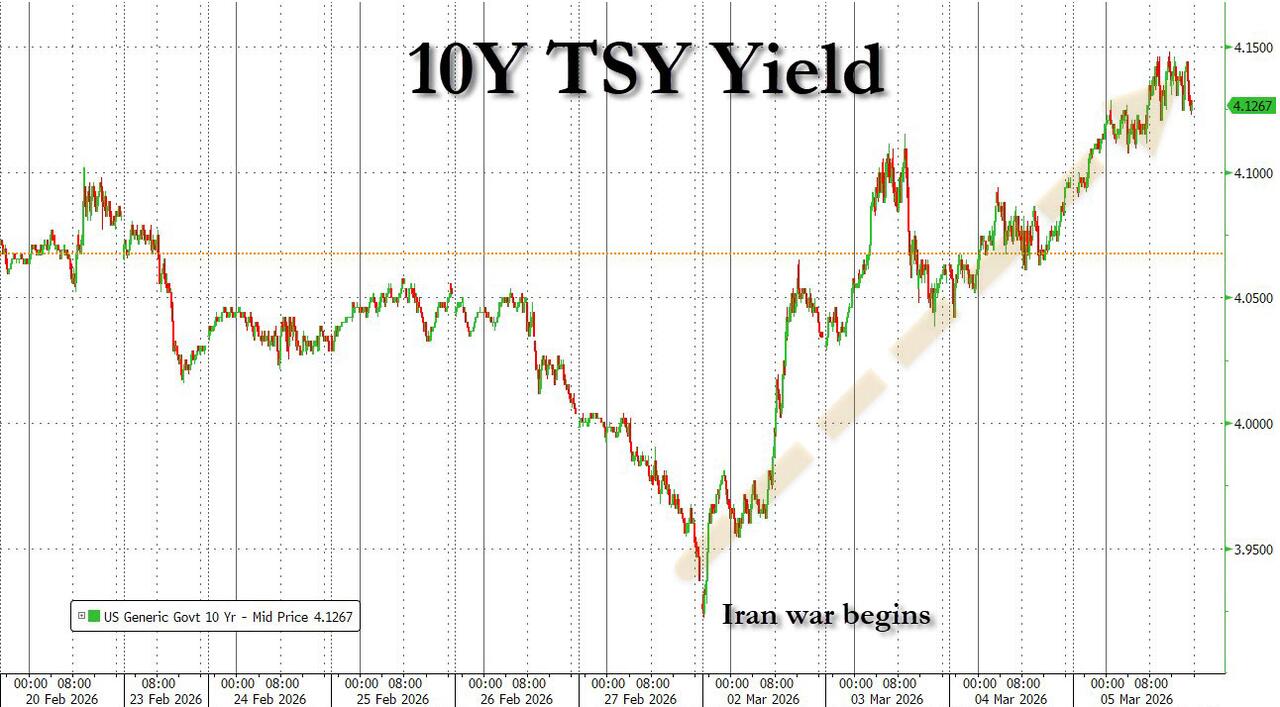
Market breadth wasn’t great, but the Mag 7 once again carried the load, outperforming the broader S&P 493 despite rising bond yields. The dollar dipped before staging a last‑hour comeback.
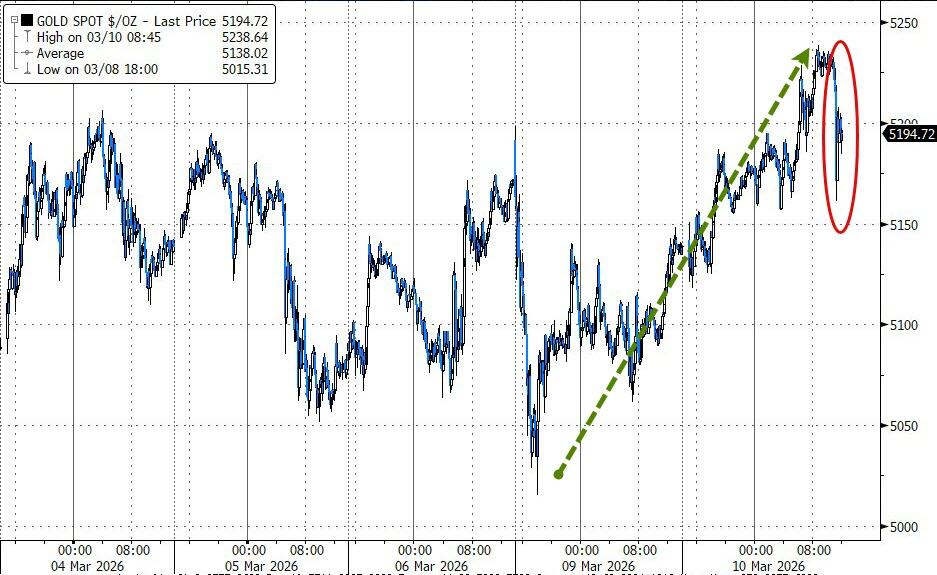
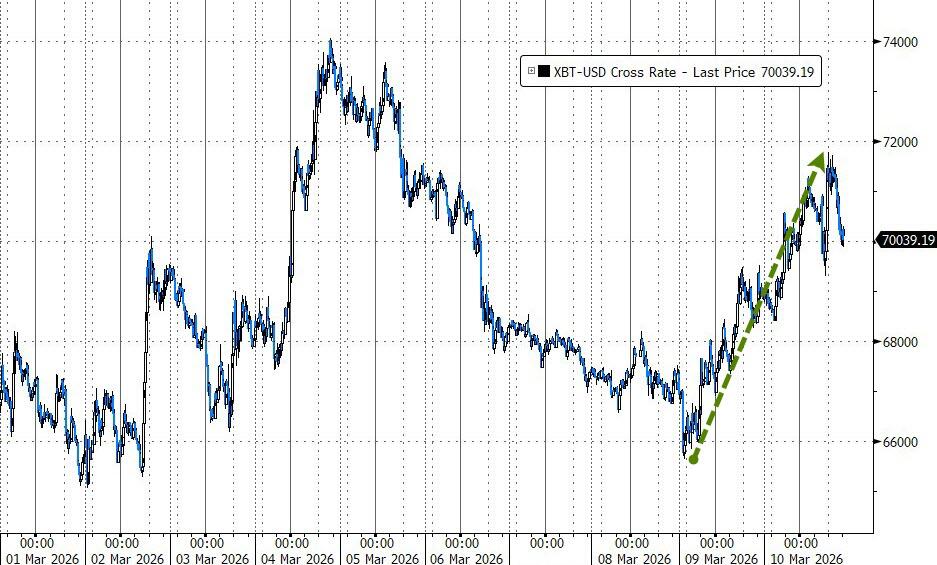
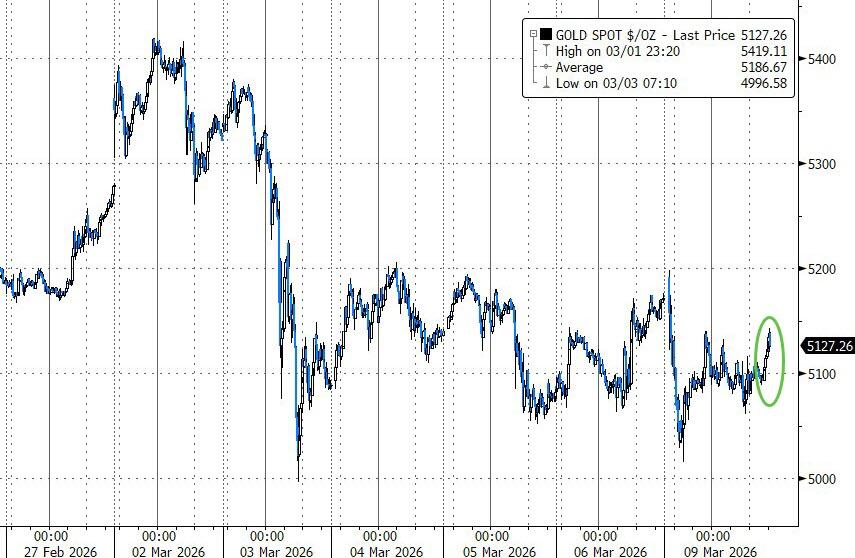
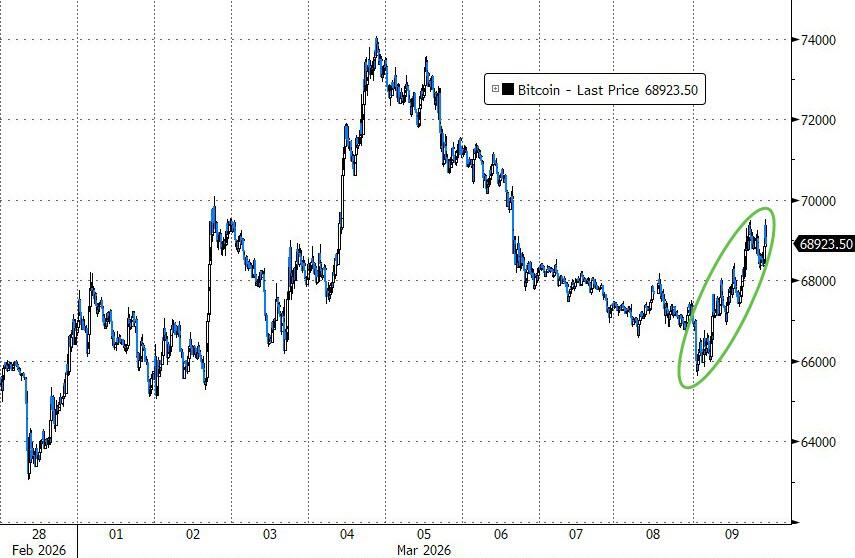
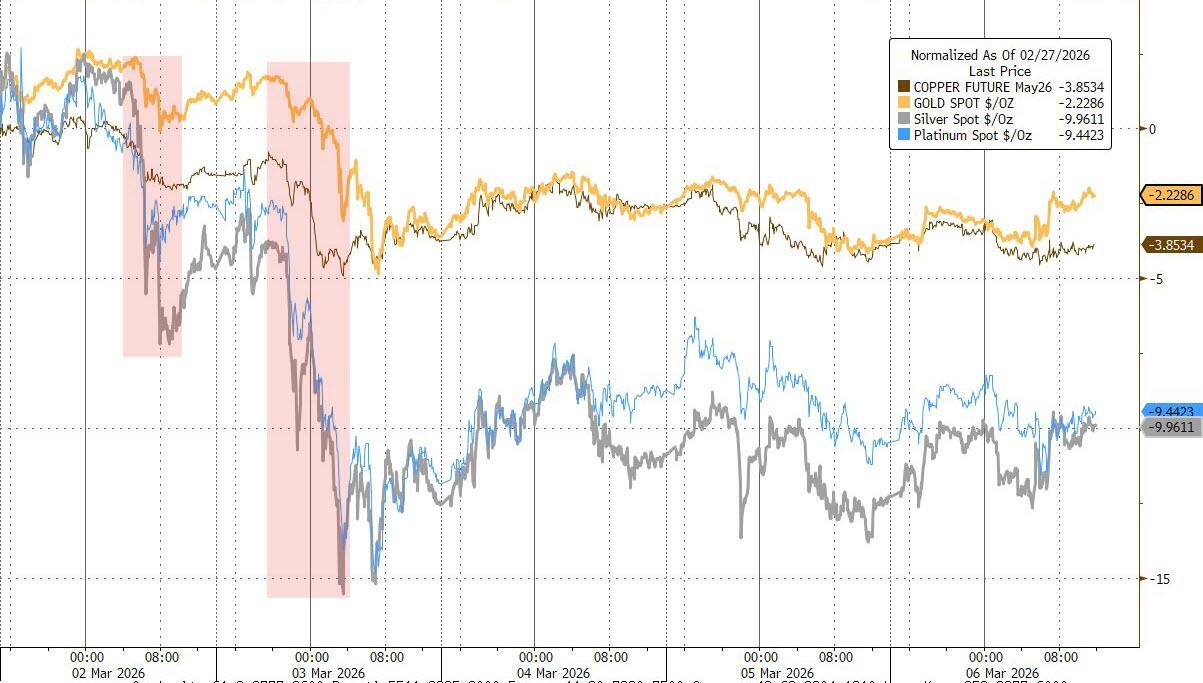
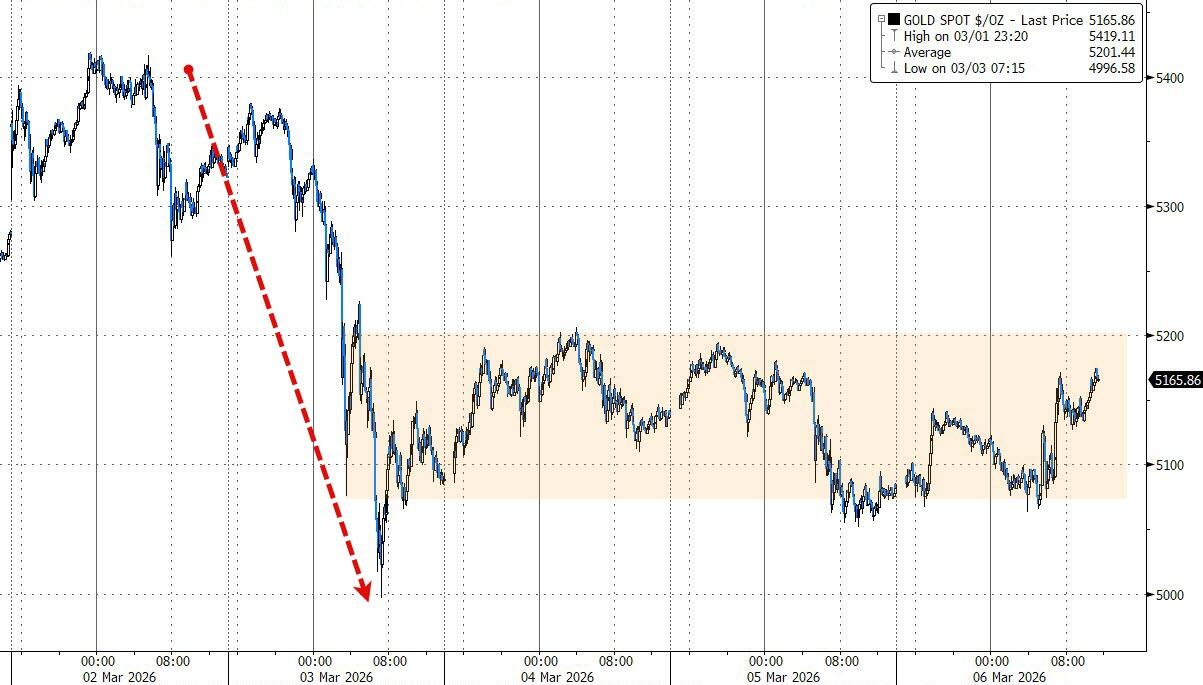
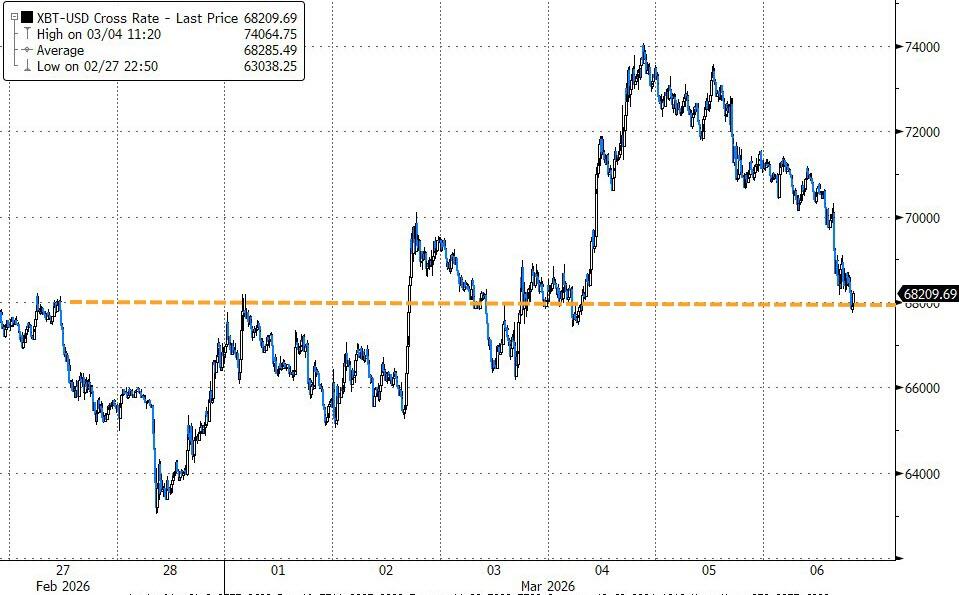
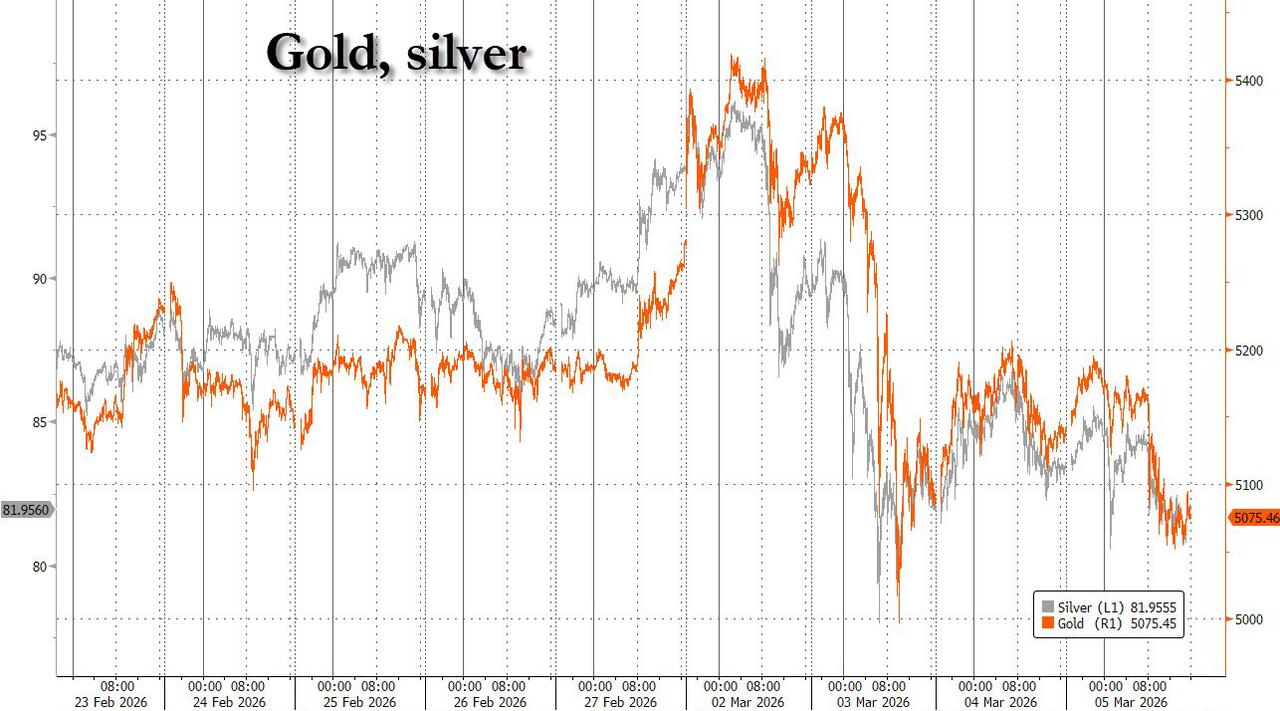
Metals helped brighten the mood—gold flirted with $5,200 before easing a bit, while silver and copper pushed higher. Bitcoin joined the party too, popping up to $72,000 before settling back near $70,000.
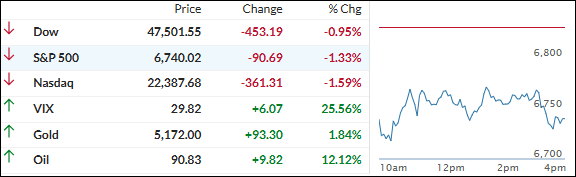
Still, traders remain on edge about a prolonged disruption in oil and gas flows if the Strait of Hormuz stays effectively shut. With around 8 million barrels a day stuck behind that bottleneck… yeah, that’s a big problem.
So, the question is: do markets have enough momentum to shake off the oil drama, or is this just the calm before another round of volatility?
Read More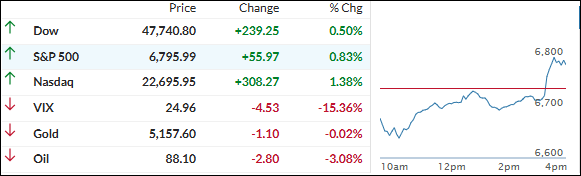