
ETF Tracker StatSheet
You can view the latest version here.
SHAKING OFF BANKING FEARS
- Moving the markets
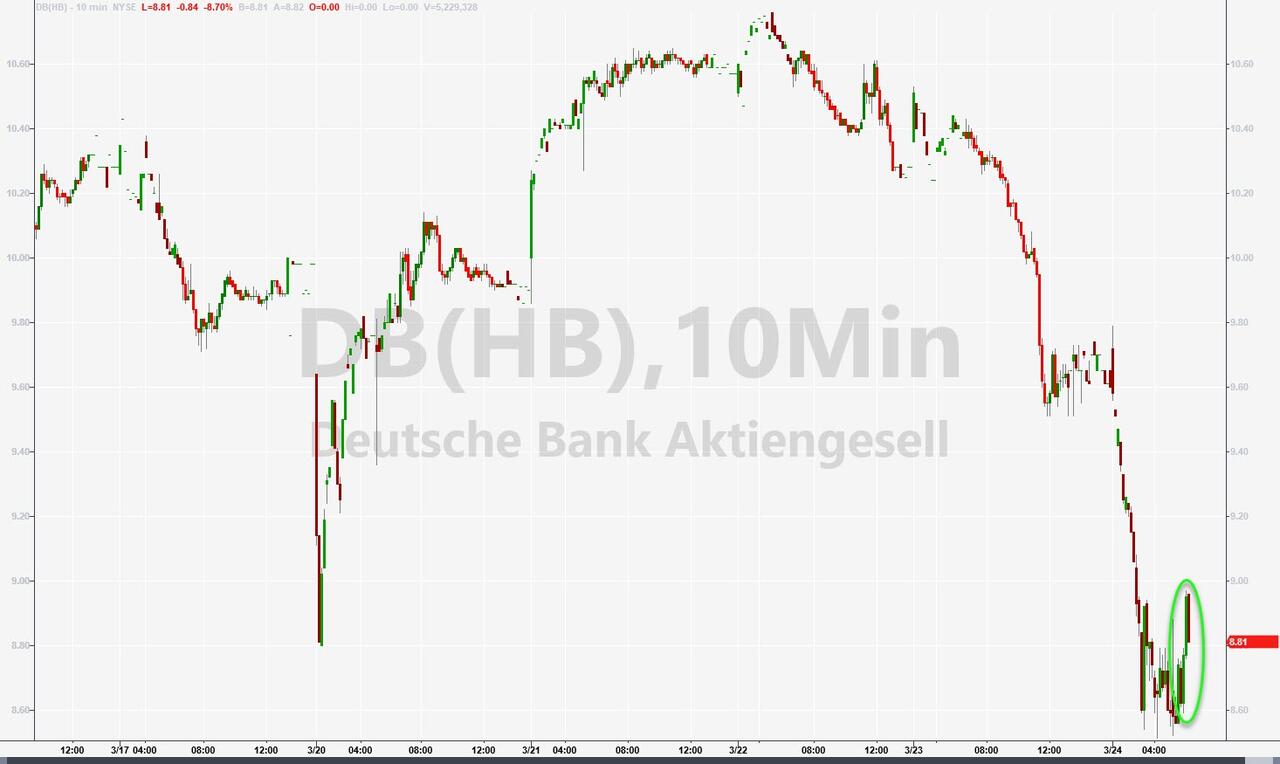
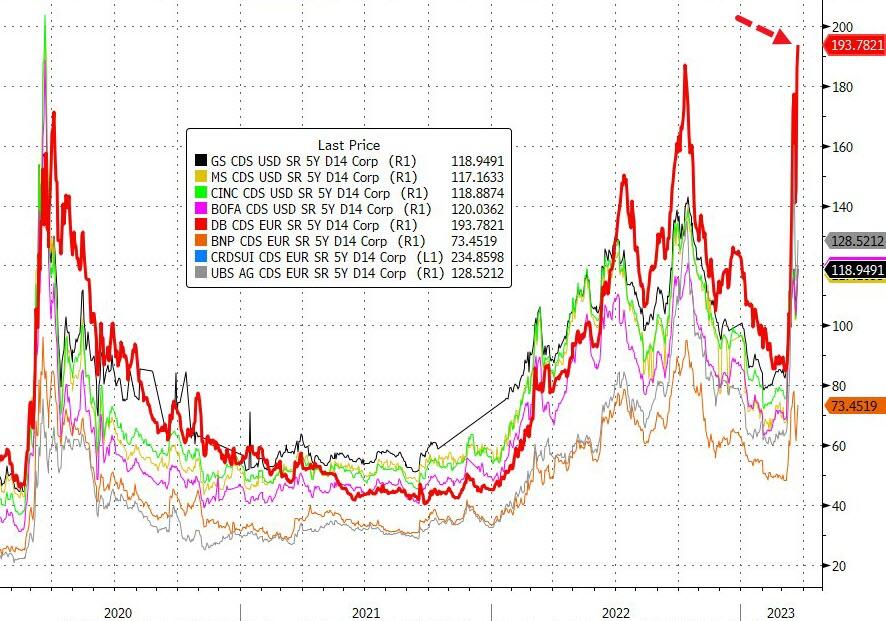
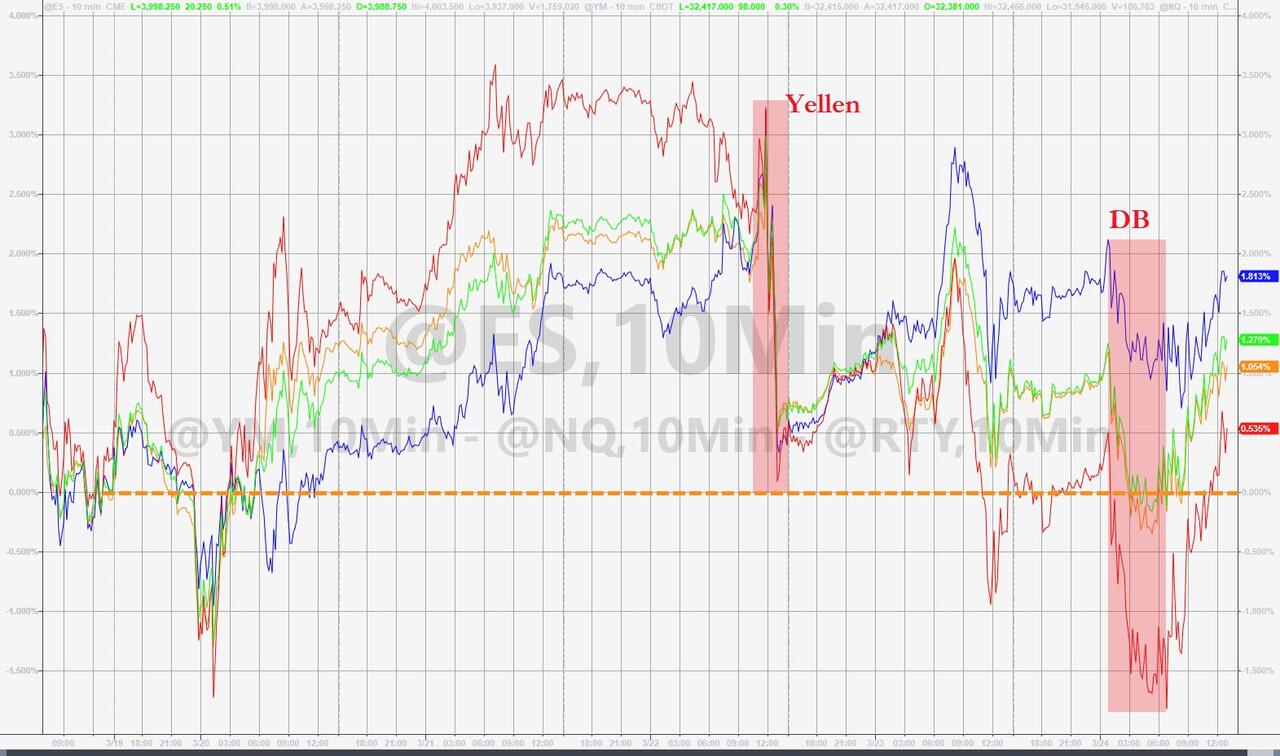
Finally, the much awaited and my opinion top banking cockroach, namely Deutsche Bank (DB), made an appearance with its shares sliding due to the German lenders’ Credit Risk jumping, but without an apparent spark.
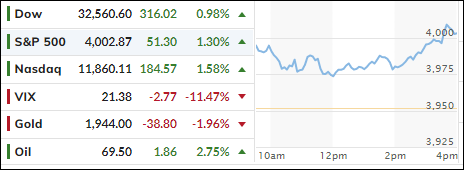
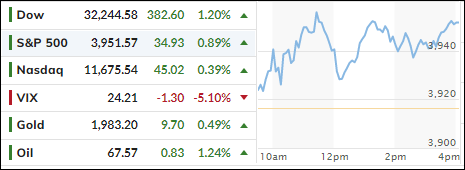
With the Credit Suisse debacle fresh on everyone’s mind, traders were “sensitive” to more questionable banking news, so the major indexes took an early bath. As the session wore on, however, DB managed to crawl out of that early 7% hole, which helped the US market reduce their early losses.
European notable voices tried to calm down the situation, as ZeroHedge pointed out:
- GERMANY’S SCHOLZ: EUROPEAN BANKING OVERSIGHT IS ROBUST AND STABLE, DEUTSCHE BANK IS `VERY PROFITABLE’, NO REASON FOR WORRY
- ECB’S LAGARDE TELLS EU LEADERS EURO AREA BANKING SECTOR STRONG, ECB FULLY EQUIPPED TO PROVIDE LIQUIDITY TO EURO AREA FINANCIAL SYSTEM, IF NEEDED
- MACRON: EUROPEAN BANKS HAVE SOLID FUNDAMENTALS
While the day was saved, I think DB will be again the center of attention possibly as early as next week, despite the “impressive” jawboning of the above European leaders.
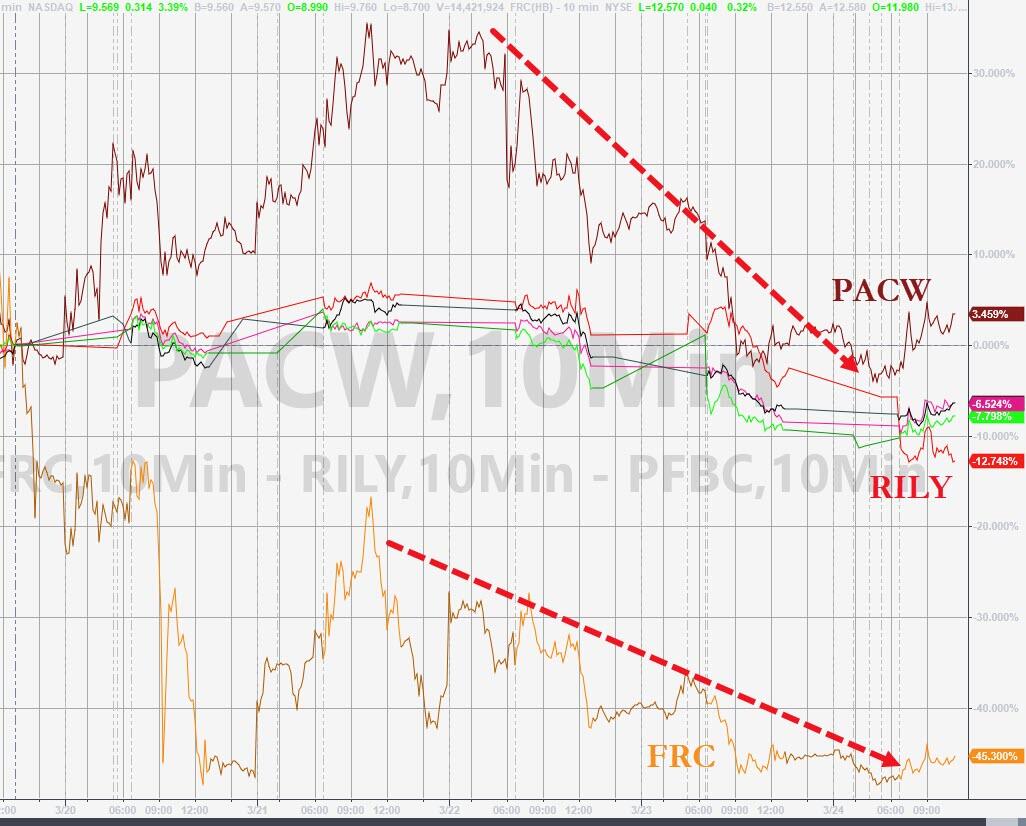
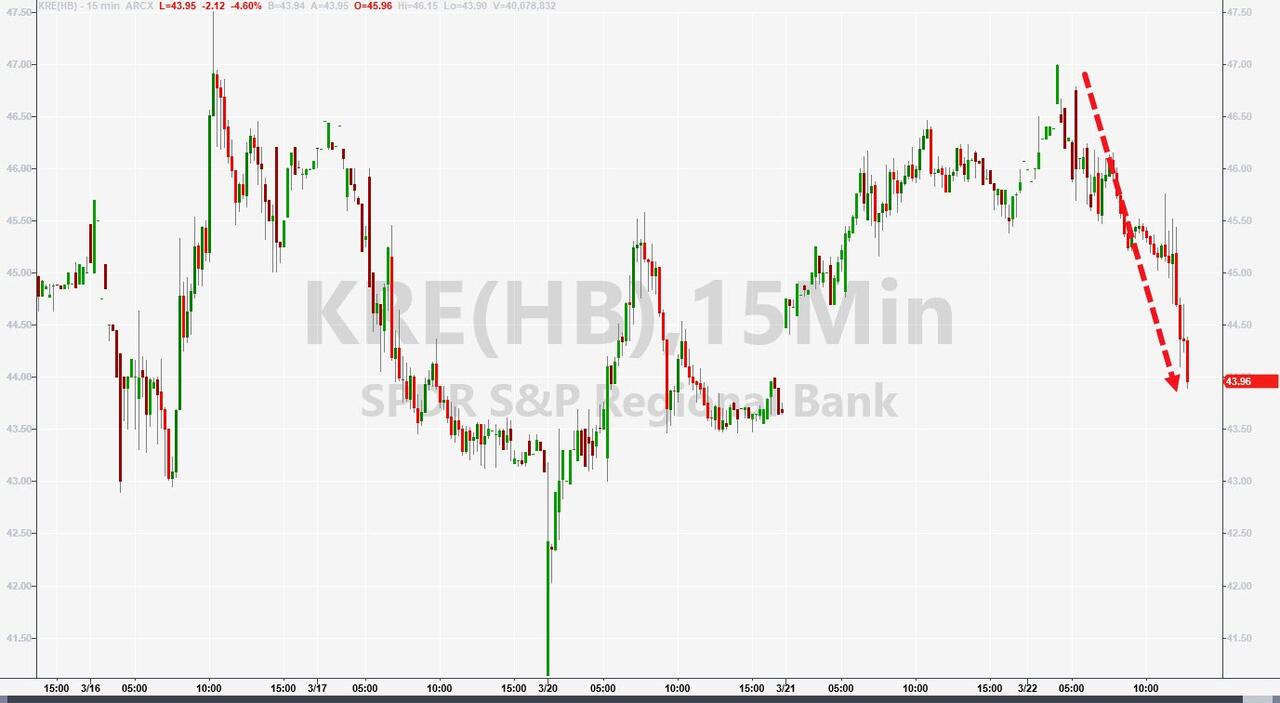
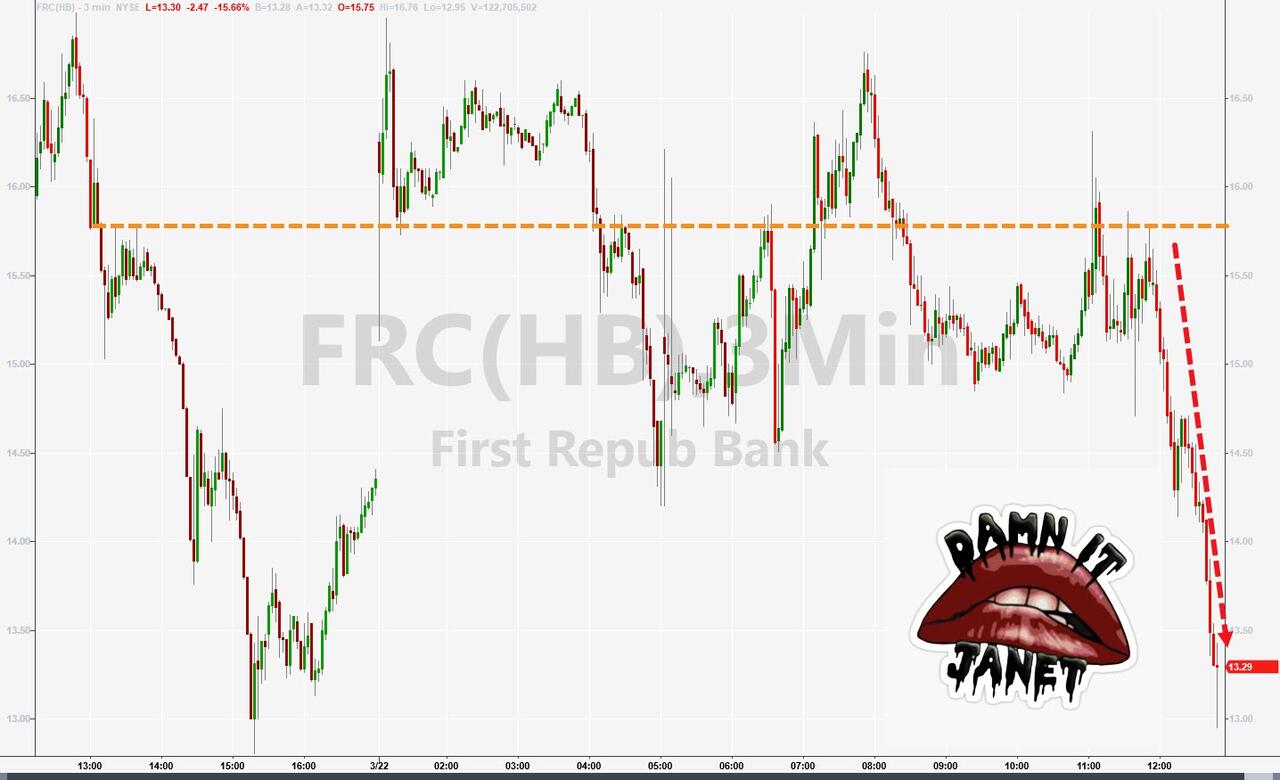
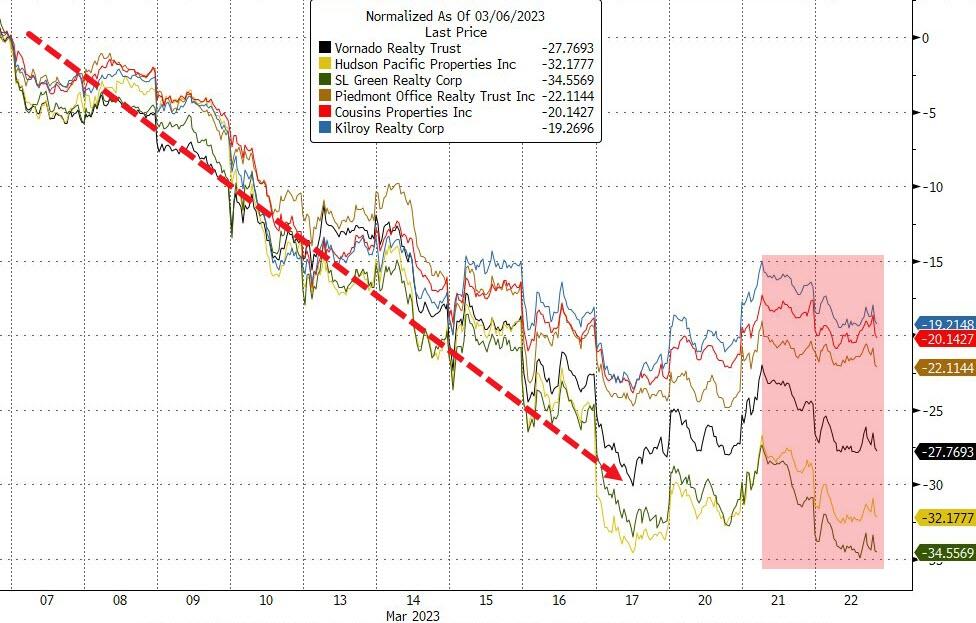
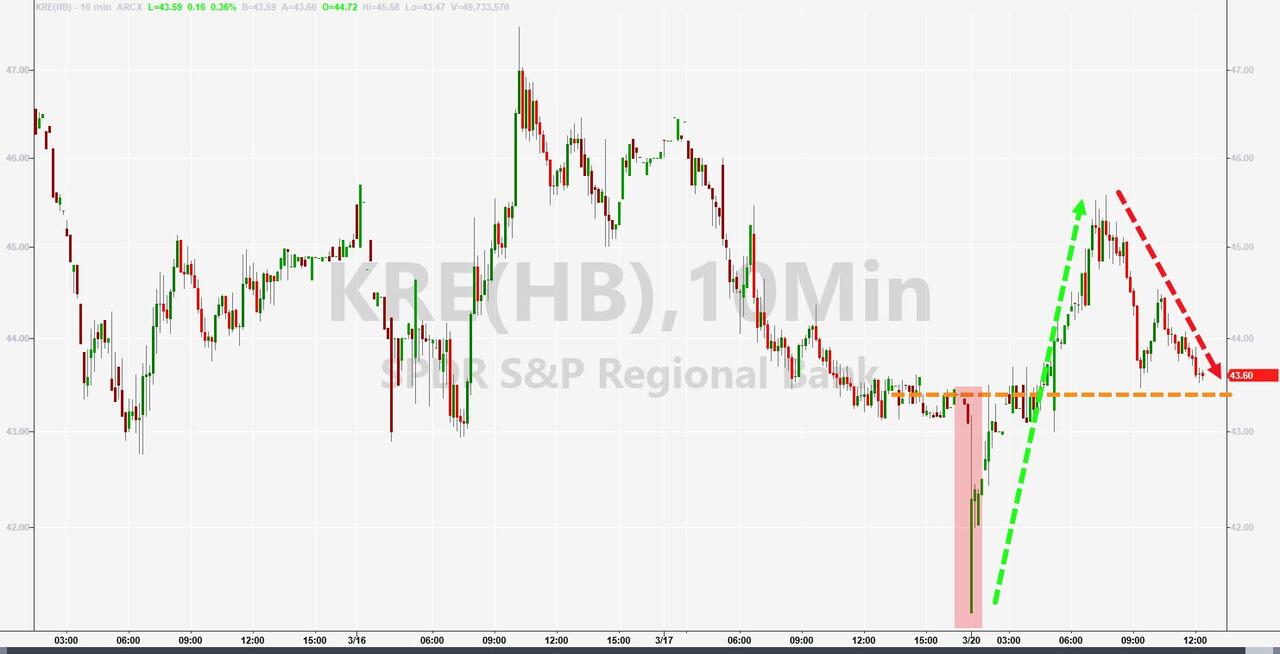
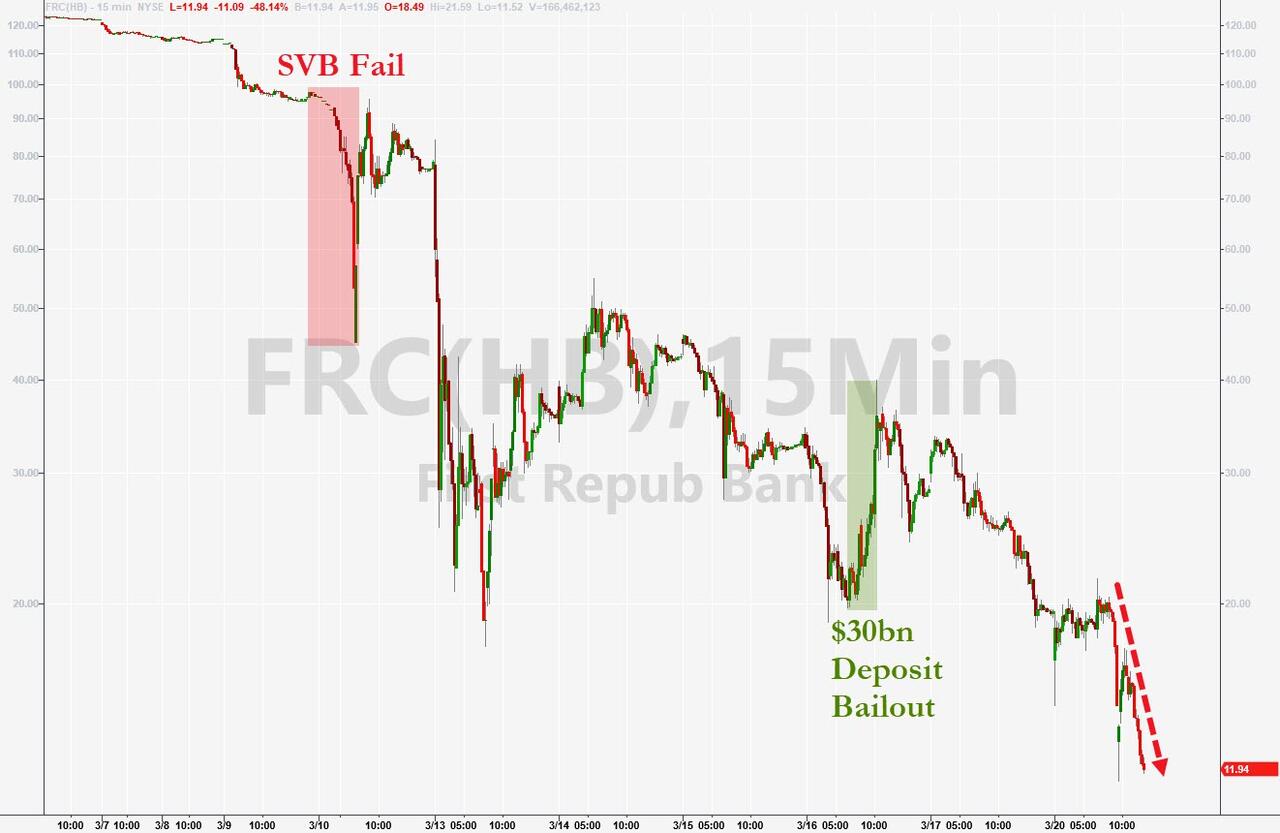
The regional banks stock index KRE rode the rollercoaster but managed to close around its unchanged line, but some individual banks did not fare so well.
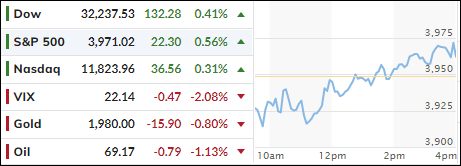
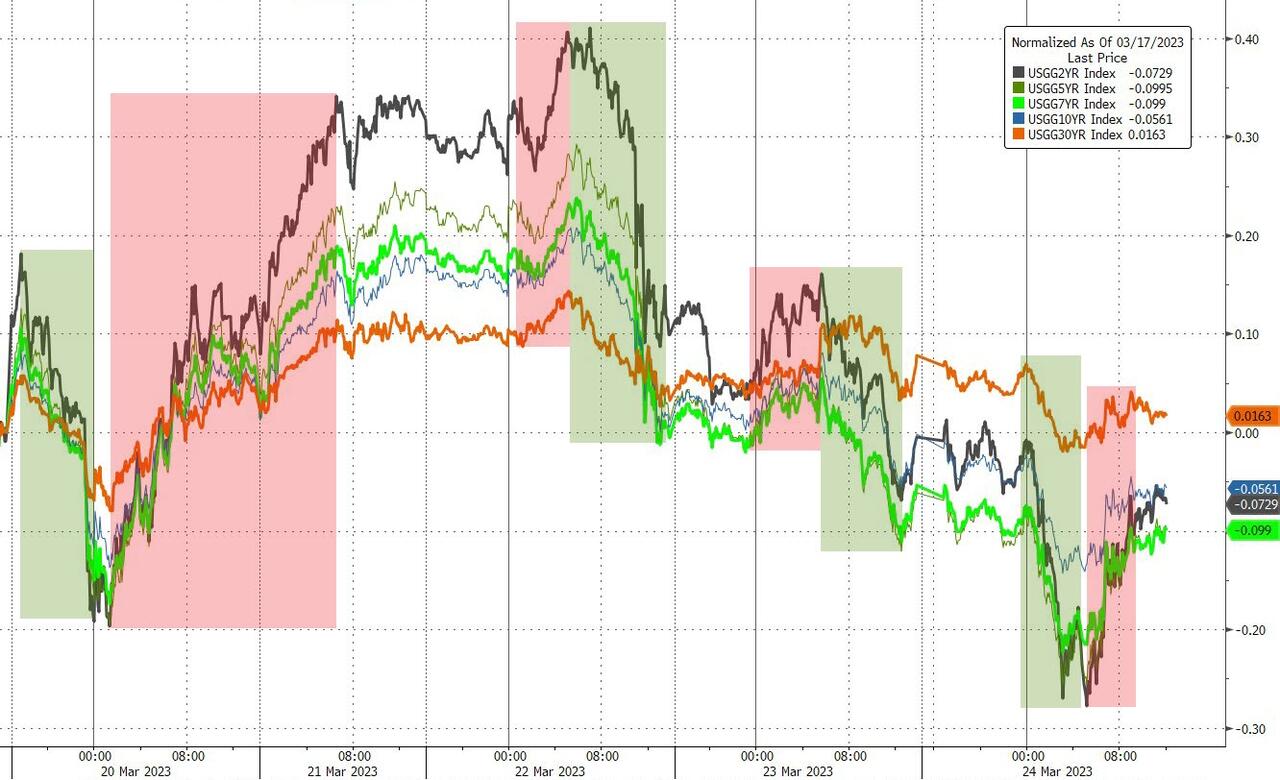
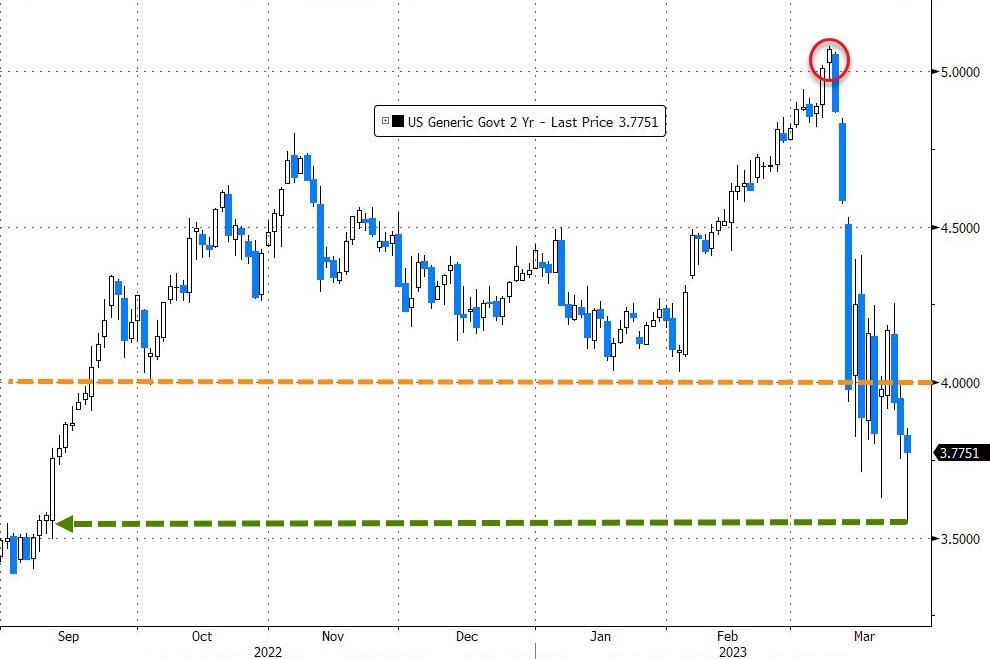
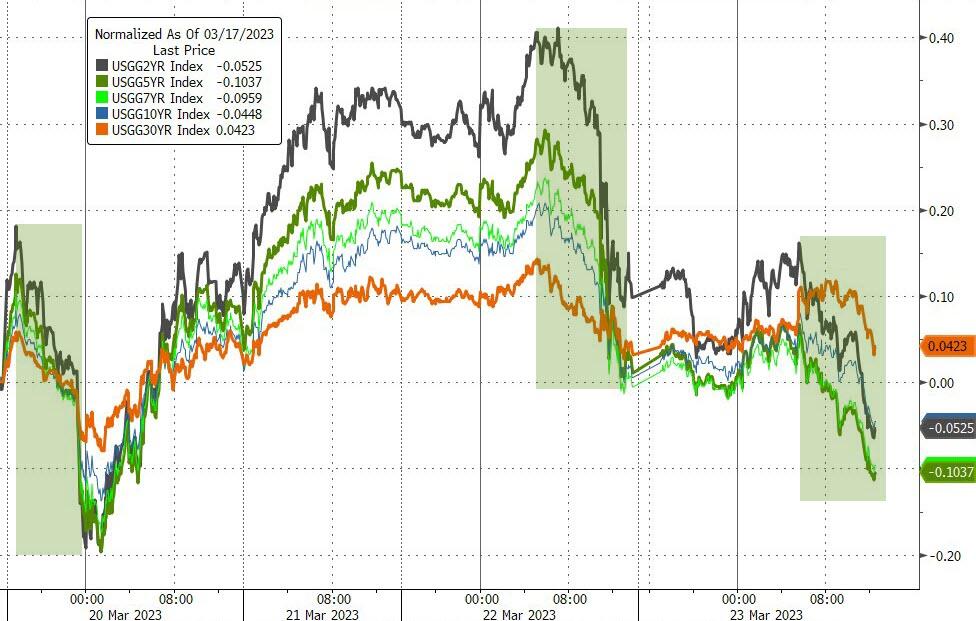
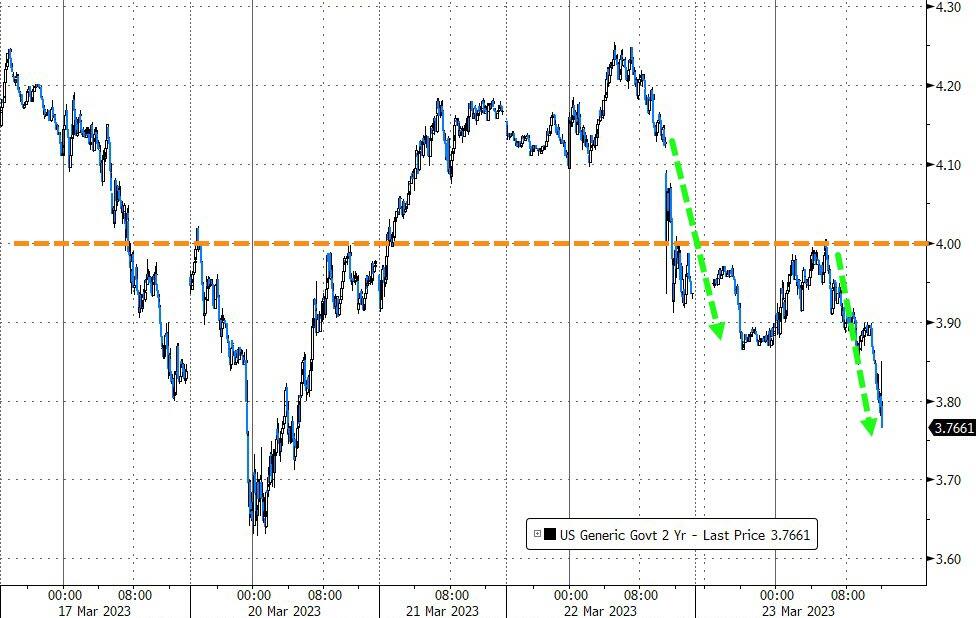
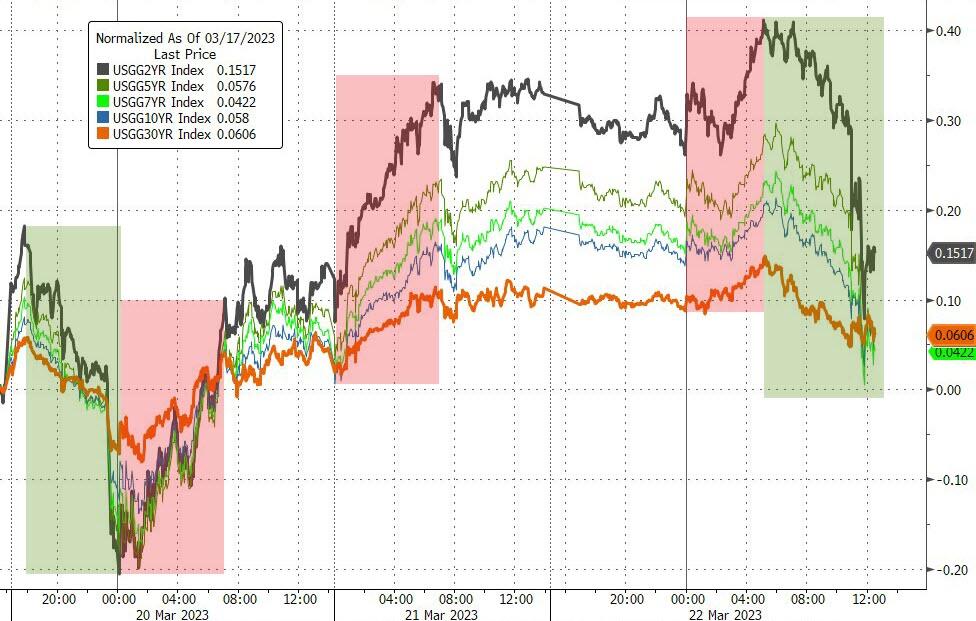
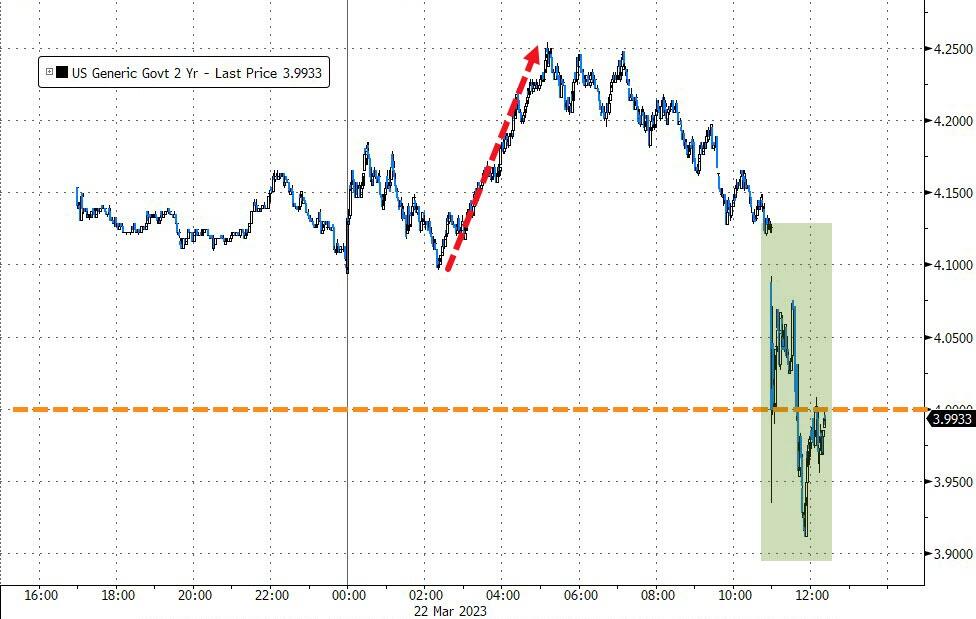
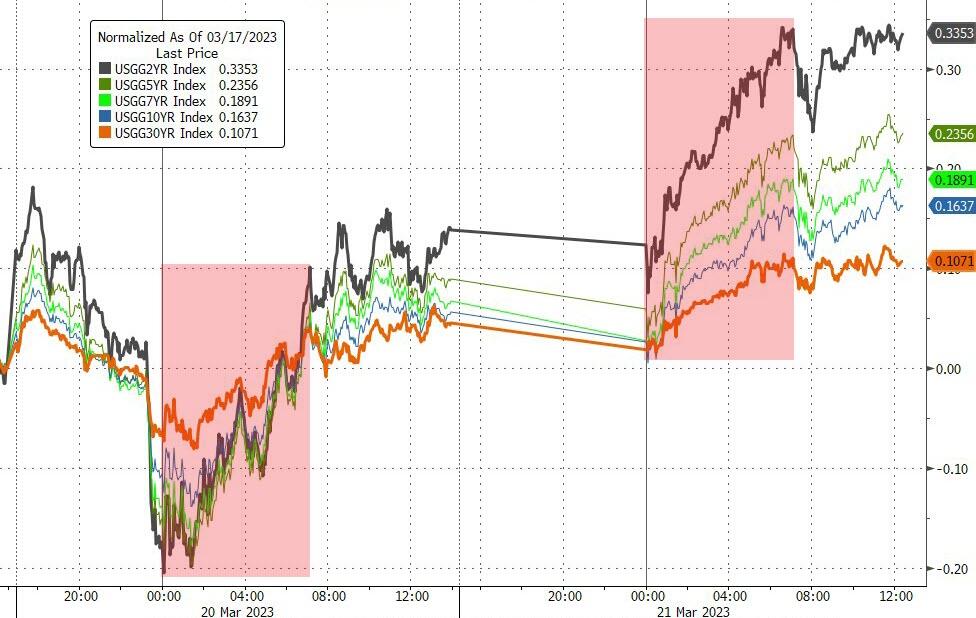
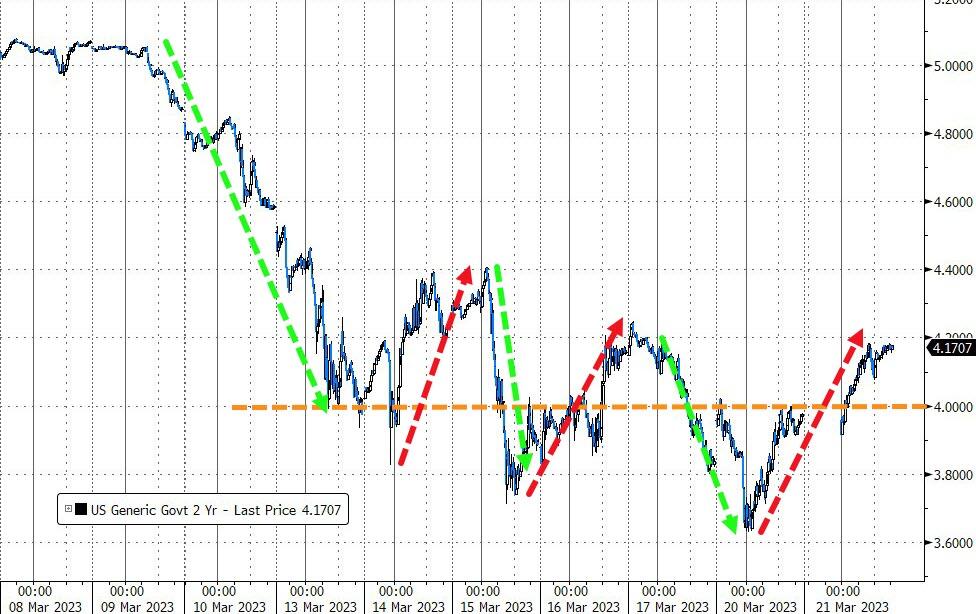
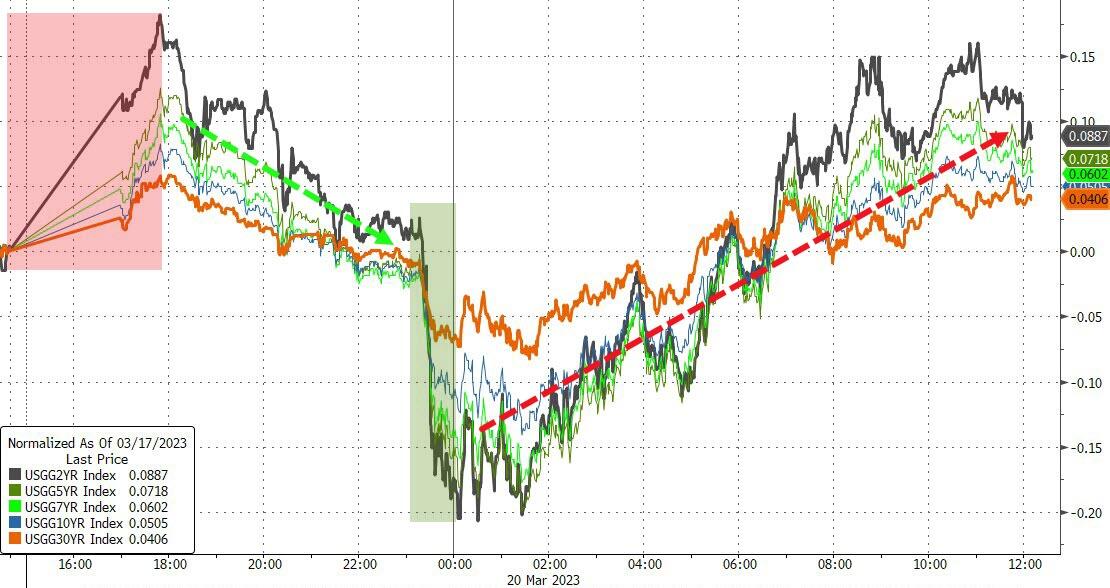
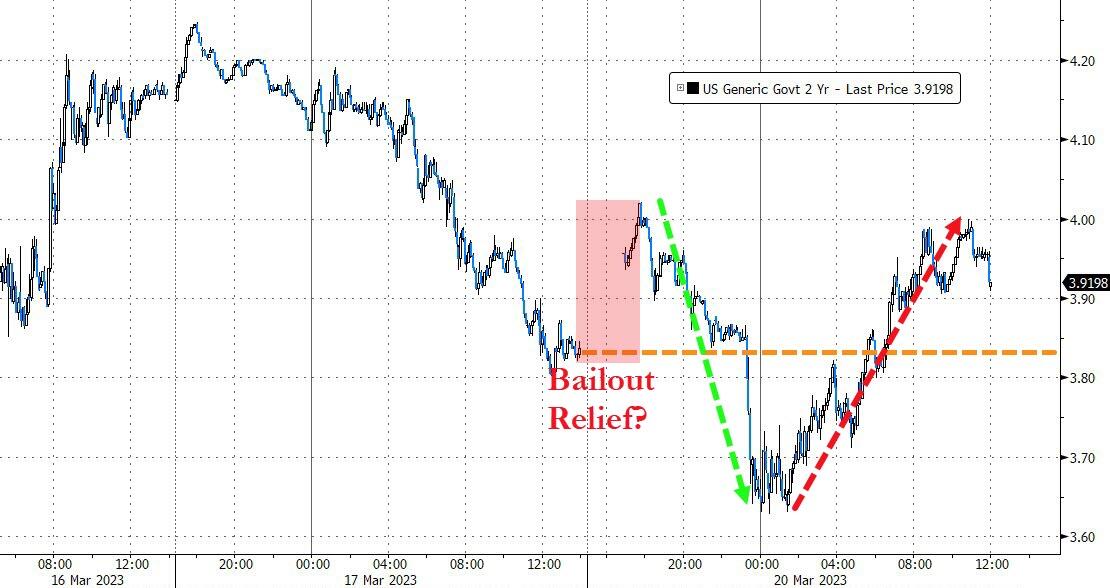
Bond yields were mixed for the week, but the 2-year tumbled way below its 4% level and to its lowest since September 2022.
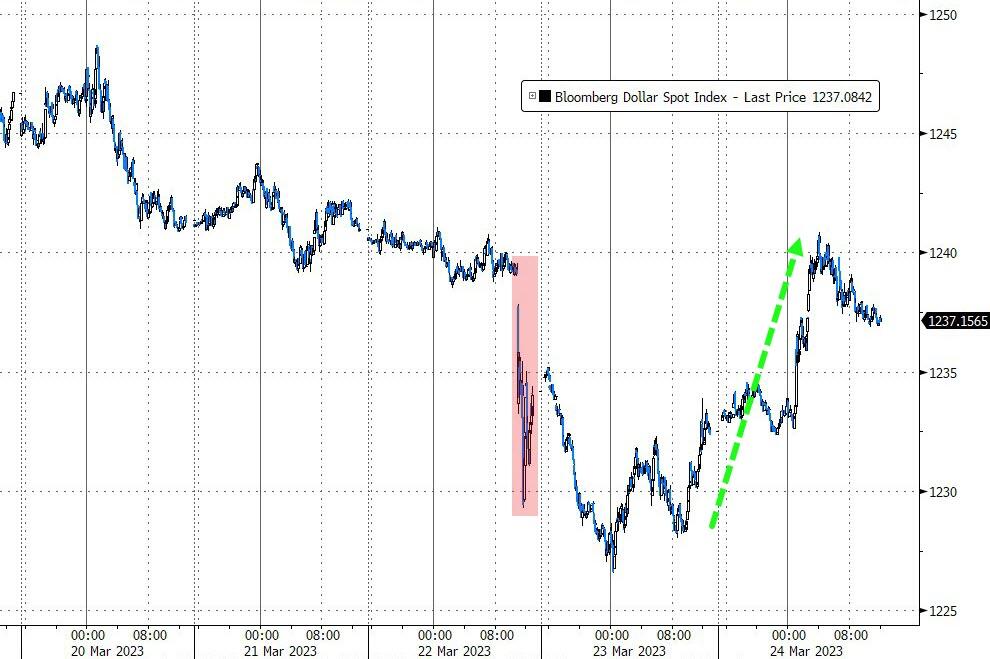
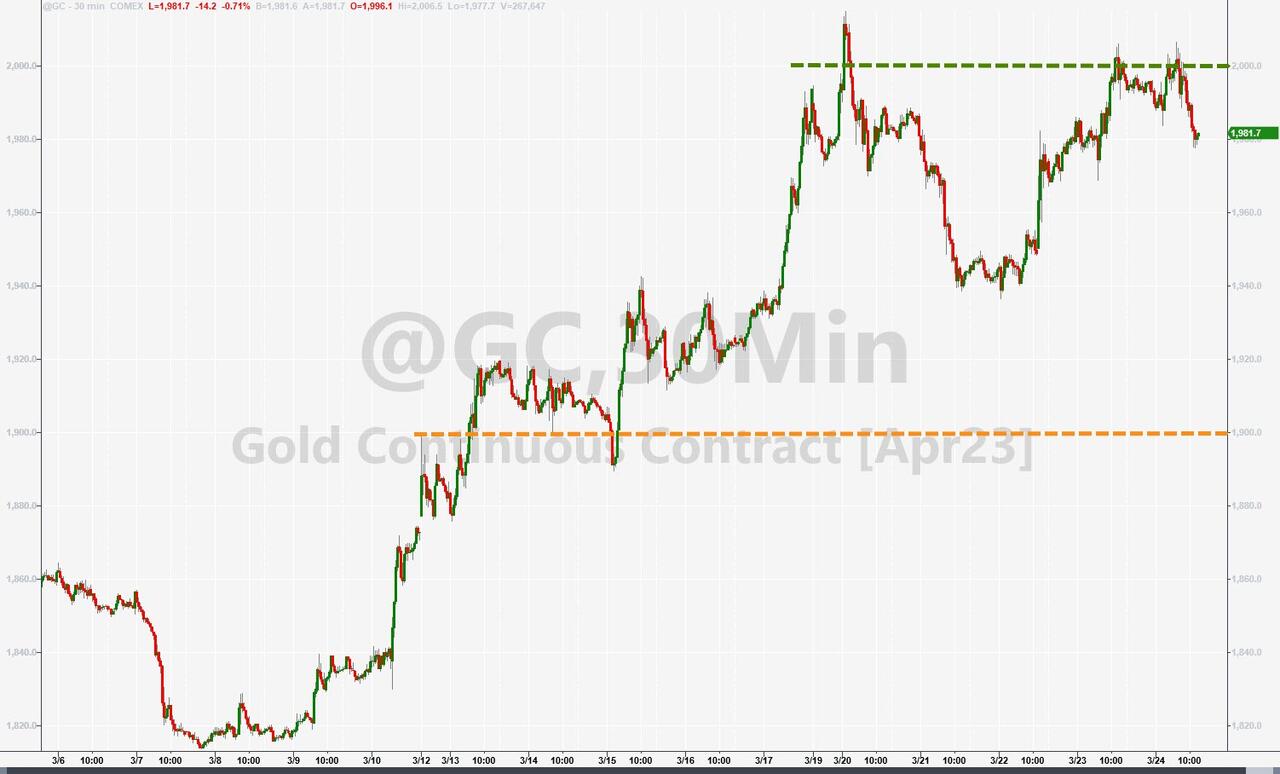
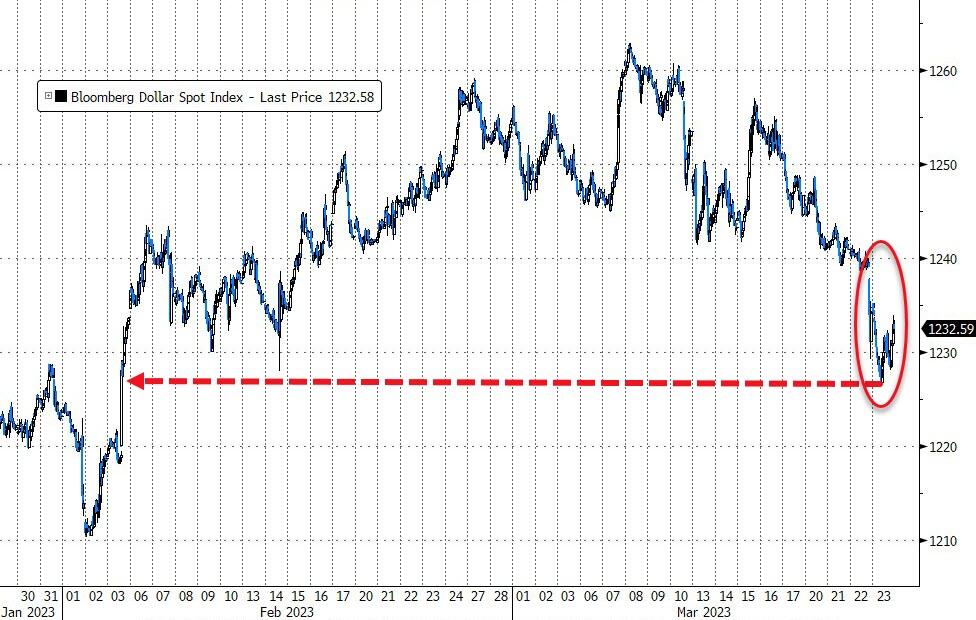
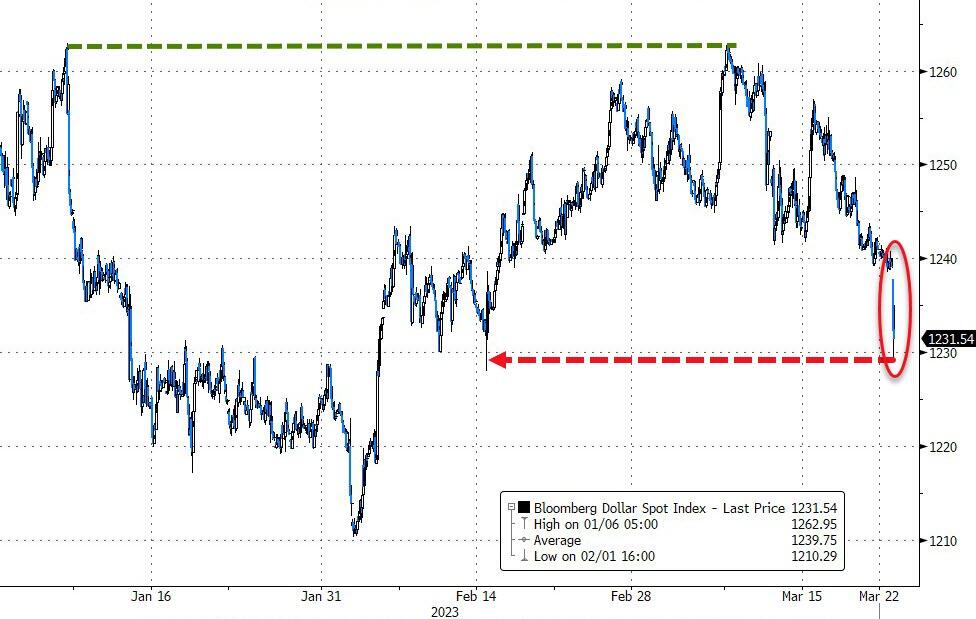
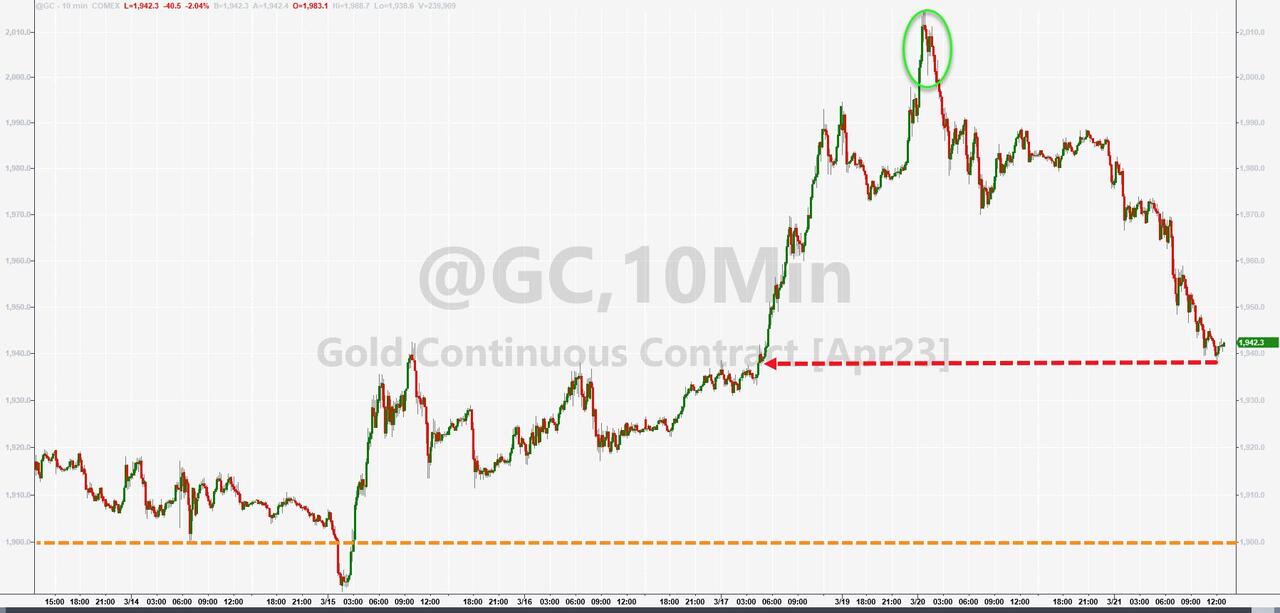
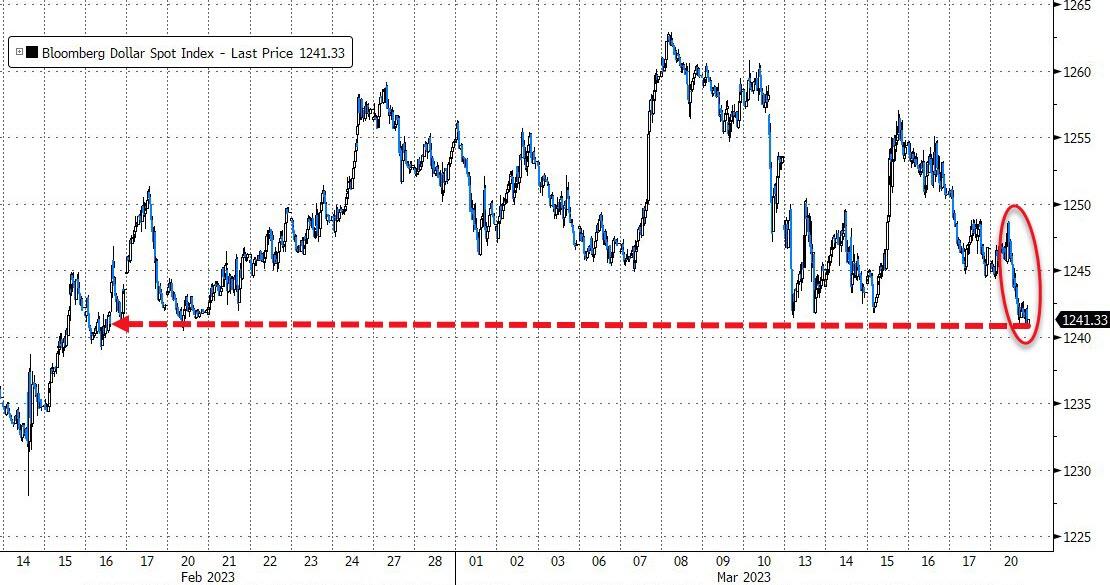
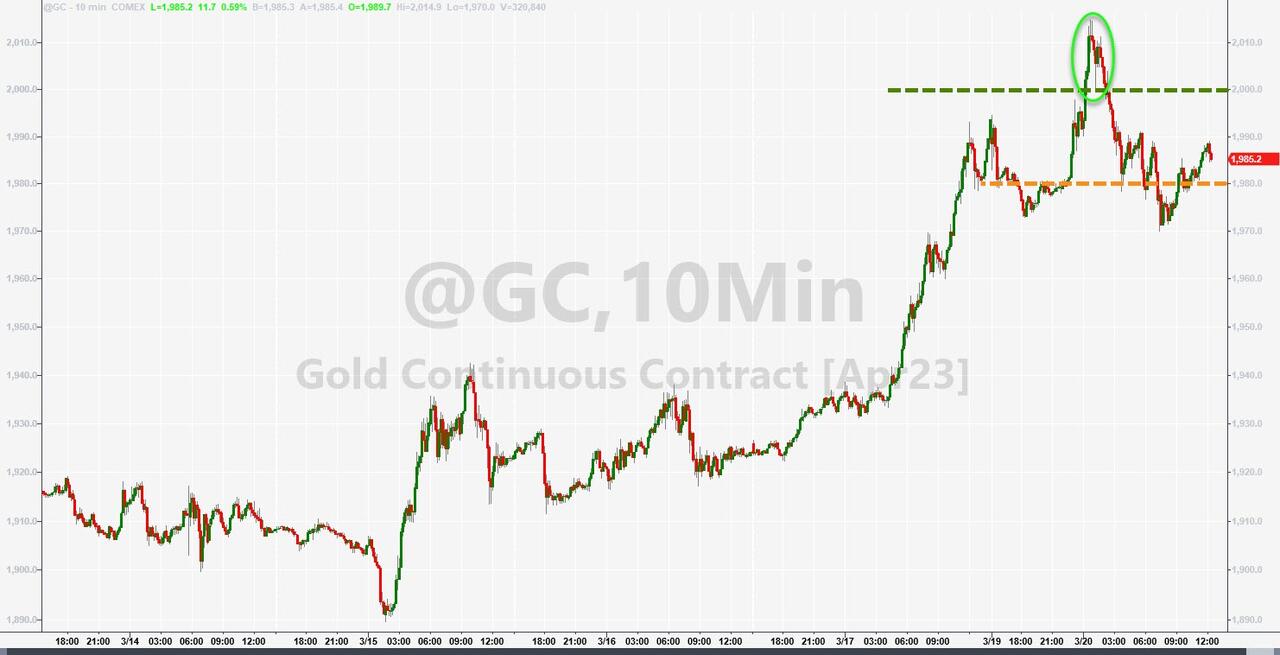
The US Dollar, despite ending the week lower, showed signs of life today by rallying 0.55%. That pulled Gold off its high, but it’s notable that the precious metal, during this past week, peeked its head twice above the $2,000 mark.
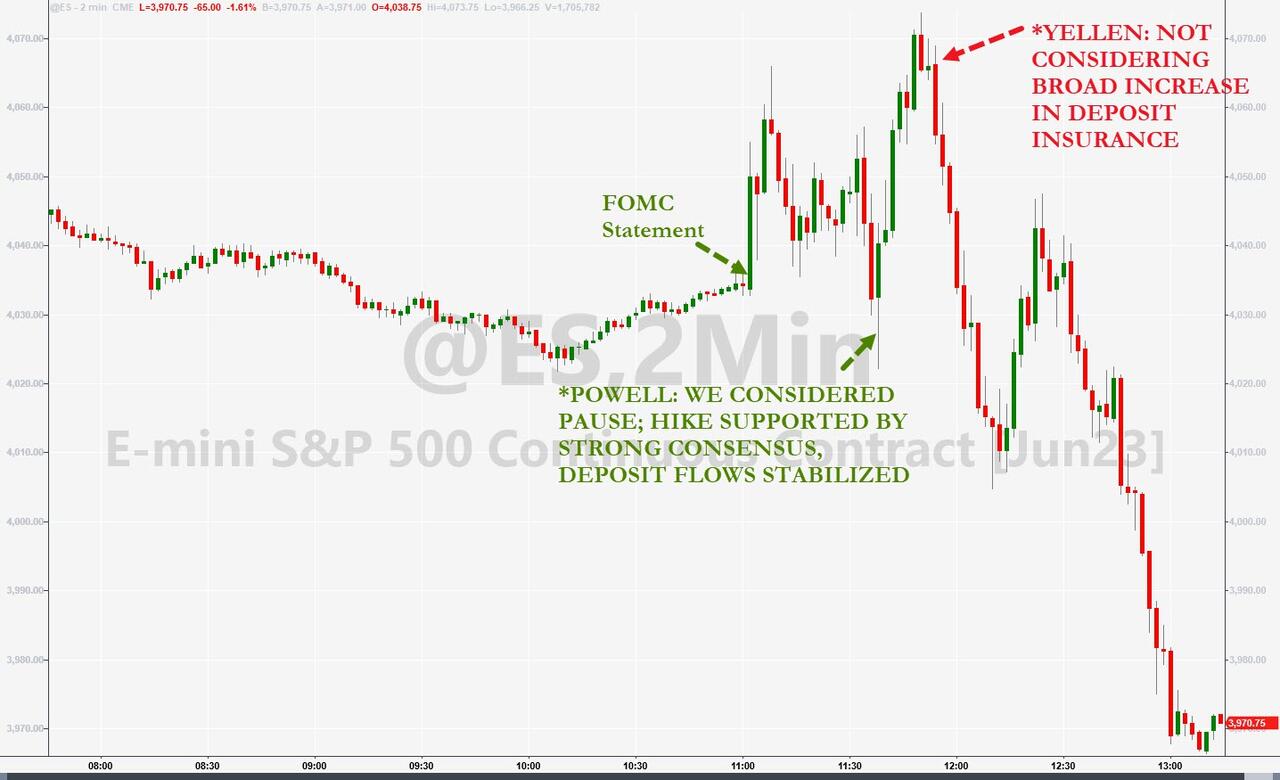
The Fed is clearly caught between a rock and a hard place. Being serious about fighting inflation requires sharply higher interest rates. However, helping a sliding economy and a collapsing banking system has traders and algos convinced that the Fed is forced to pause or pivot.
If they do, inflation will soar, but stocks will initially join in and rally. If they don’t pause, the financial system is likely to crumble.
Which will it be?
Read More