Markets Rebound Despite Early Slips And Economic Concerns

Ulli Market Commentary Contact

[Chart courtesy of MarketWatch.com]

  1. Moving the market

Coming off a winning week, the major indexes initially slipped but managed to regain their footing, closing in the green once again.

The markets went through a significant downturn in early August due to the Japanese yen debacle and disappointing jobs data, which heightened traders’ concerns that the Federal Reserve was lagging in easing its interest rate policy.

However, recent headline news, including CPI, PPI, and retail sales, has temporarily alleviated those fears, despite underlying economic weaknesses persisting. As a result, conflicting data points will continue to fuel recessionary discussions.

There is hope that the Federal Reserve will provide insights into a potential rate cut during this week’s Jackson Hole symposium.

Before that, traders will closely analyze the minutes from the Fed’s latest meeting, set to be released this Wednesday. Despite the US Leading Indicators being down for the 29th consecutive month, as ZH pointed out, reaching levels worse than the trough of the Covid lockdowns, bullish sentiment remains strong.

Concerns were quickly dispelled by another substantial short squeeze, which boosted Small Caps and the broader market, including the MAG 7 basket, although they encountered overhead resistance.

The dollar’s continued decline benefited gold, keeping the precious metal above the $2,500 level. Bond yields remained unchanged, with the 2-year yield staying above 4%.

Bitcoin experienced a drop overnight but surged to $59k during the regular session, while crude oil was not as fortunate and fell below the $75 price point.

Traders are focused on the Fed’s Jackson Hole symposium, which has not been favorable to the markets in the past three years.

Will this time be different?

Read More

ETFs On The Cutline – Updated Through 08/16/2024

Ulli ETFs on the Cutline Contact

Do you want to know which ETFs are hot and which ones are not? Then you need my High-Volume ETF Cutline report. It tells you how close or far each of the 311 ETFs I follow is from its long-term trend line (39-week SMA). These are the ETFs that trade more than $5 million a day, so they are not some obscure funds that nobody cares about.

The report is split into two parts: The winners that are above their trend line (%M/A), and the losers that are below it. The yellow line is the line of shame that separates them. You can see how many ETFs are in each group and how they have changed since the last report (245 vs. 270 current).

Take a peek:

The HV ETF Master Cutline Report

If you are confused by some of the terms we use, don’t panic. I have a helpful Glossary of Terms for you.

If you want to learn more about the Cutline method and how it can make you rich (or at least less poor), read my original post here.

ETF Tracker Newsletter For August 16, 2024

Ulli ETF Tracker Contact

ETF Tracker StatSheet          

You can view the latest version here.

GOLD SURGES TO RECORD HIGH AS DOLLAR HITS 5-MONTH LOWS

[Chart courtesy of MarketWatch.com]

  1. Moving the market

The major indexes entered a consolidation phase following this week’s recovery rally, which erased the losses sustained in early August. The S&P 500 has now broken even. A midday comeback propelled US equities to their best week since 2023, with the index recording a 3% gain for the week, marking its best performance since November 2023.

Despite Thursday’s retail sales exceeding expectations, the next monthly adjustment is likely to be downward, like the last 8 out of 10 adjustments. However, Wall Street remains focused on market-pleasing headline numbers, and this one is no exception. Coupled with a decline in initial jobless claims, traders are confident that recent recession fears were exaggerated, and a soft landing is still anticipated. Hope remains strong.

A looming recession and uncontrolled inflation will continue to be concerns for the foreseeable future, as I mentioned in previous commentaries. Nonetheless, a rate cut is expected when the Fed meets in September, not because inflation has been conquered, but due to dire economic conditions.

The dollar fell to 5-month lows, benefiting gold, which not only surpassed the $2,500 level for the first time but also surged 2.2% to a record high. The MAG 7 basket recovered from the early August downturn, recouping all losses, with the ongoing short squeeze contributing to bullish sentiment.

Despite the attention on the CPI, PPI, and retail sales, the Economic Surprise Index slid towards its all-time low, casting doubt on the market’s positive reaction as rate-cut expectations soured. For the week, bond yields remained even, Bitcoin fluctuated but ended unchanged, and oil prices were flat.

The bulls dominated this week, but it’s important to remember the causes of last week’s debacle: a sharp deterioration in US employment and the collapse of the Japanese yen carry trade.

These issues remain unresolved and have only been temporarily overshadowed by the latest headlines.

Read More

Weekly StatSheet For The ETF Tracker Newsletter – Updated Through 08/15/2024

Ulli ETF StatSheet Contact

ETF Data updated through Thursday, August 15, 2024

How to use this StatSheet:

  1. Out of the 1,800+ ETFs out there, I only pick the ones that trade over $5 million per day (HV ETFs), so you don’t get stuck with a lemon that nobody wants to buy or sell.
  1. Trend Tracking Indexes (TTIs)

These are the main indicators that tell you when to buy or sell Domestic and International ETFs (section 1 and 2). They do that by comparing their position to their long-term M/A (Moving Average). If they cross above, and stay there, it’s a green light to buy. If they fall below, and keep going, it’s a red light to sell. And to make sure you don’t lose your shirt if things go south, I also use a 12% trailing stop loss on all positions in these categories.

  1. All other investment areas don’t have a TTI and should be traded based on the position of each ETF relative to its own trend line (%M/A). That’s why I call them “Selective Buy.” In other words, if an ETF goes above its own trend line, you can buy it. But don’t forget to use a trailing sell stop of 12%, or less if you’re feeling nervous.

If some of these words sound like Greek to you, please check out the Glossary of Terms and new subscriber information in section 9.

  1. DOMESTIC EQUITY ETFs: BUY— since 11/21/2023

Click on chart to enlarge

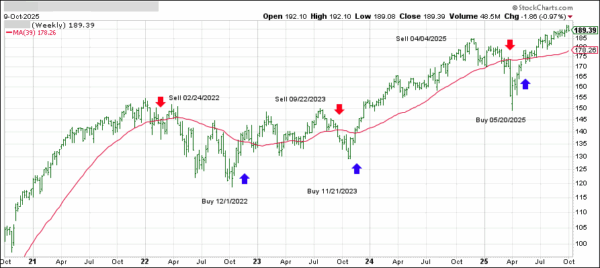
This is our main compass, the Domestic Trend Tracking Index (TTI-green line in the above chart). It has broken above its long-term trend line (red) by +6.09% and is in “Buy” mode as posted.

Read More

Retail Sales Boost Equities, But Economic Concerns Persist

Ulli Market Commentary Contact

[Chart courtesy of MarketWatch.com]

  1. Moving the market

The major indexes surged right after the opening bell, driven by growing trader confidence that a recession could be avoided due to better-than-expected retail sales. The July retail numbers reportedly increased by 1%, significantly surpassing the forecast of 0.3%, while volatile jobless claims fell for the week.

However, revisions are likely on the horizon, as ZH noted that for the eighth month in the past year, the previous month’s data was revised lower. This highlights the transient nature of headline news that does nothing but appease the markets.

For now, this data has acted as a catalyst for equities, especially after concerns about a slowing economy were heightened by July’s disappointing jobs report from August 2nd. Nonetheless, economic issues remain unresolved, with the US Surprise Index heading towards its 2024 lows. Currently, the major indexes have managed to erase all of August’s losses, with the S&P 500 now less than 3% below its record high.

Positive data points like these not only alleviate recession fears but also reduce pressure on the Federal Reserve to cut rates aggressively. However, when considering the broader picture of mass layoffs, record store closures, and declining real wages, the current upbeat numbers appear to be outliers and may be short-lived.

The continuation of this month’s short squeeze provided the necessary boost to ramp up equities, with the MAG 7 enjoying a winning streak for six consecutive sessions.

Bond yields spiked, as did the dollar, but gold experienced a rollercoaster ride and managed to close in the green. Bitcoin took a dive on news that the US government plans to sell some of its holdings, causing the cryptocurrency to drop towards $57k. Meanwhile, crude oil recovered from yesterday’s sell-off.

As ZH pointed out, while stocks are experiencing a “Goldilocks” environment, bond yields and rate-cut expectations have diverged, presenting a different picture that suggests a potential recession.

Who will be right?

Read More

Confusing Session: Mixed Results Across Markets

Ulli Market Commentary Contact

[Chart courtesy of MarketWatch.com]

  1. Moving the market

Equities scored moderate gains, led by the Dow, as the much-anticipated Consumer Price Index (CPI) fell below the 3% mark, coming in at 2.9%, its lowest reading since 2021. Month-over-month prices increased by 0.2%, aligning with expectations, as did core inflation, which excludes food and energy.

This follows a better-than-expected Producer Price Index (PPI) report, which boosted stocks during yesterday’s market surge. Traders believe these figures have increased the likelihood of the Federal Reserve cutting rates at their next meeting in September.

Speculation is now rife about whether the Fed will cut rates by 25 or 50 basis points. Future economic data will be crucial, as weaker data could support a change in Fed policy.

The session was somewhat perplexing: Small Caps declined, the Dow rose, the Nasdaq remained unchanged, bond yields were mixed, and the dollar initially slid before staging a comeback. The Mag7 basket rallied, but commodities dropped.

Gold and Bitcoin both declined, with Bitcoin affected by news that the U.S. government may be selling some of its holdings. Crude oil also followed a downward trend but found support at the $77 level.

Traders are now focusing on tomorrow’s major event—the release of retail sales data, which has the potential to move markets in either direction.

Read More