Gambling On A Positive CPI Report

Ulli Market Commentary Contact

[Chart courtesy of MarketWatch.com]

  1. Moving the markets

Stocks resumed their Ramp-A-Thon into tomorrow’s CPI report, as traders were betting that Thursday’s inflation data will present validation of a decelerating trend. Confidence reigned supreme that the Fed’s rate hikes had their planned impact and that a policy reversal might be on deck, as “the Fed will cave” story gained momentum.

While the CPI forecast still calls for a 6.5% increase from the prior year, prices are expected to have slipped a moderate 0.1% in December from the prior month. Even Bloomberg chimed in with the headline “Stocks Bounce Back with Brewing Optimism Over CPI,” as the hype shifted into overdrive.

A big assist came again from a short squeeze, forcing prices higher like they did ahead of December’s CPI, before plunging back to reality, as ZeroHedge put it. Trader Gurmit Kapoor clarified the importance of this upcoming data point as follows:

Tomorrow’s CPI event risk could be a decider where the S&P 500 can either break above its 200-day moving average, the 4,000 level and the downtrend line, or we head back to 3,800.

Bond yields retreated, the US Dollar stayed in its sideways channel, and Gold inched higher, but its move was marked by wild intraday swings.  

A tip of the hat goes to ZH for graphically pointing out what happened in December after a “soft” CPI print.

Will history repeat itself via following the adage “buy the rumor, sell the fact?”

Read More

Finding Support

Ulli Market Commentary Contact

[Chart courtesy of MarketWatch.com]

  1. Moving the markets

After much bobbing and weaving, the major indexes found some footing and closed in the green led by the Nasdaq with a 1% gain. Upcoming economic data points and corporate earnings later this week kept the rally in check.

All eyes were on Fed head Powell’s speech this morning and, as ZeroHedge pointed out, his view on current “unwarranted” easing of financial conditions. In the end, Powell said nothing and barely commented on monetary policy at all.

Traders took that as a bullish sign and, despite the looming CPI report on Thursday, pushed stocks higher and out of the doldrums. An assist came from a short squeeze, which finally had the desired effect after two failed attempts.  

Bond yields rose, the US Dollar went sideways, and Gold squeezed out some modest gains and maintaining last week’s advance.

I expect the sideways to slighter higher pattern to continue, until Thursday’s CPI will likely end the current tug-of-war between bulls and bears.

Continue reading…

2. “Buy” Cycle Suggestions

For the current Buy cycle, which started on 12/1/2022, I suggested you reference my most recent StatSheet for ETFs selections. However, if you came on board later, you may want to look at the most current version, which is published and posted every Thursday at 6:30 pm PST.

I also recommend for you to consider your risk tolerance when making your selections by dropping down more towards the middle of the M-Index rankings, should you tend to be more risk adverse. Likewise, a partial initial exposure to the markets, say 33% to start with, will reduce your risk in case of a sudden directional turnaround.

We are living in times of great uncertainty, with economic fundamentals steadily deteriorating, which will eventually affect earnings negatively and, by association, stock prices. I can see this current Buy signal to be short lived, say to the end of the year, and would not be surprised if it ends at some point in January.

In my advisor practice, we are therefore looking for limited exposure in value, some growth and dividend ETFs. Of course, gold has been a core holding for a long time.

With all investments, I recommend the use of a trailing sell stop in the range of 8-12% to limit your downside risk.

3. Trend Tracking Indexes (TTIs)

Our TTIs headed north, as the markets finished the session with bullish sentiment.

This is how we closed 01/10/2023:

Domestic TTI: +3.97% above its M/A (prior close +3.20%)—Buy signal effective 12/1/2022.

International TTI: +6.52% above its M/A (prior close +6.26%)—Buy signal effective

12/1/2022.

Disclosure: I am obliged to inform you that I, as well as my advisory clients, own some of the ETFs listed in the above table. Furthermore, they do not represent a specific investment recommendation for you, they merely show which ETFs from the universe I track are falling within the specified guidelines.

All linked charts above are courtesy of Bloomberg via ZeroHedge.

Thriving And Diving

Ulli Market Commentary Contact

[Chart courtesy of MarketWatch.com]

  1. Moving the markets

A continuation of Friday’s rally hit a overhead resistance, with the major indexes reversing direction and plunging below their respective unchanged lines. The exception was the Nasdaq, which managed to hang on to a +0.63% gain, as traders scooped up some of the beaten-up shares like Tesla.

Optimism ruled, compared to the end of 2022, as traders are convinced that inflation may be easing, which explains today’s preference of “growth” assets over “value” ones. Whether that relentless hope will pay off remains to be seen, because the Fed has constantly emphasized its narrative of “no rate cuts” this year.

Market participants simply refuse to accept any Fed jawboning, with today being a perfect example, as ZeroHedge noted:

Fed’s Daly: “Getting inflation down to 2% won’t be completed this year.”

Fed’s Bostic: “I favor hiking rates to 5-5.25%, then hold through 2024. We are just going to have to hold our resolve and let the policy work.”

Bond yields dropped and gave an assist to the early rally, but in the end, they could not keep the markets propped up. The US Dollar slid, and Gold extended its gains to its highest since May 2022.  

All eyes are on Thursday’s CPI report and big bank earnings due out Friday, both of which could have market moving effects in either direction.

Read More

ETFs On The Cutline – UpdatedThrough 01/06/2023

Ulli ETFs on the Cutline Contact

Below, please find the latest High-Volume ETF Cutline report, which shows how far above or below their respective long-term trend lines (39-week SMA) my currently tracked ETFs are positioned.

This report covers the HV ETF Master List from Thursday’s StatSheet and includes 312 High Volume ETFs, defined as those with an average daily volume of more than $5 million, of which currently 179 (last report: 105) are hovering in bullish territory. The yellow line separates those ETFs that are positioned above their trend line (%M/A) from those that have dropped below it.

Take a look:                                                                   

The HV ETF Master Cutline Report

In case you are not familiar with some of the terminology used in the reports, please read the Glossary of Terms. If you missed the original post about the Cutline approach, you can read it here.               

ETF Tracker Newsletter For January 6, 2023

Ulli ETF Tracker Contact

ETF Tracker StatSheet          

You can view the latest version here.

WHEN BAD NEWS IS GOOD NEWS—AGAIN

[Chart courtesy of MarketWatch.com]
  1. Moving the markets

And so, the rollercoaster week has come to an end with the markets seeming to have broken out to the upside—at least for the time being.

The much-awaited December jobs report was interpreted as showing signs that inflation may be cooling, because of the Fed’s hawkish interest rate policy. The economy added 223k jobs, which was better than the expected 200k.

However more importantly, the bad news was that, at least for the working population, wages grew slower than anticipated by increasing only 0.3% on the month vs. 0.4% economists expected. That was good news for Wall Street, and the much-hyped theme that inflation is easing, which means that Fed might be pausing or pivoting soon. Consequently, the rate hike odds plunged.

The major indexes shifted into overdrive, never looked back and ended up closing the session with over 2% gains. ZeroHedge called it a buying panic, and not just in equites but bonds as well, as the 2-year yield crashed in dramatic fashion. The 10-year plunged 33bps, which is its best start to a year on record, Bloomberg posted.

That caused the US Dollar to dump and Gold to spike, with the precious metal gaining +1.7% on the day and closing solidly above its $1,850 level. It has now rallied 15% from its November lows.

While the bullish beast was fed well for the day, the question remains whether this was simply an outlier or the beginning of a new bullish trend. The latter could end in a hurry, should the Fed decide next week to send out some of its minions to public forums reiterating that their hawkish stance has not changed.

Read More

Weekly StatSheet For The ETF Tracker Newsletter – Updated Through 01/05/2023

Ulli ETF StatSheet Contact

ETF Data updated through Thursday, January 5, 2023

Methodology/Use of this StatSheet:

1. From the universe of over 1,800 ETFs, I have selected only those with a trading volume of over $5 million per day (HV ETFs), so that liquidity and a small bid/ask spread are assured.

2. Trend Tracking Indexes (TTIs)

Buy or Sell decisions for Domestic and International ETFs (section 1 and 2), are made based on the respective TTI and its position either above or below its long-term M/A (Moving Average). A crossing of the trend line from below accompanied by some staying power above constitutes a “Buy” signal. Conversely, a clear break below the line constitutes a “Sell” signal. Additionally, I use a 12% trailing stop loss on all positions in these categories to control downside risk.

3. All other investment arenas do not have a TTI and should be traded based on the position of the individual ETF relative to its own respective trend line (%M/A). That’s why those signals are referred to as a “Selective Buy.” In other words, if an ETF crosses its own trendline to the upside, a “Buy” signal is generated. Here too, I recommend trailing sell stop of 12%, or less, depending on your risk tolerance.

If you are unfamiliar with some of the terminology, please see Glossary of Terms and new subscriber information in section 9.     

1. DOMESTIC EQUITY ETFs: BUY — since 12/01/2022

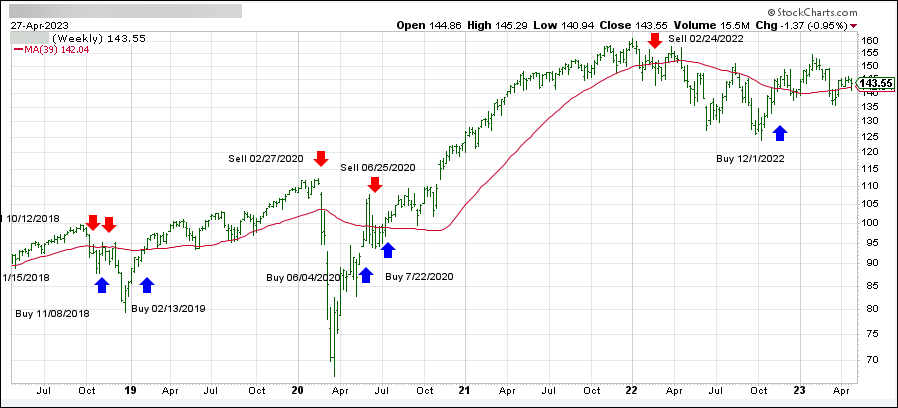
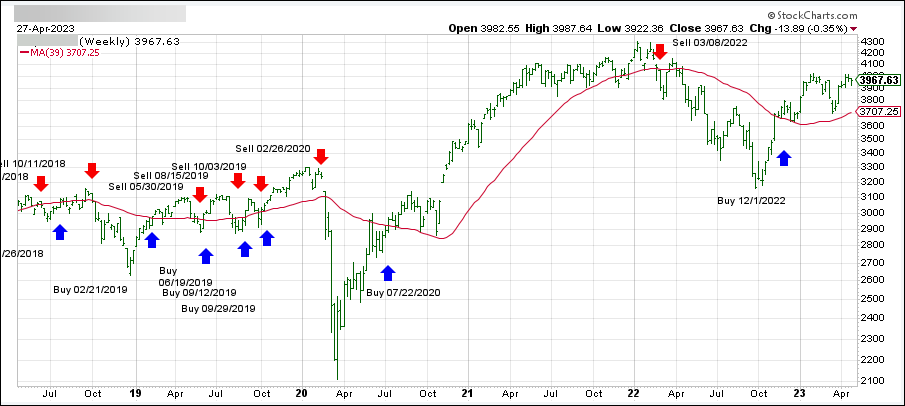
Click on chart to enlarge

Our main directional indicator, the Domestic Trend Tracking Index (TTI-green line in the above chart) has reclaimed its long-term trend line (red) by +0.57% and remains in “Buy” mode for the time being.

Read More