

- Moving the markets
The race to getting nowhere fast continued, as Disney’s earnings showed that subscriber growth was anything but acceptable causing the stock to puke by losing over 8%.
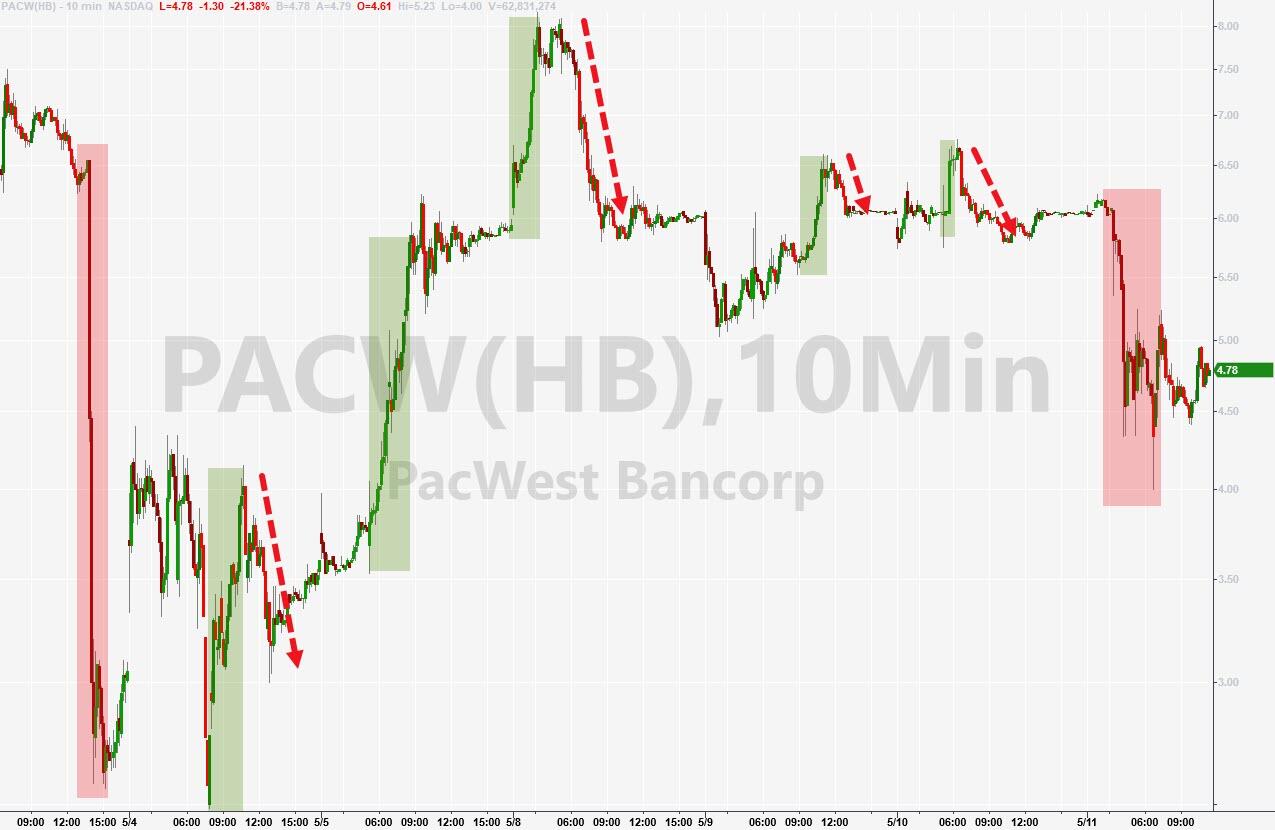
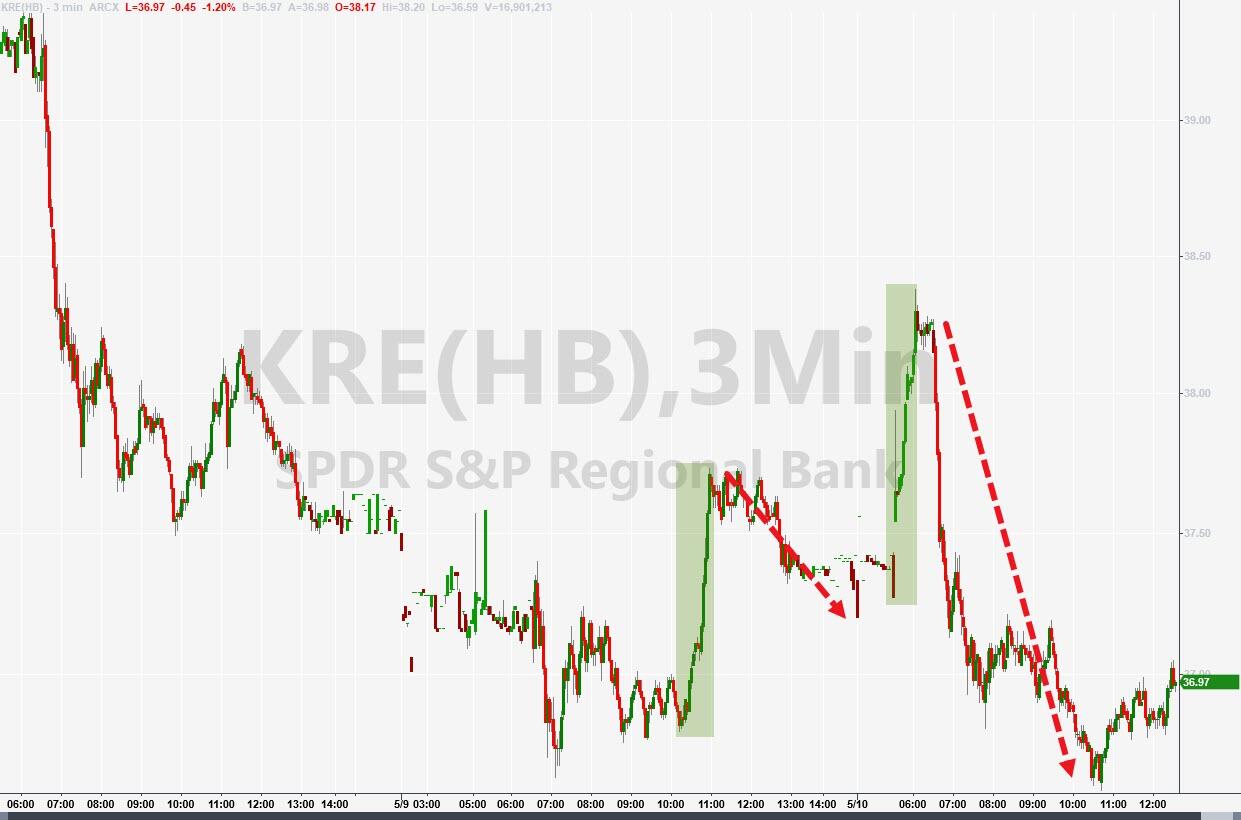
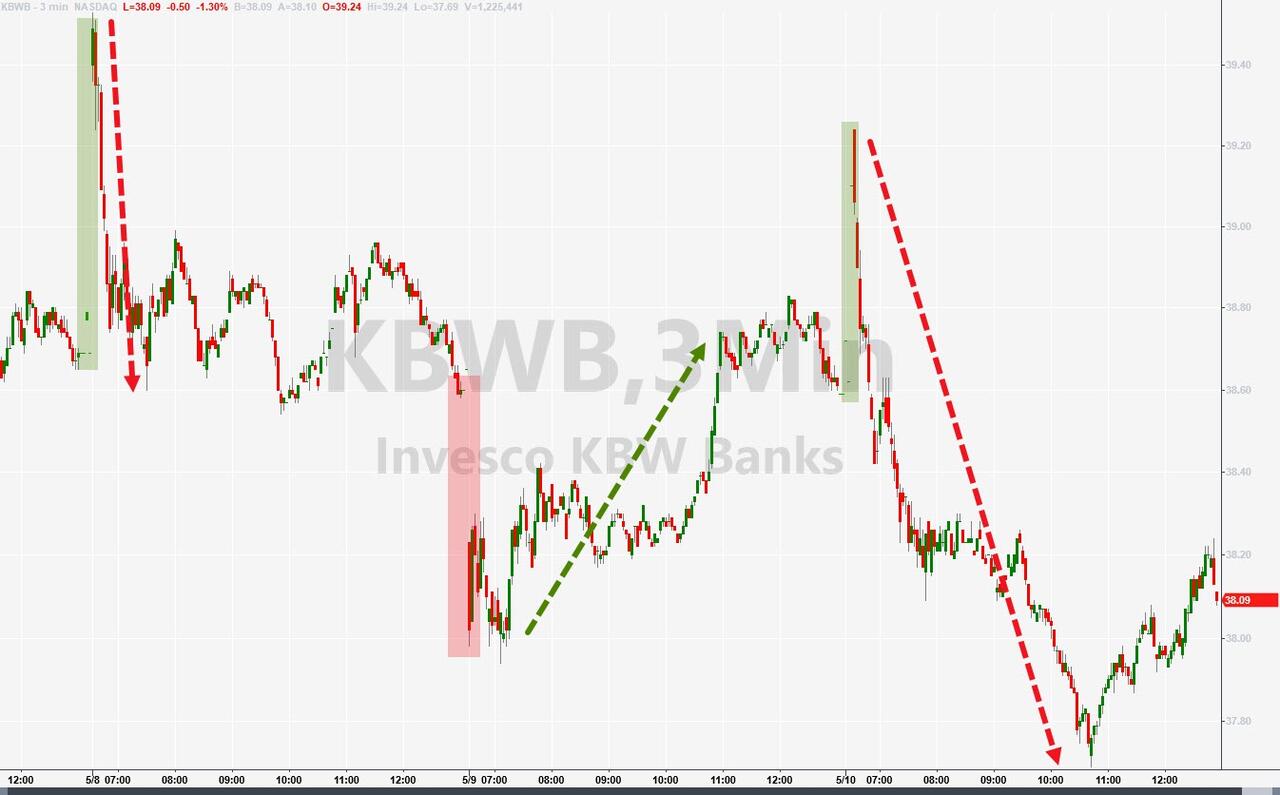
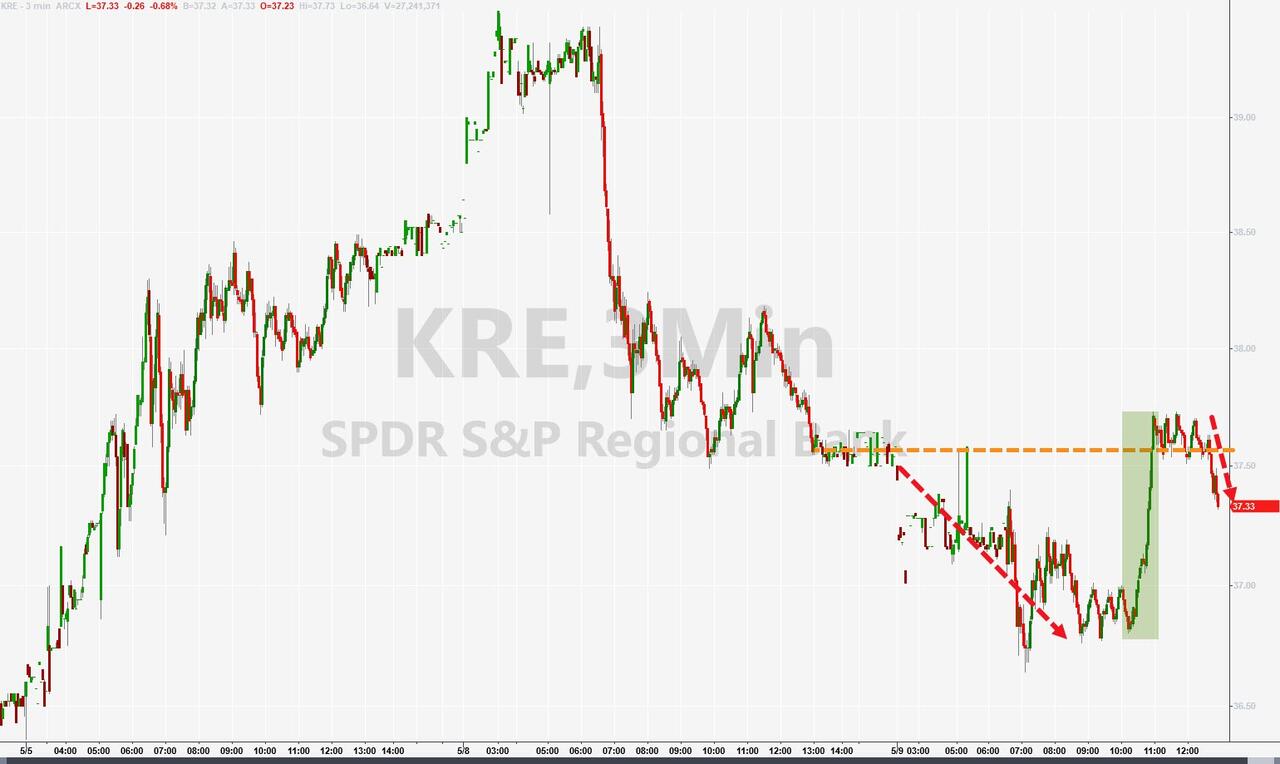
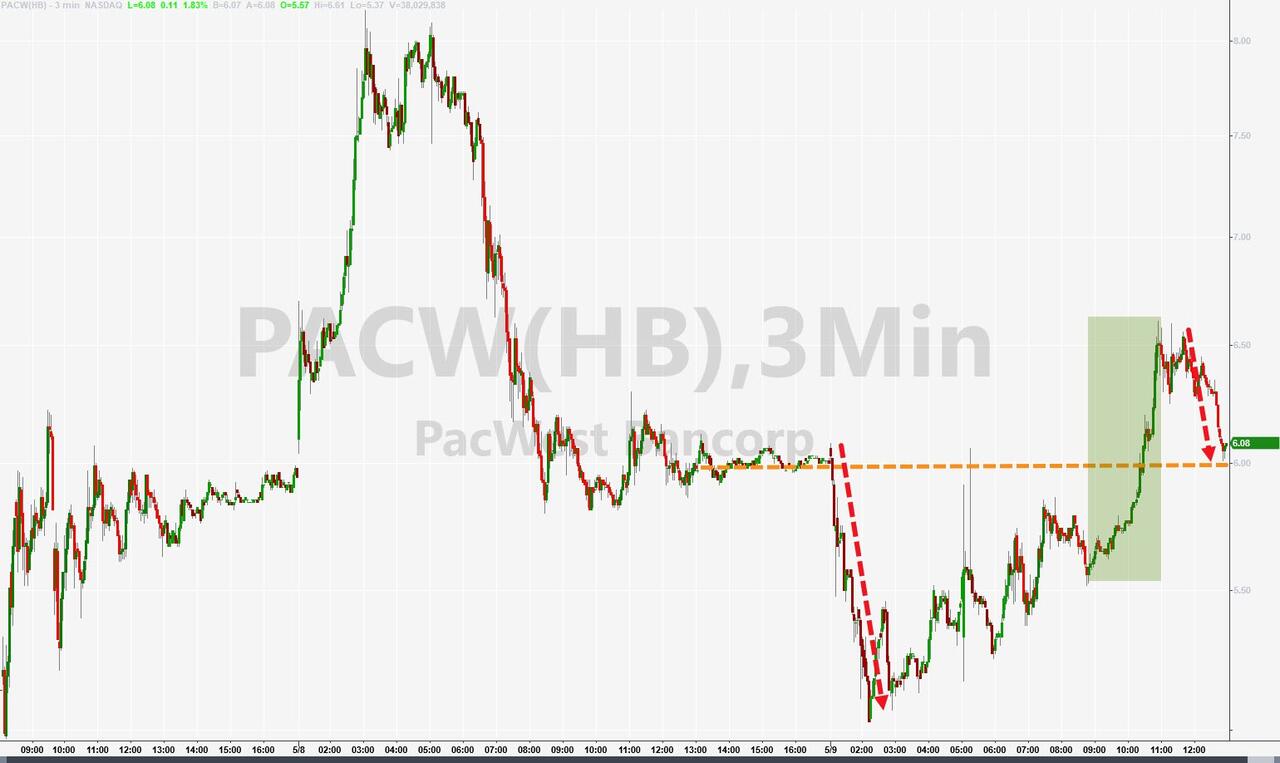
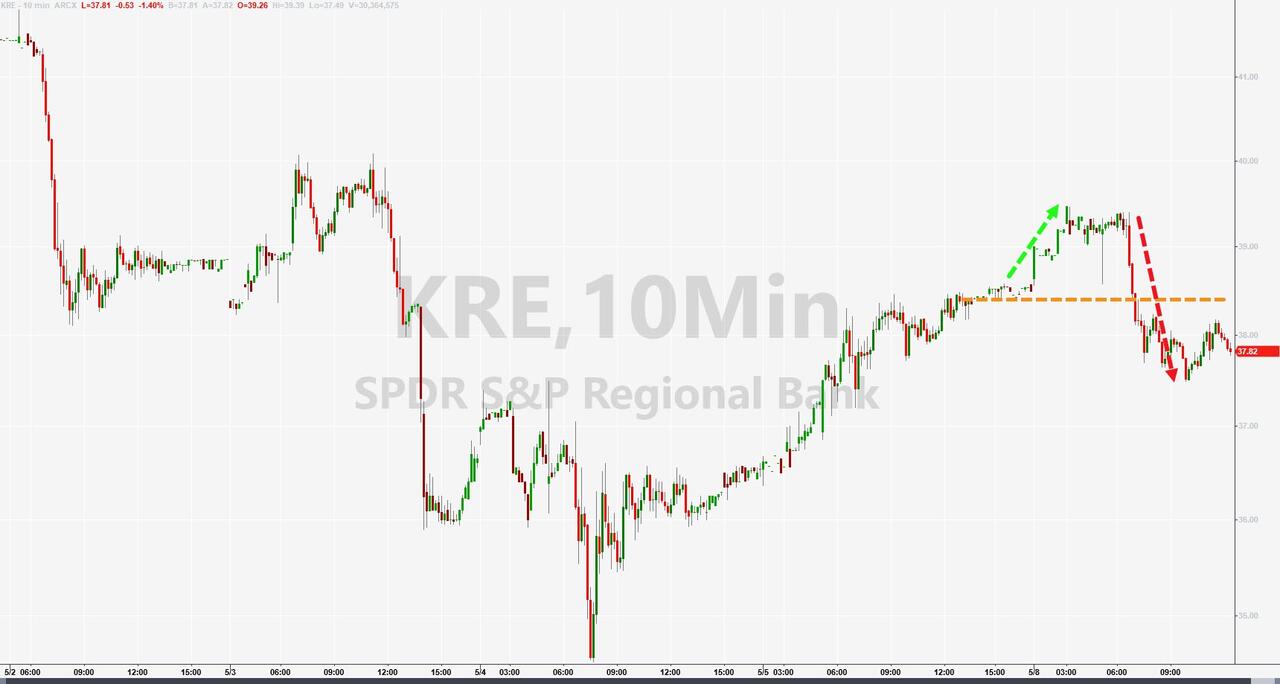
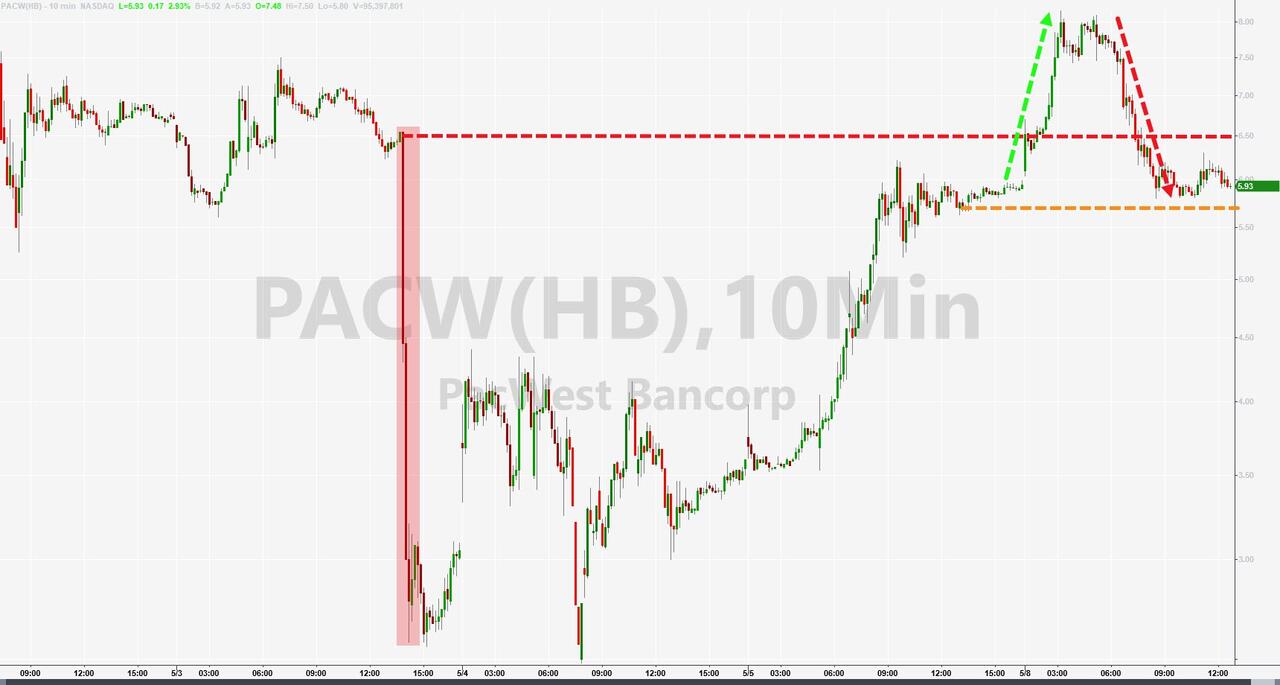
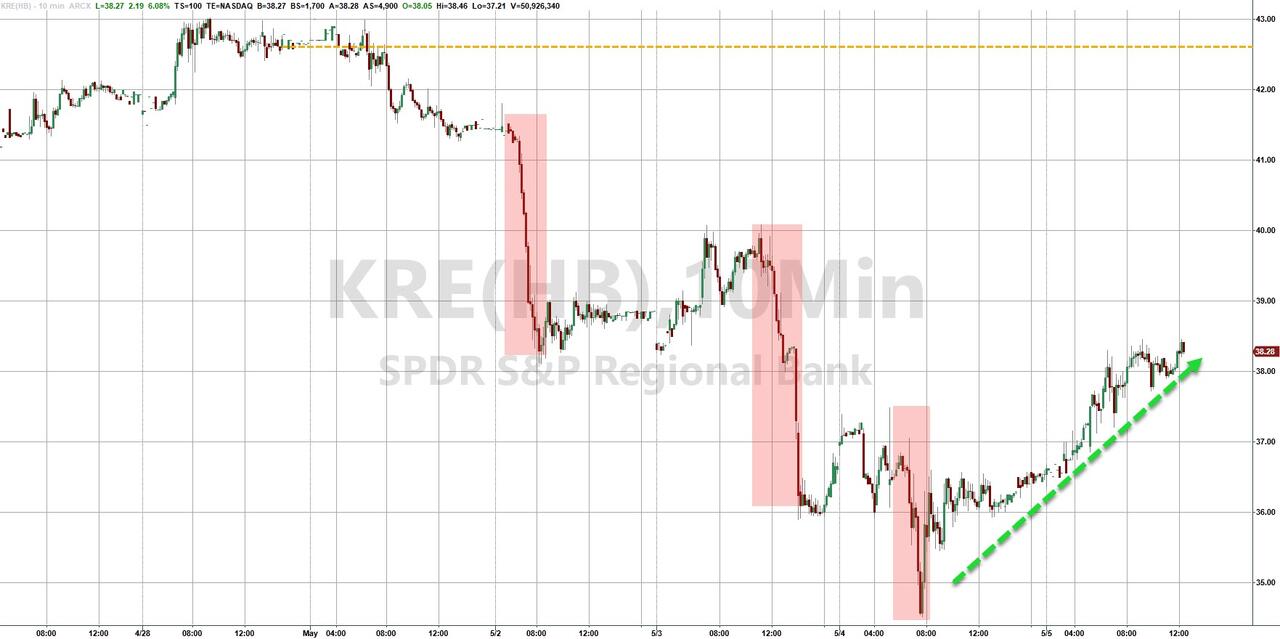
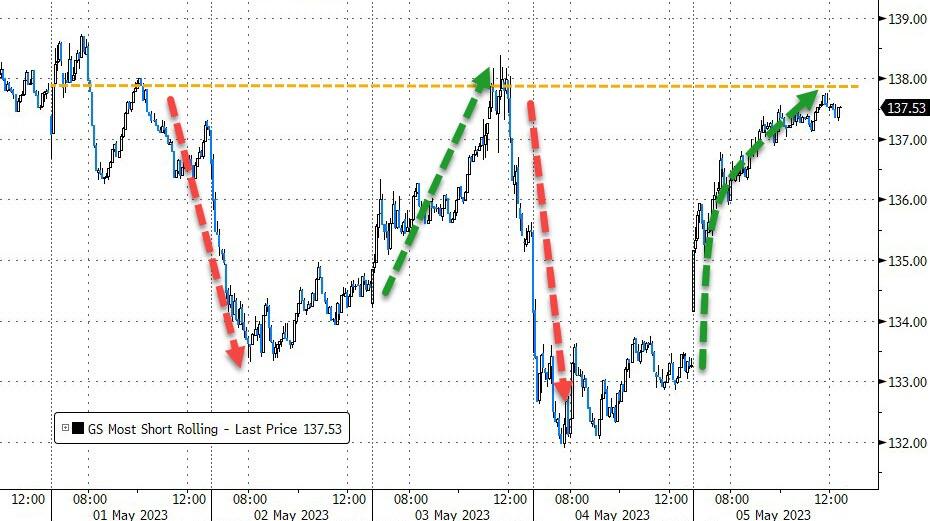
Then it was PacWest which confirmed that the banking troubles are far from being over by acknowledging in a regulatory filing that its deposits fell 9.5% last week. The punishment was quick and harsh, as its stock plummeted another 22%, despite the bank’s assurances that it had $15 million in immediate liquidity available.
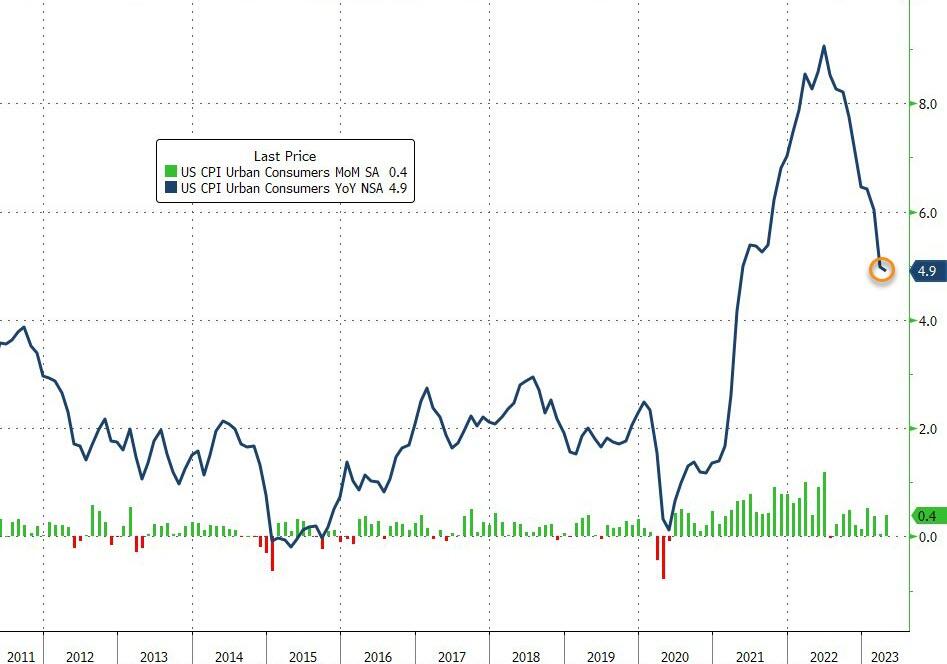
Ah yes, and the much-awaited Producer Price Index (PPI) was almost shoved into the background due to its number not revealing any earthshattering changes. The index increased just 0.2% in April vs. estimates of 0.3%.
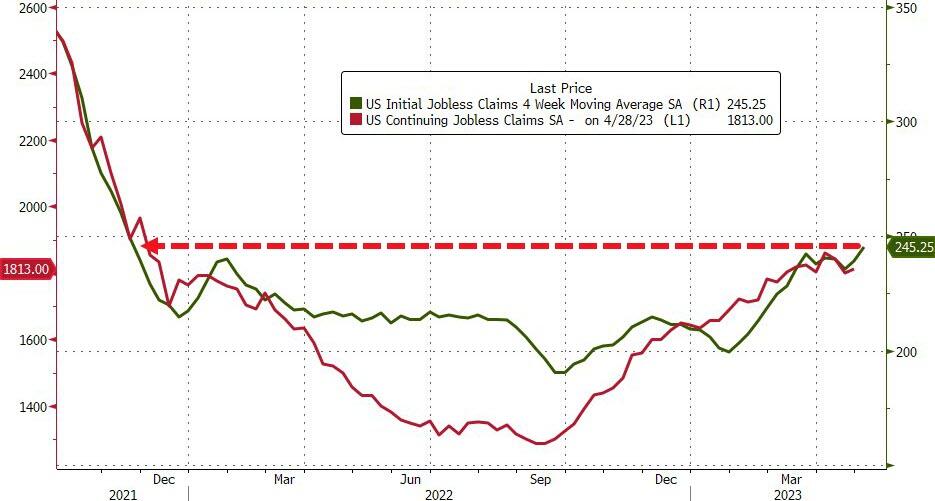
Jobless claims soared unexpectedly, when whopping initial claims of 264k were reported, which was a spike from last week’s 242k and a big miss to expectations of 245k. ZeroHedge added that this was the highest point since October 2021.
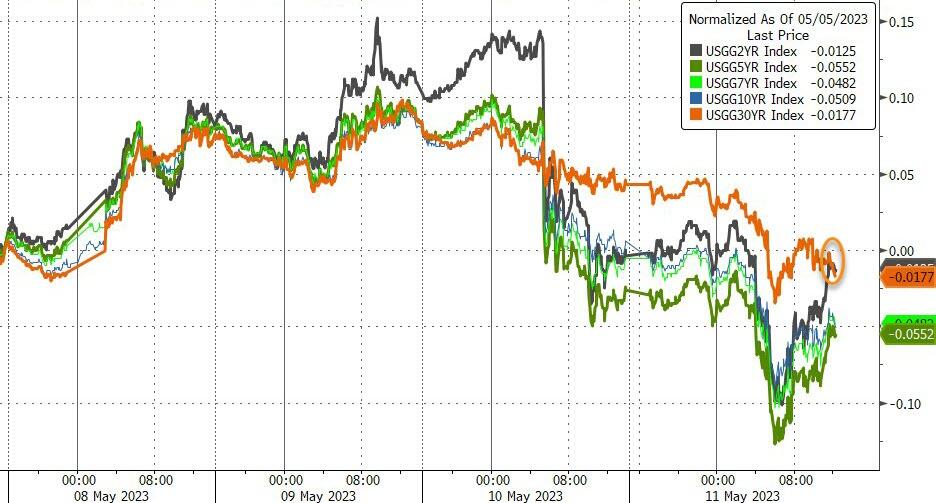
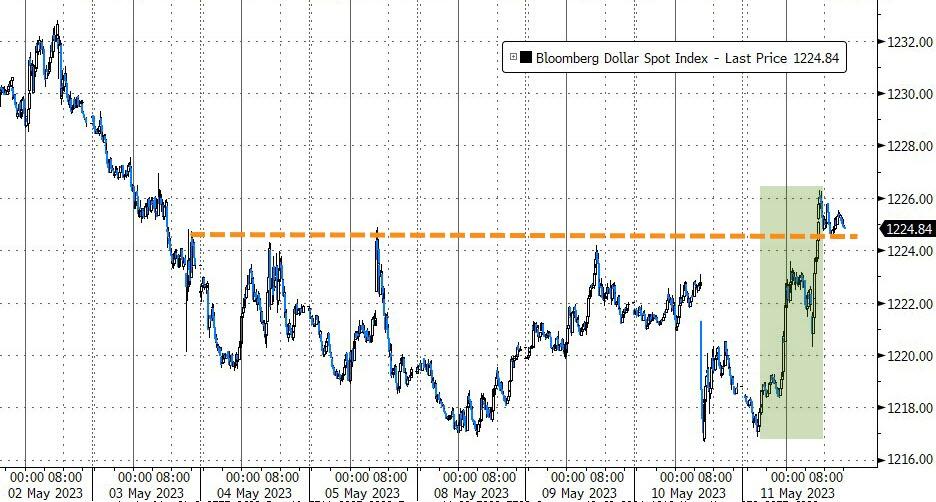
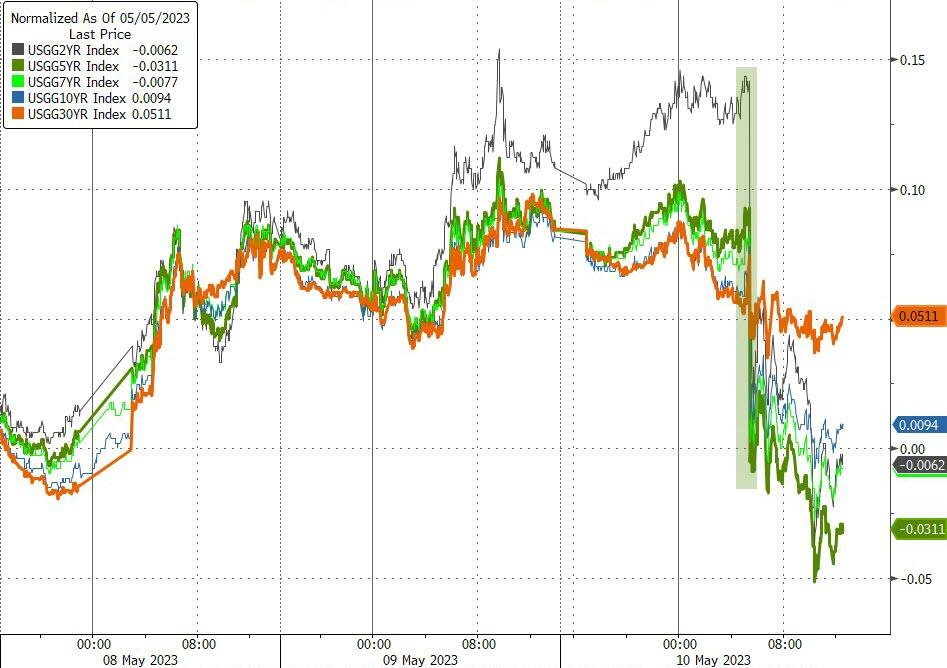
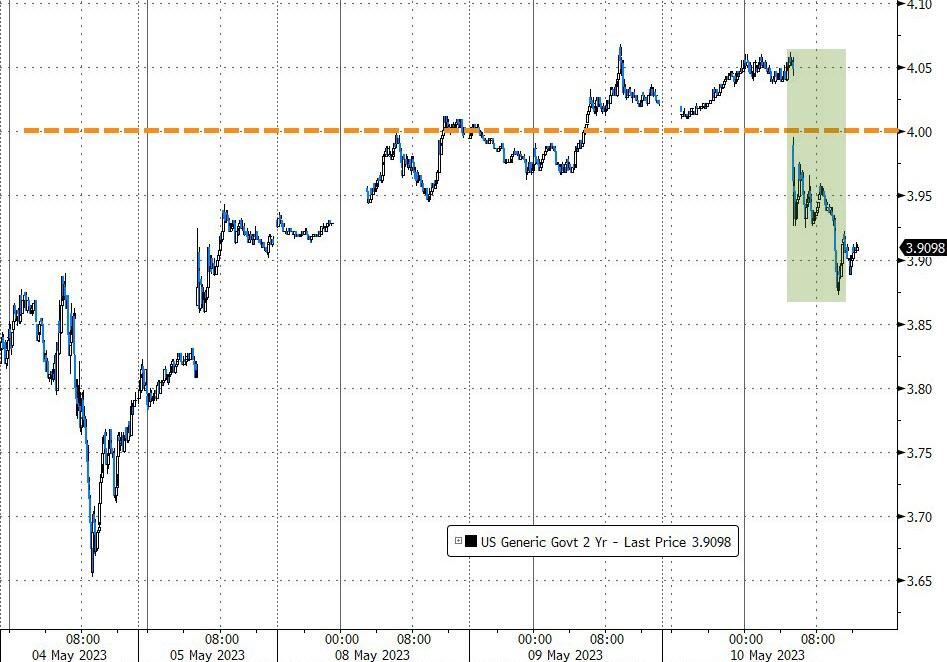
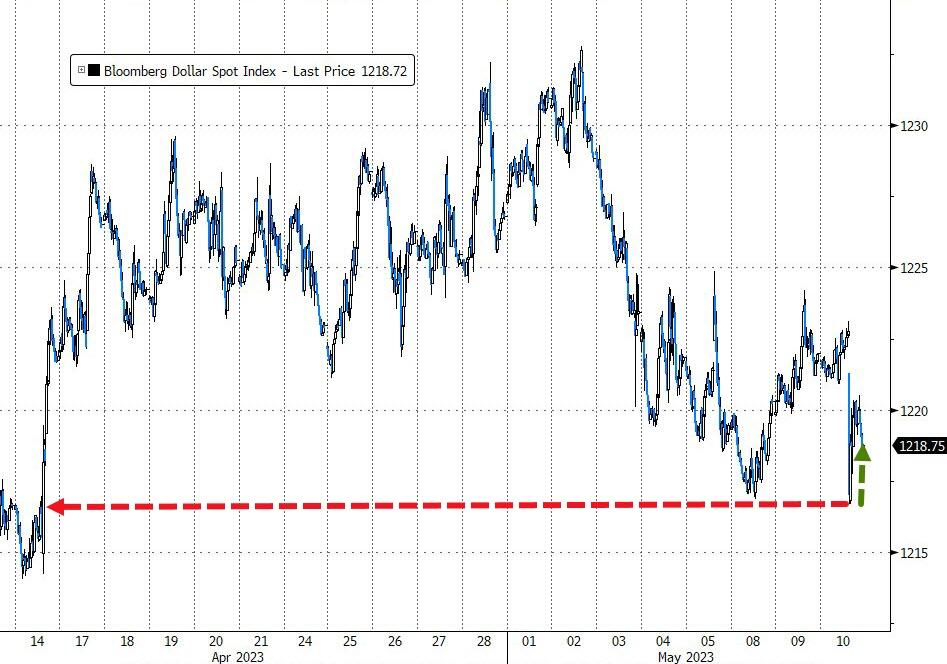
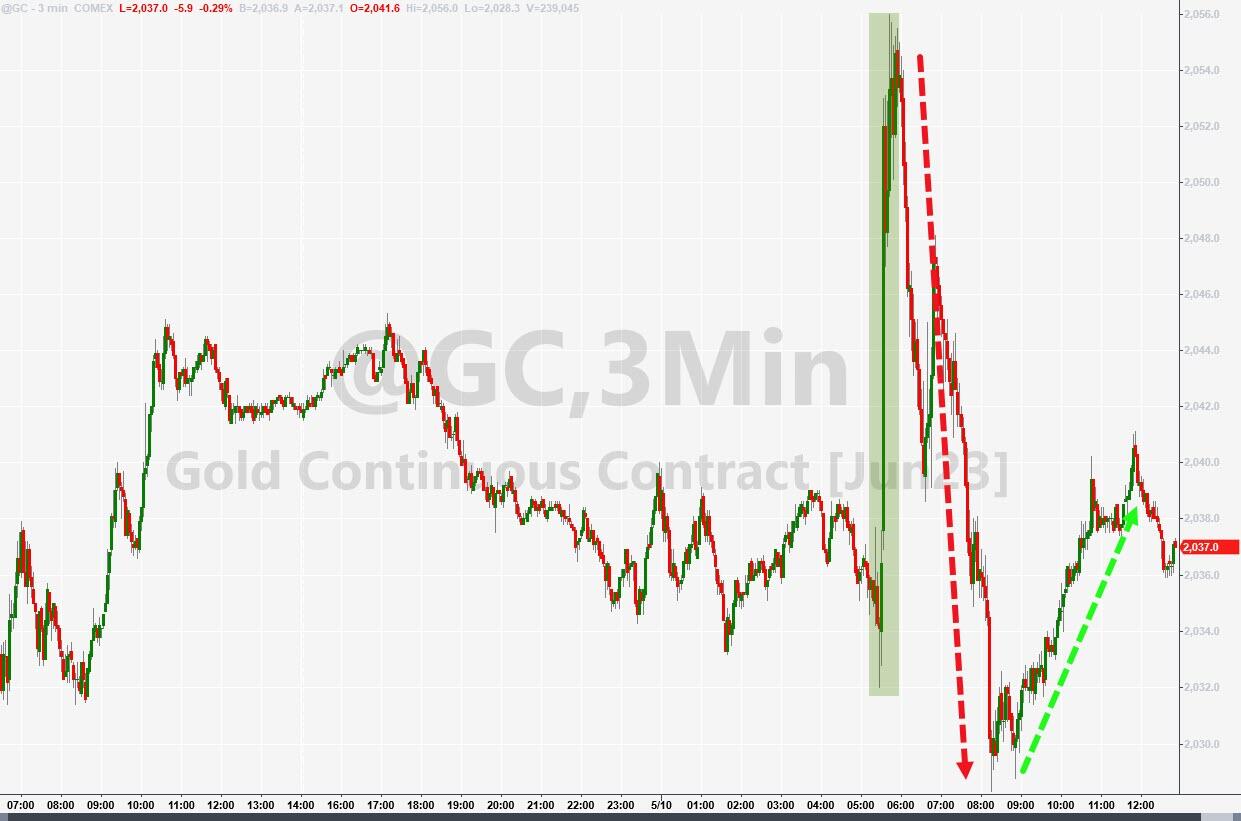
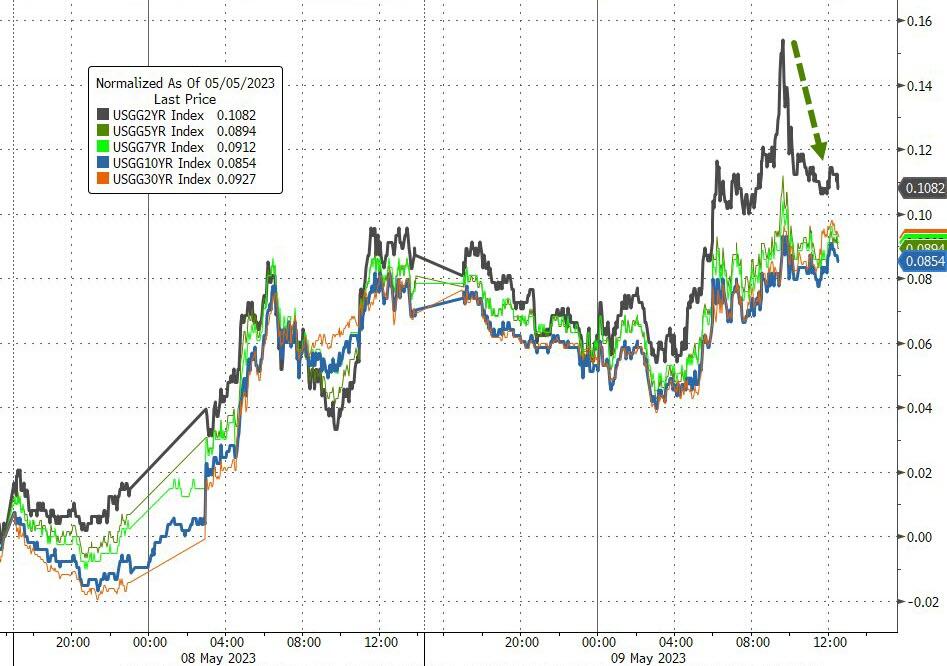
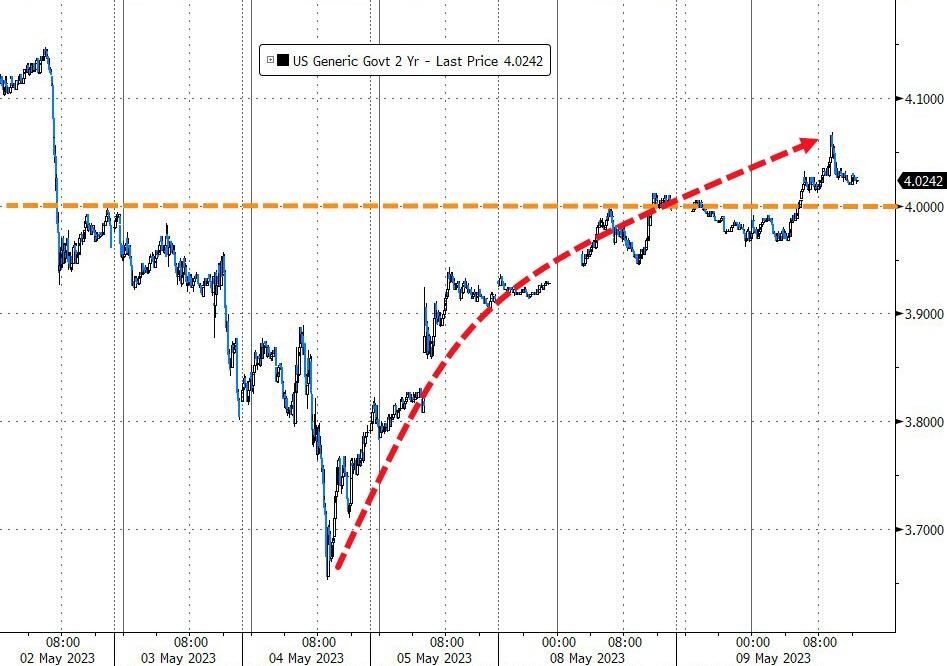
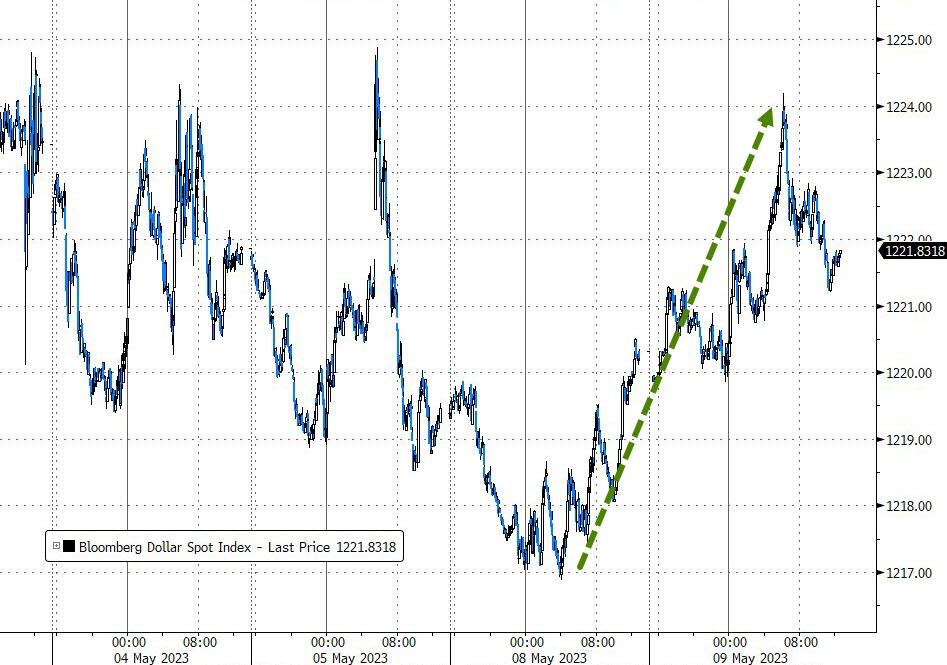
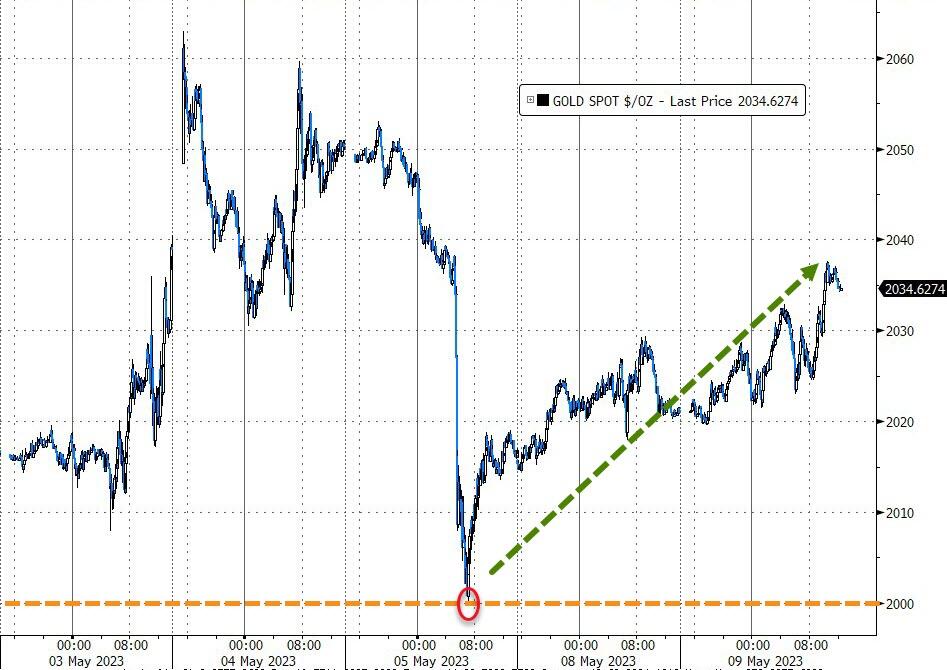
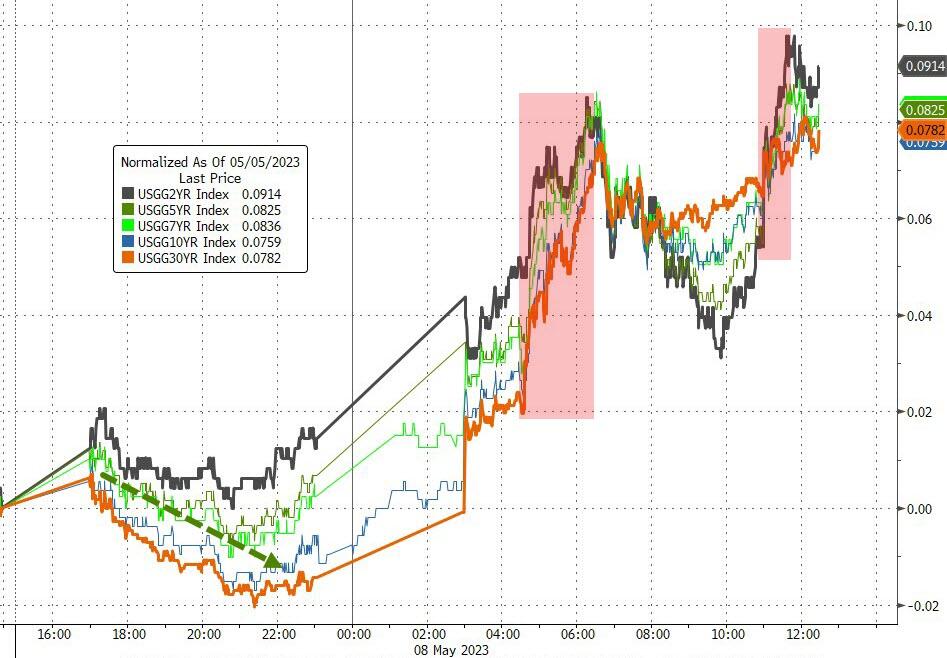
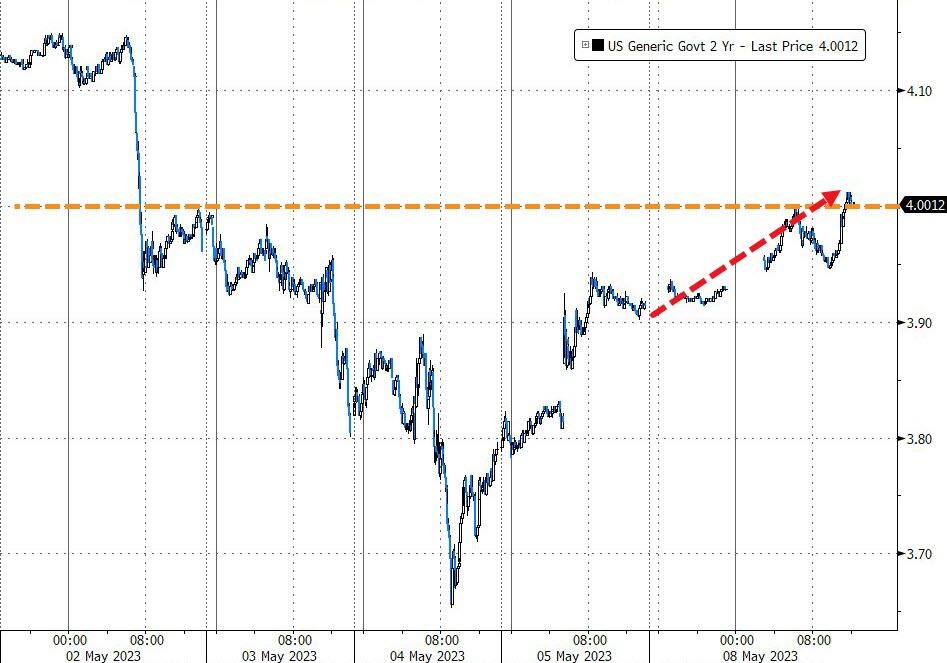
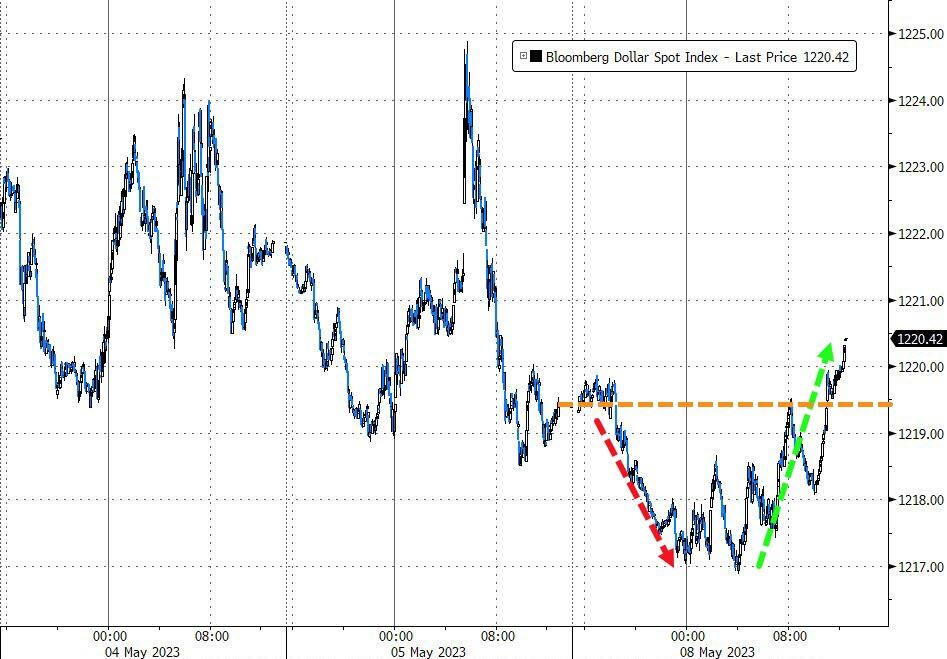
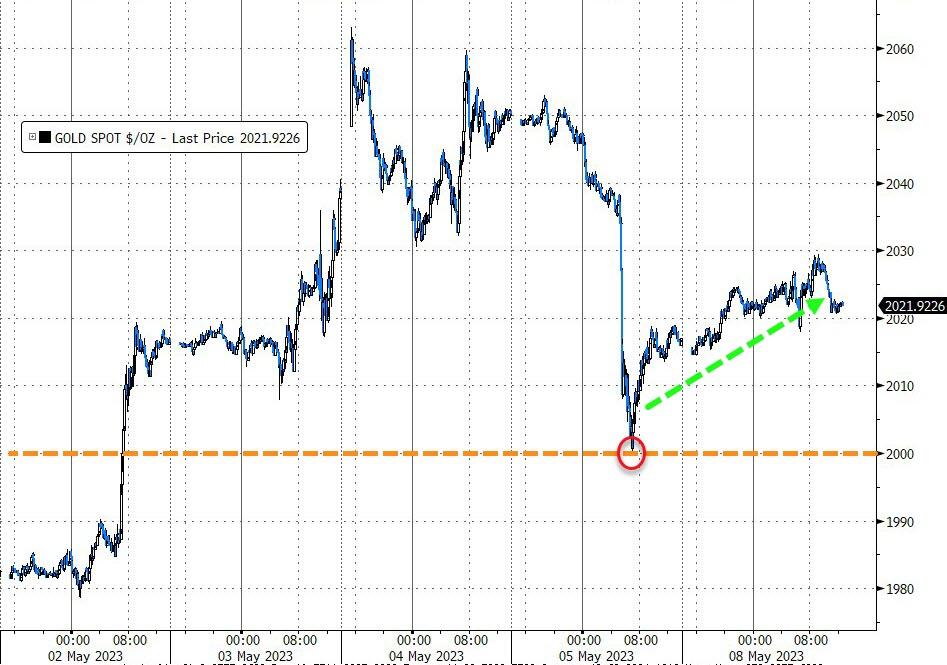
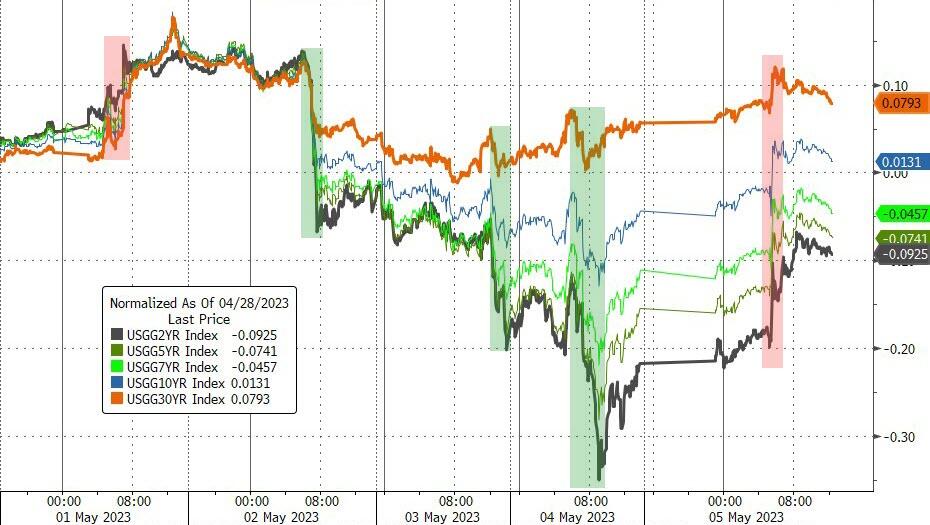
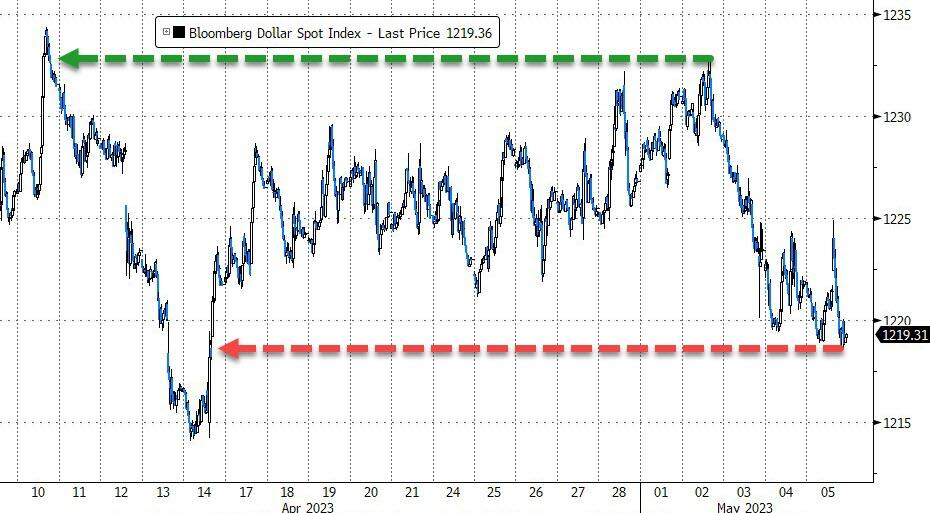
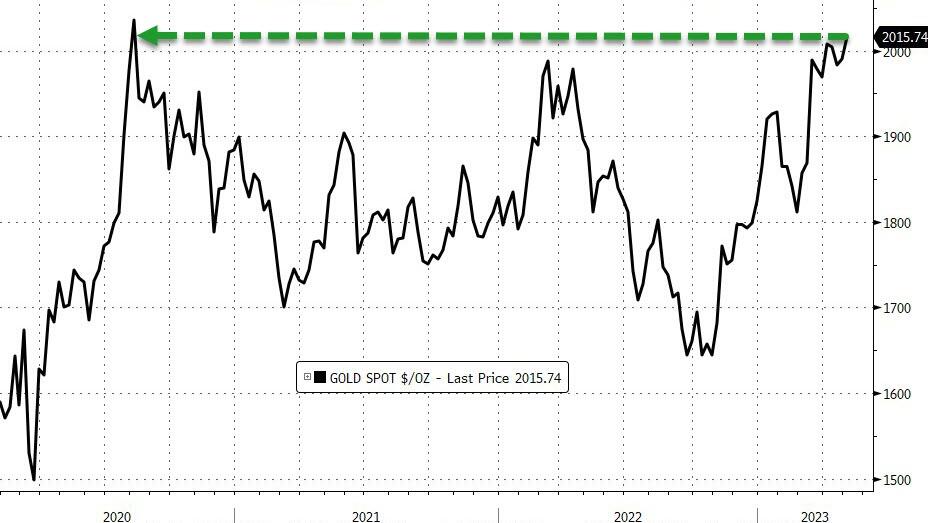
Bond yields continued their journey to lower levels, but the US Dollar decoupled, despite dovish headlines, and rebounded to one-week highs. Gold could not handle that diversion, and, after an initial surge, the precious metal was dumped, despite growing uncertainties with the debt ceiling crisis as well as continued banking problems. Go figure…
Back to the banking crisis. The most relevant question I am being asked in the environment of unsafe banks is this one:
How safe is my money in a brokerage firm, should the situation worsen?
This article explains the differences between the various insurances banks and brokerage firms use to make sure clients’ assets are protected.
Read More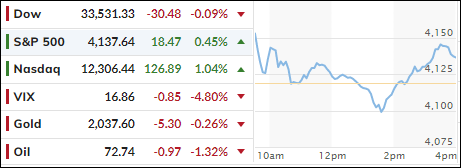