
- Moving the markets
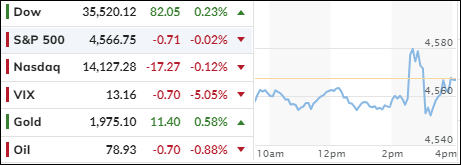
The Fed finally raised the interest rate by 0.25%, as everyone expected. The markets cheered at first, but then realized that the party was over and went back to their gloomy mood. Only the Dow managed to stay positive by a hair.
The problem was that the Fed didn’t sound too confident about its own decision. Powell kept saying that the Fed would “do more” if needed, and that it would watch the data closely before making any more moves.
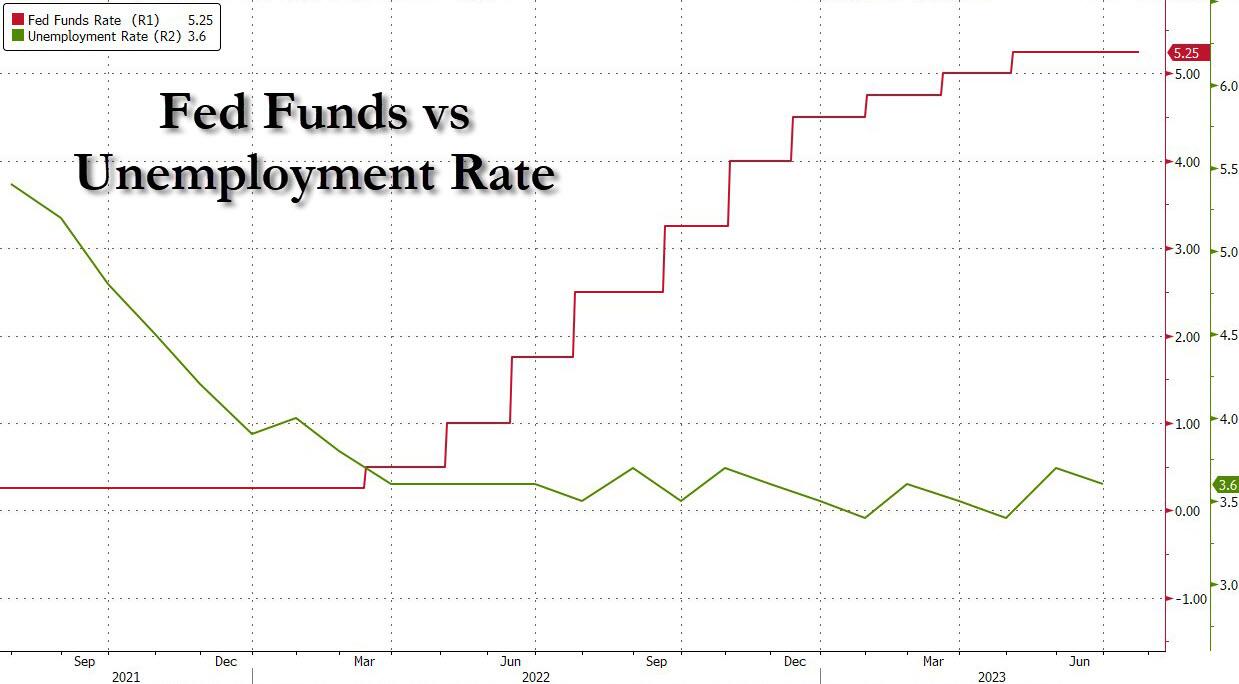
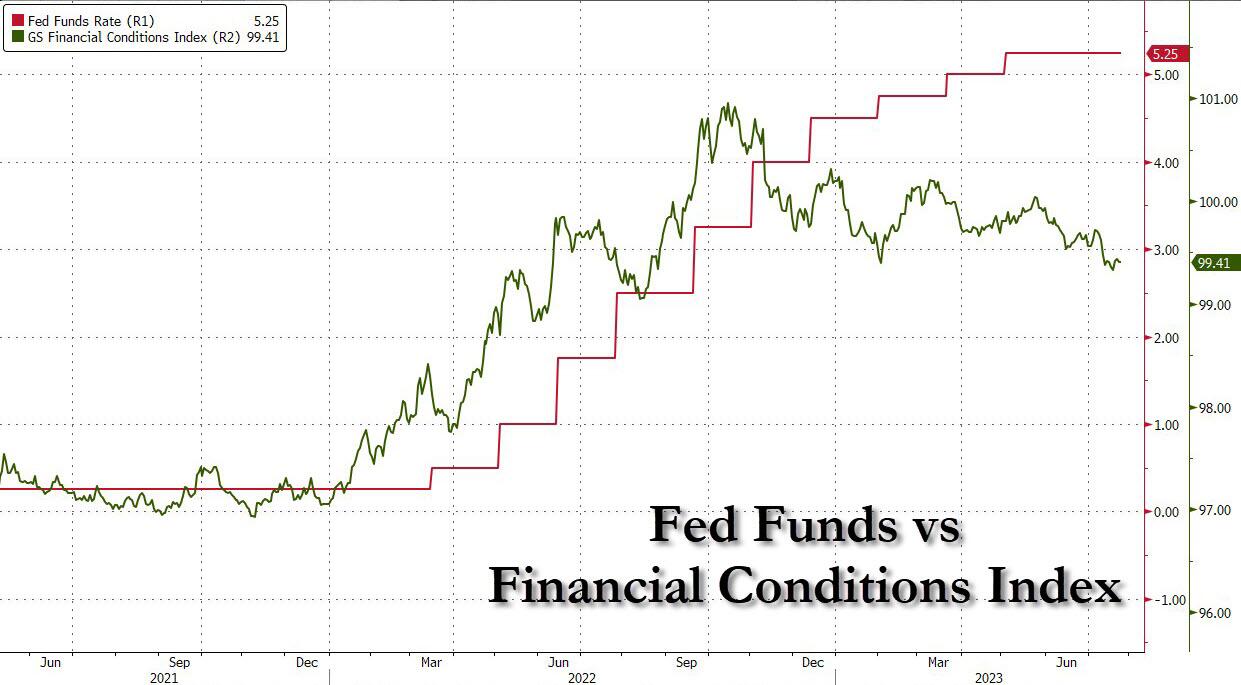
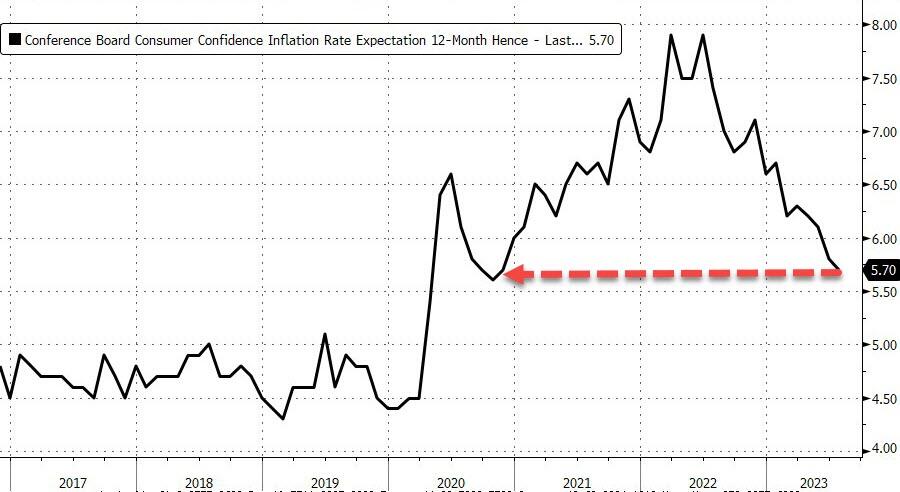
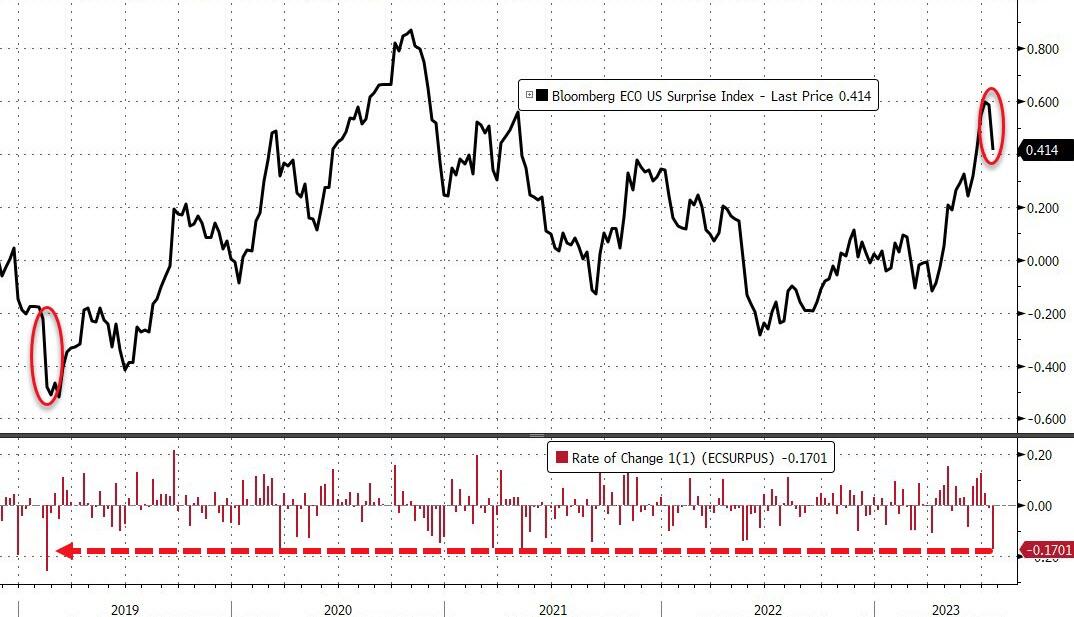
He also hinted that the Fed might have gone too far or too fast with its tightening policy, and that inflation was still nowhere near its 2% target. But the data didn’t really support the Fed’s actions.
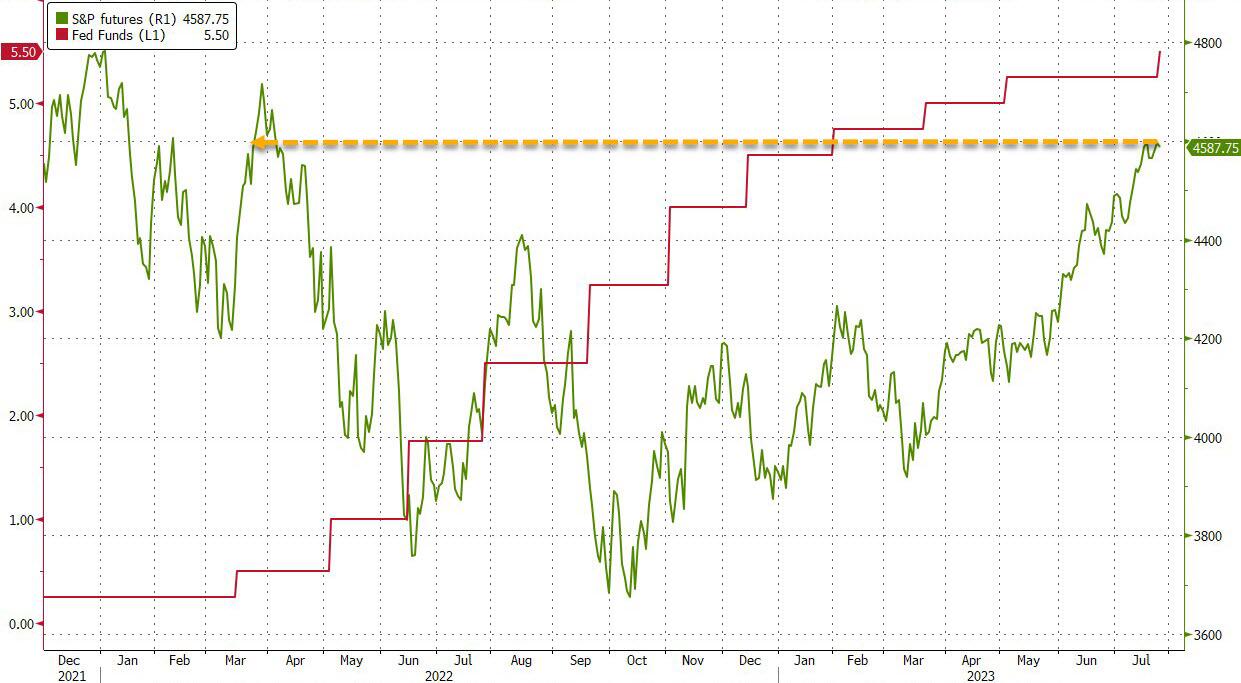
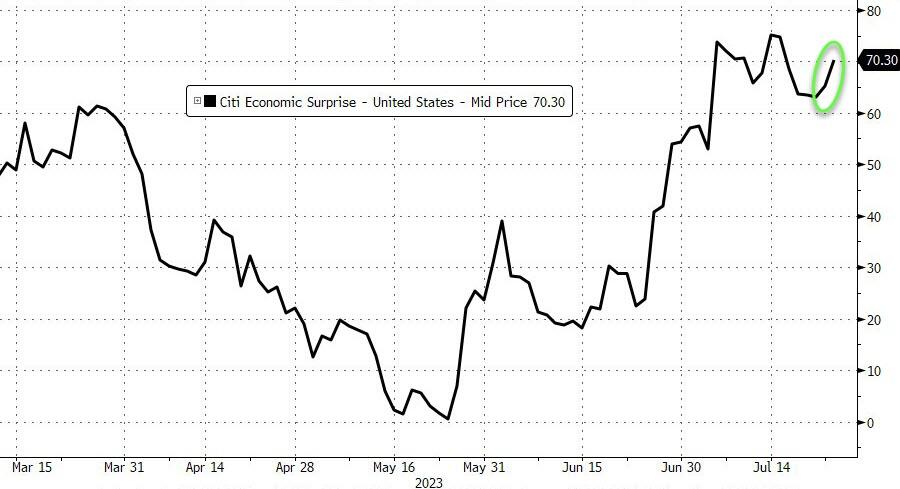
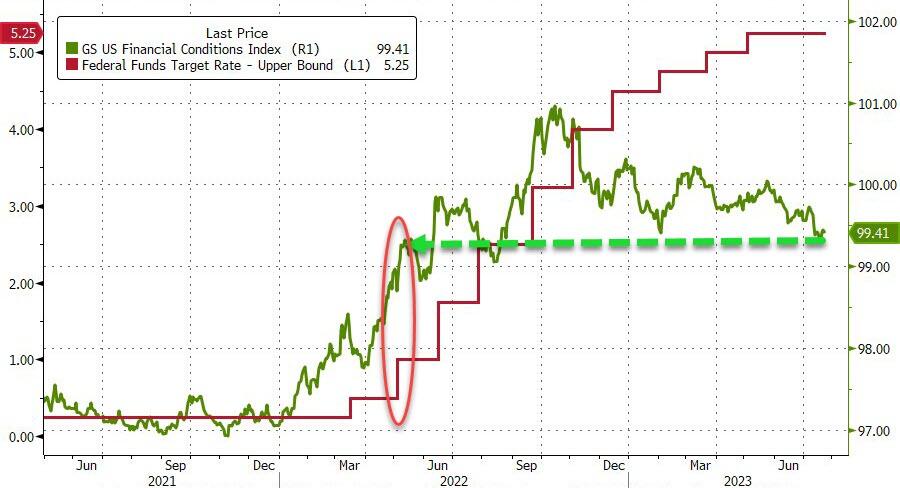
The unemployment rate was the same as it was a year ago, when the Fed started hiking. The financial conditions were easier than they were last fall when the Fed was supposed to be tightening. And the S&P 500 was back to where it was when the whole thing began.
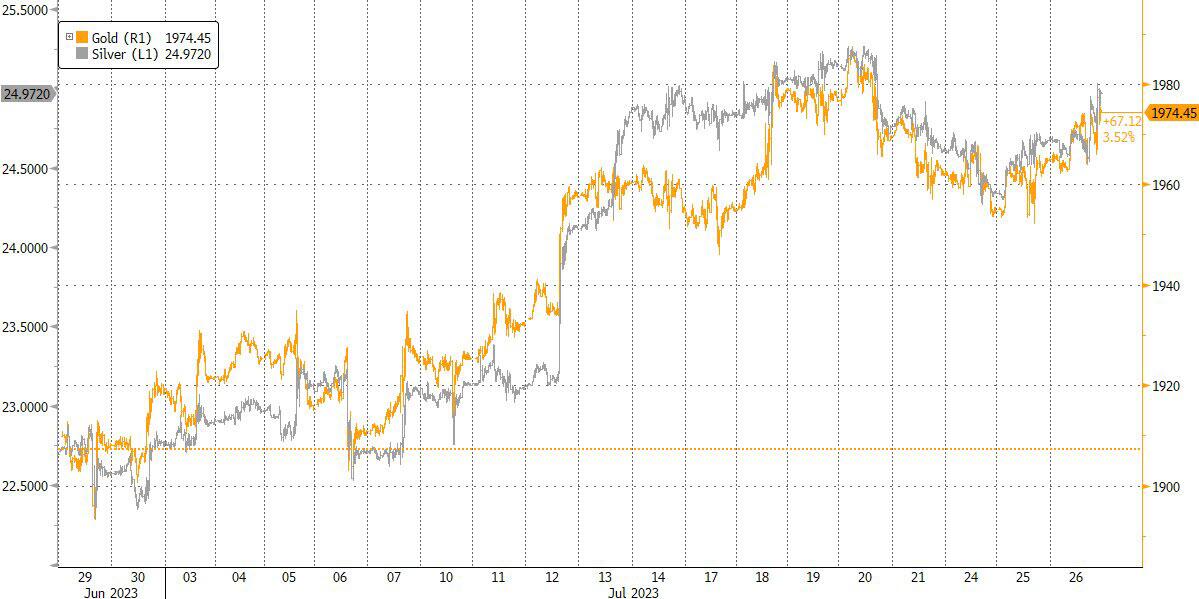
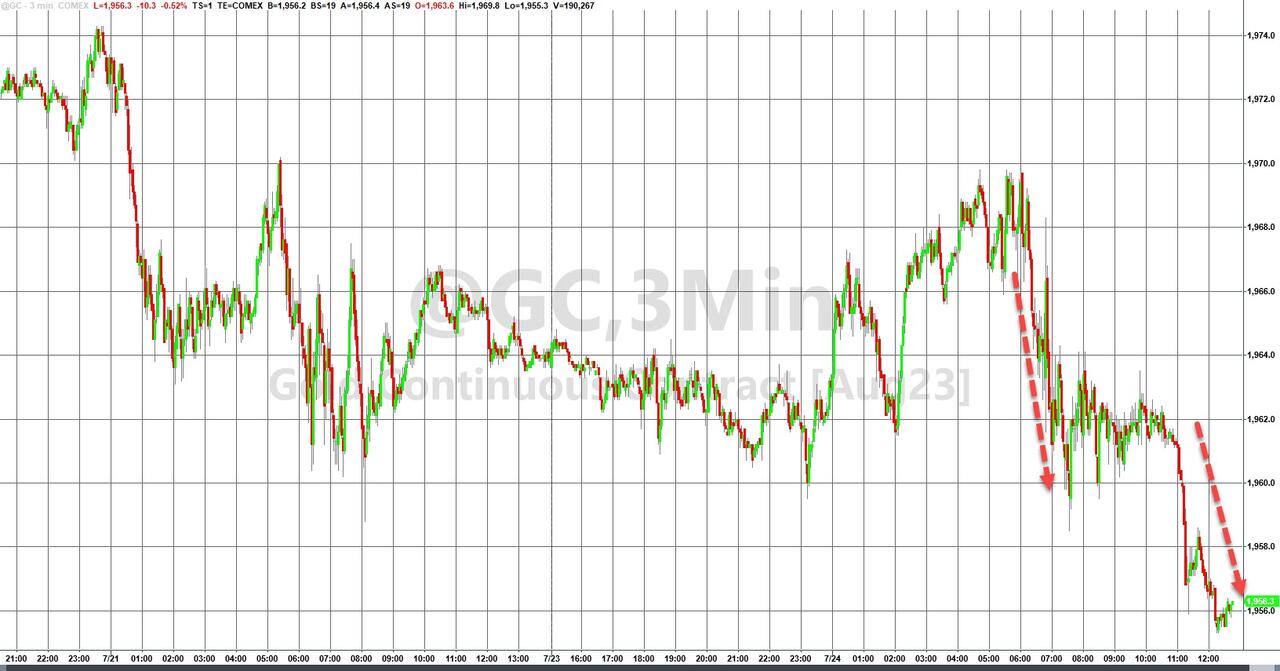
So, what did the Fed achieve? Nothing much, except pushing commodity prices higher, which was not what it wanted. Powell tried to cover all his bases with these statements:
• *POWELL: FOMC TO TAKE DATA-DEPENDENT APPROACH ON FUTURE HIKES
• *POWELL: WILL CONTINUE TO MAKE DECISIONS MEETING BY MEETING
• *POWELL: POSSIBLE WE’D RAISE OR HOLD IN SEPT. IF DATA WARRANTED
• *POWELL: AS STANCE IS MORE RESTRICTIVE, INCREASINGLY FACE RISK
• *POWELL: POLICY NOT RESTRICTIVE ENOUGH FOR LONG ENOUGH
• *POWELL: IDEA OF HIKING RATES UNTIL INF. AT 2% IS WAY PAST TARGET
• *POWELL: DON’T SEE INFLATION BACK AT 2% UNTIL ABOUT 2025
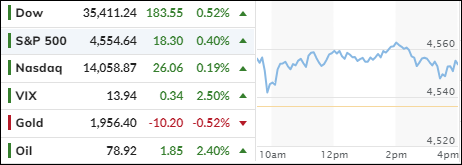
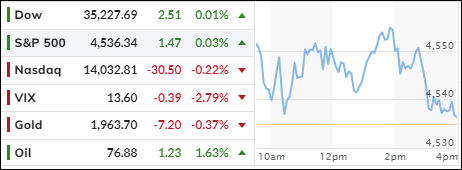
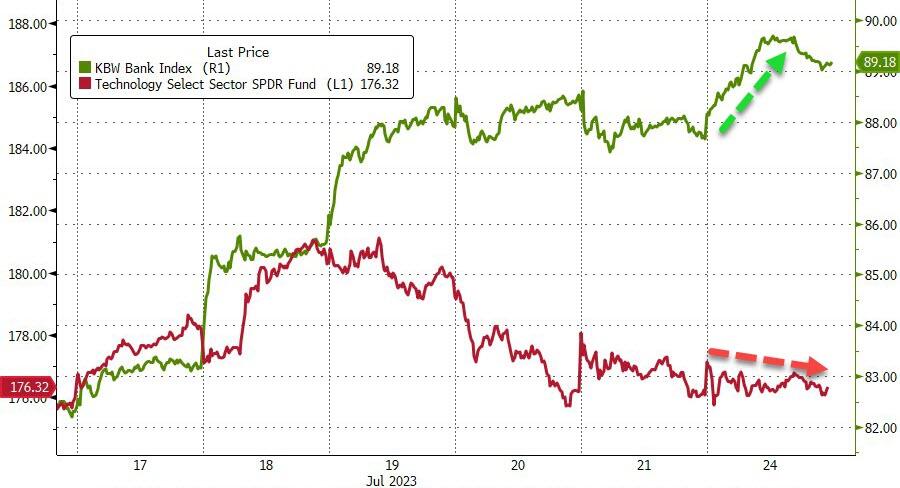
But the markets were not impressed. They saw through his bluff and shrugged off his words. The day ended with little change in most indexes, except for Google and Microsoft, which moved in opposite directions after reporting their earnings.
Google beat expectations and soared 5.8%, while Microsoft disappointed with slower cloud growth and fell 3.7%.
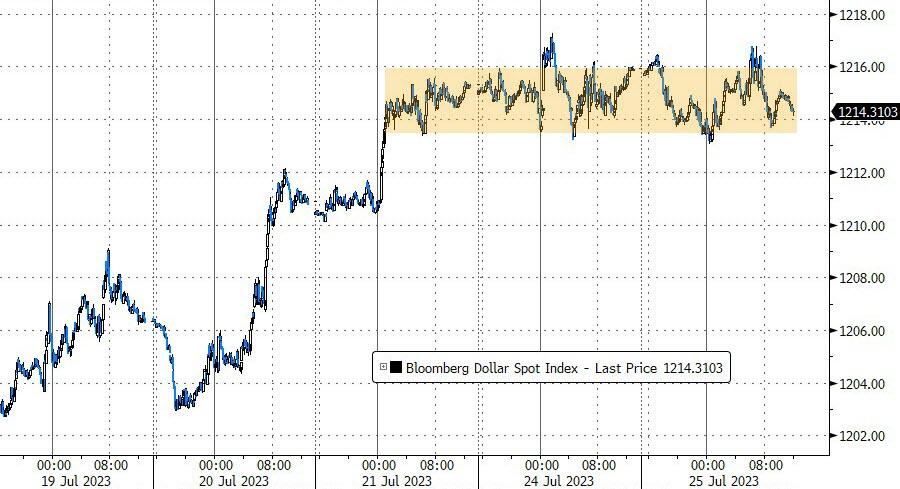
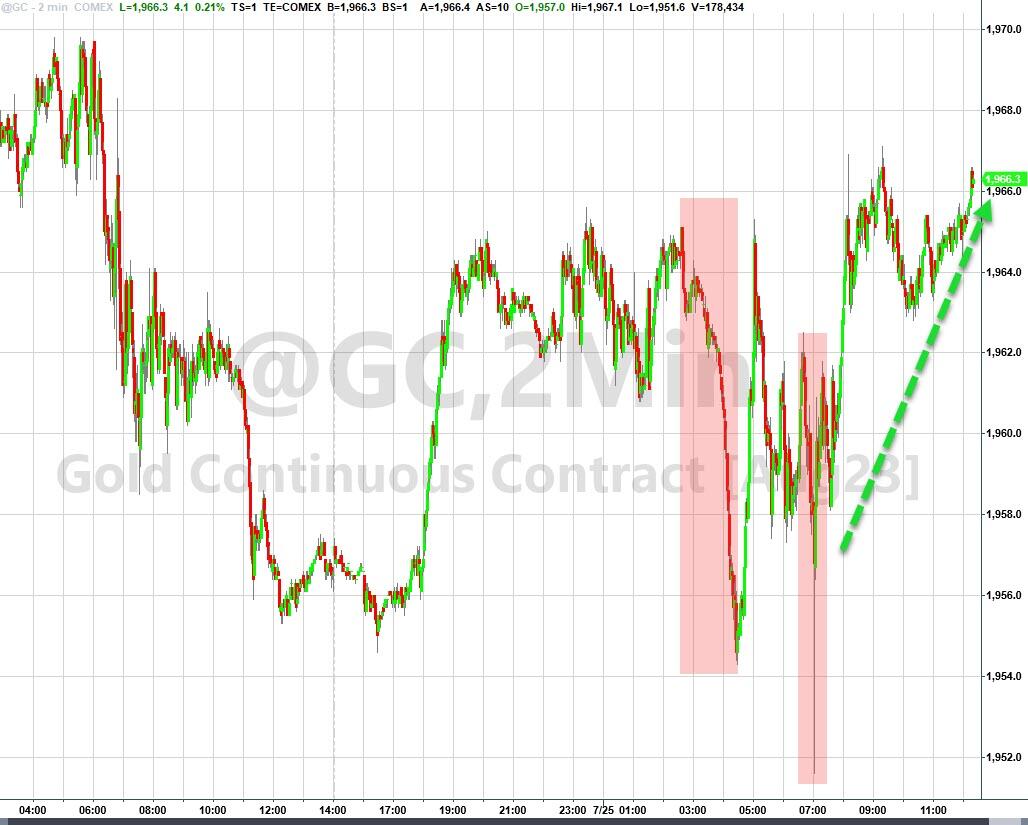
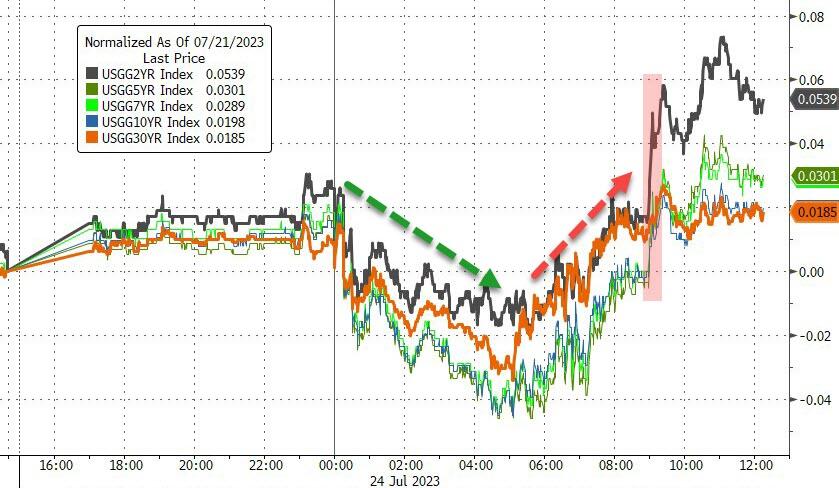
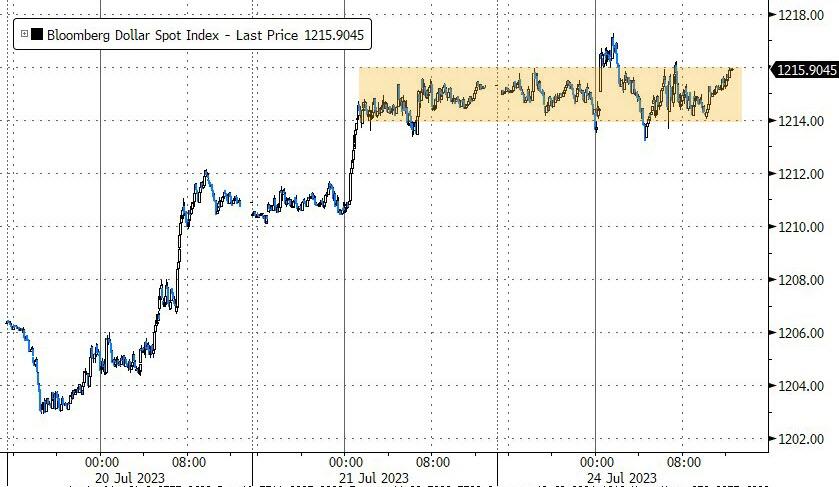
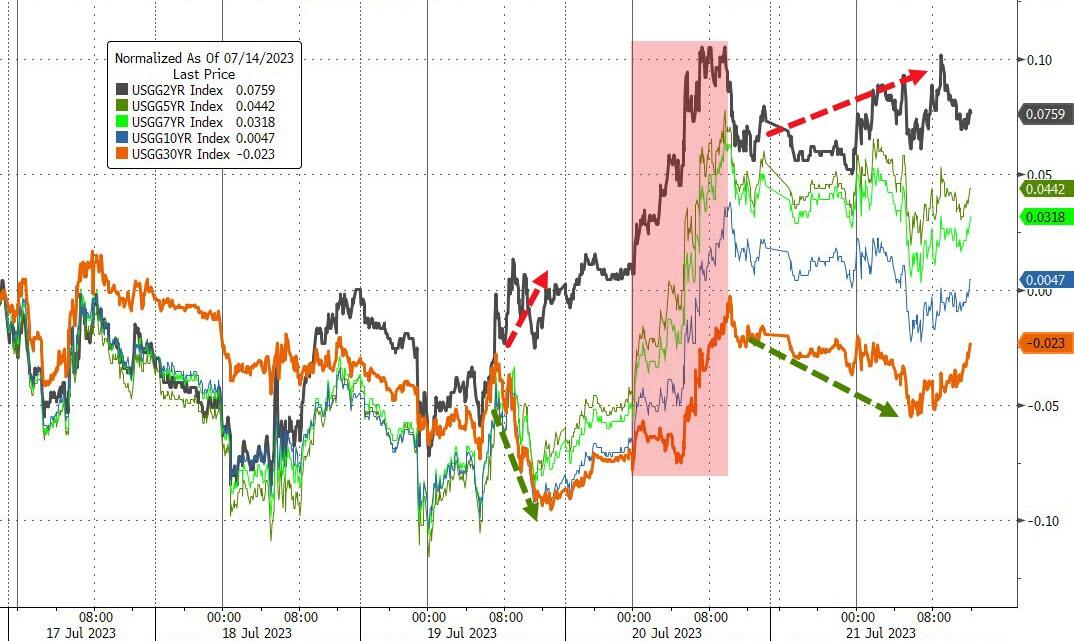
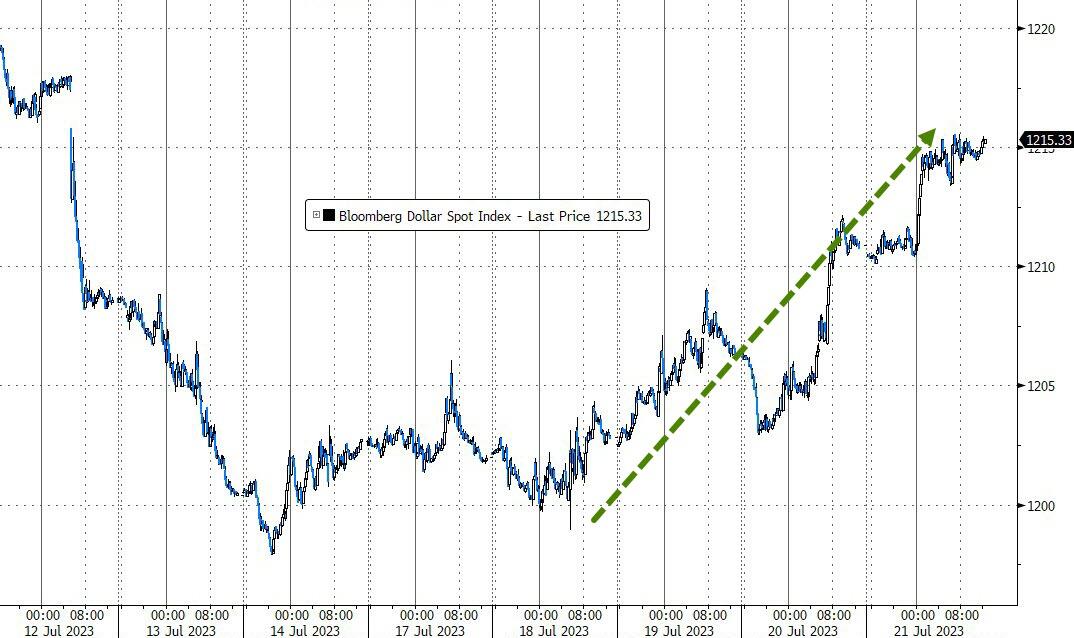
The 10-year bond yield and the dollar both dipped slightly, giving a boost to precious metals.
Meanwhile, billionaire Thomas Peterffy had a different view from Wall Street:
“The market should be much lower. US soft landing is wishful thinking.”
Maybe he knows something we don’t?
Read More

