
ETF Tracker StatSheet
You can view the latest version here.
THE FED VS NVIDIA: WHO WILL WIN THE MARKET BATTLE?
- Moving the markets
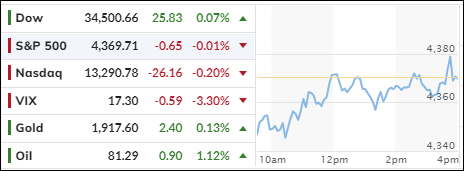
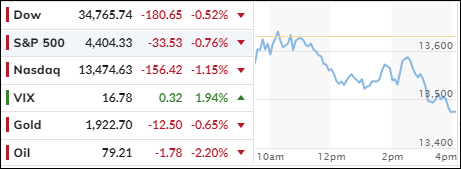
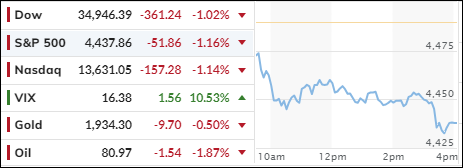
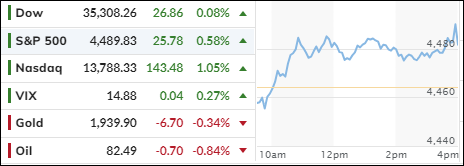
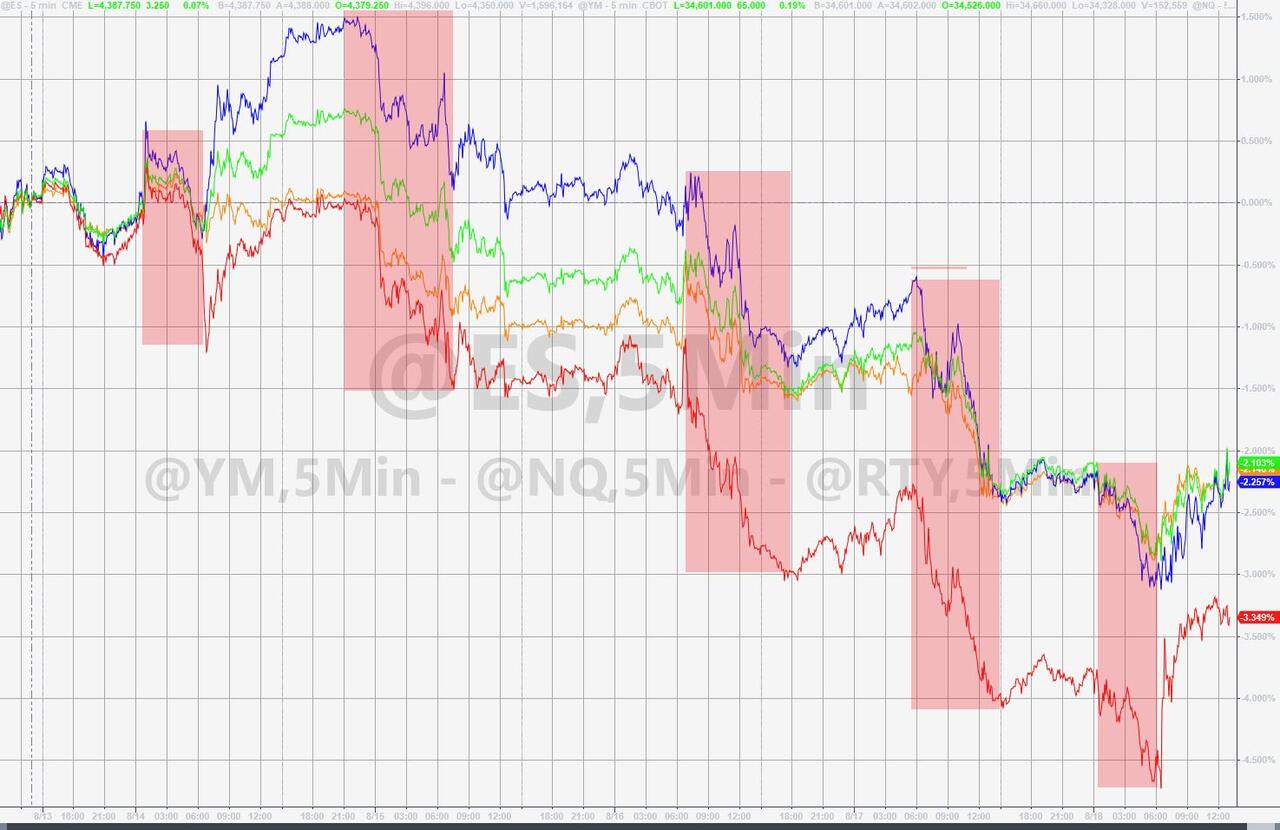
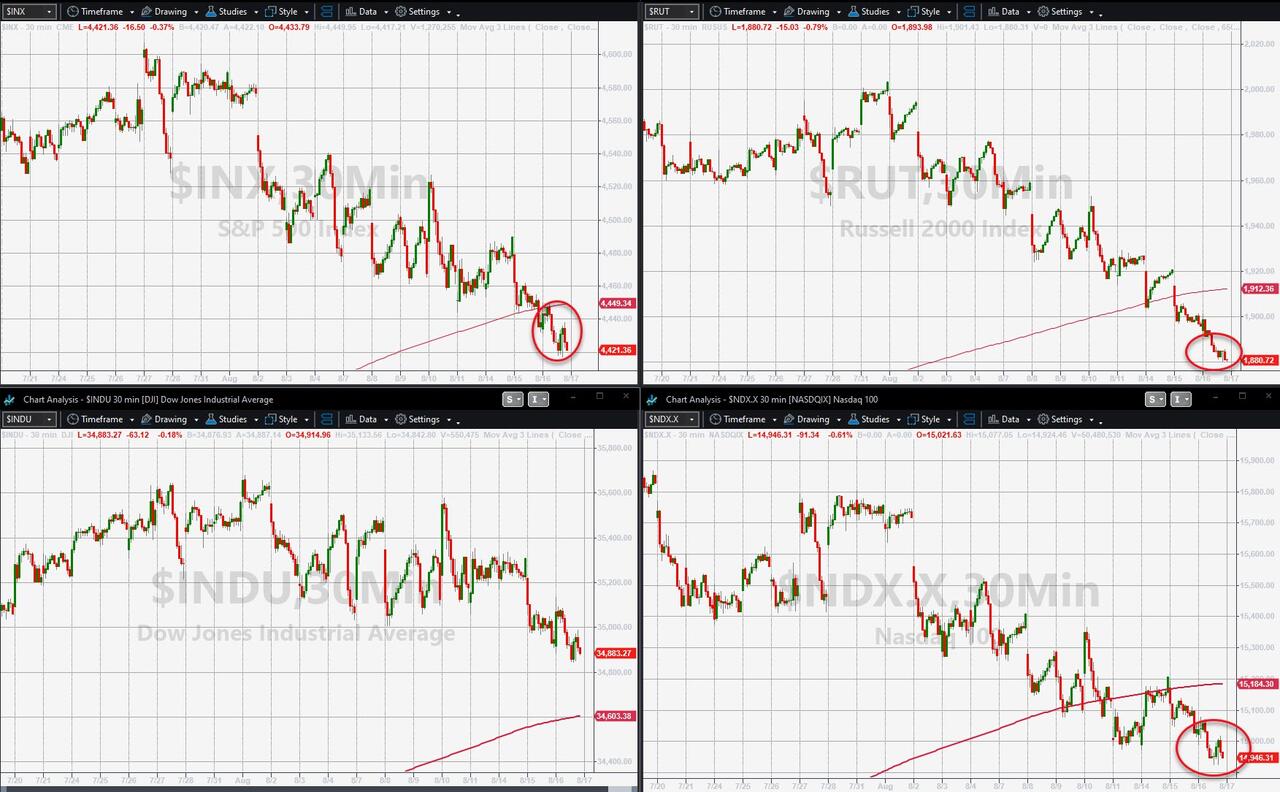
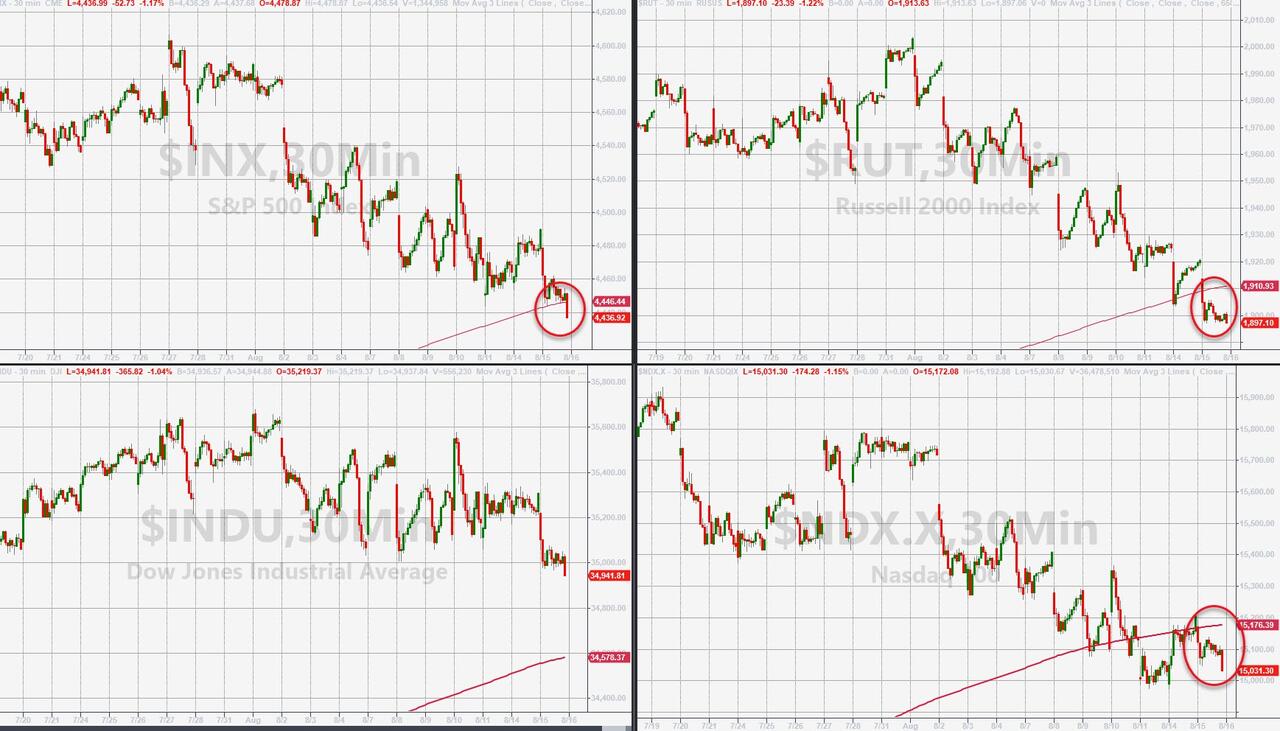
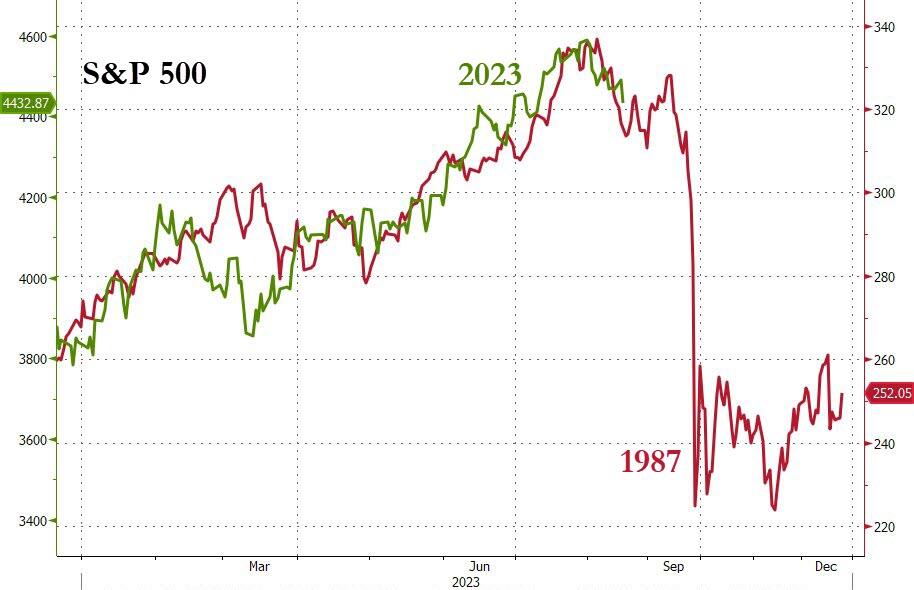
It was a boring day on Wall Street, as the major indexes barely moved from their opening levels. They started the day in the red, but slowly crawled out of their holes like zombies. Options expirations did not make things more exciting, but they may have helped the indexes to break even, as August continues to be a tough month for stocks.
The week was not much better, as the Dow had its worst performance since March, the S&P lost ground for the third week in a row, which has not happened since February, and the Nasdaq joined the losing streak for the first time since December.
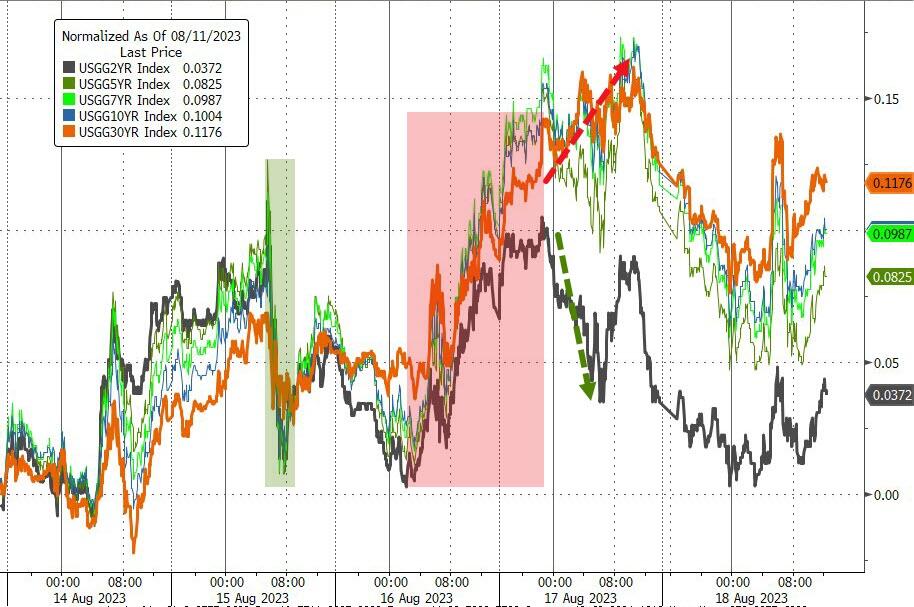
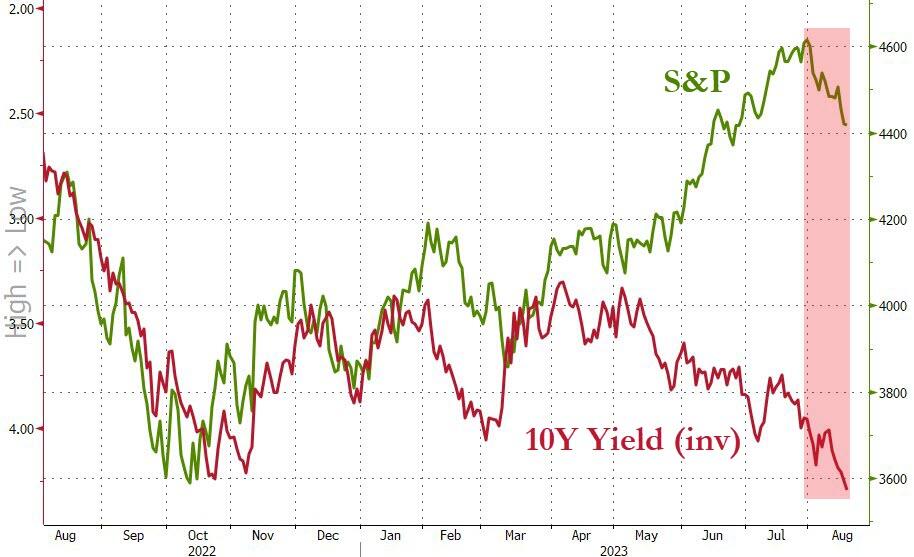
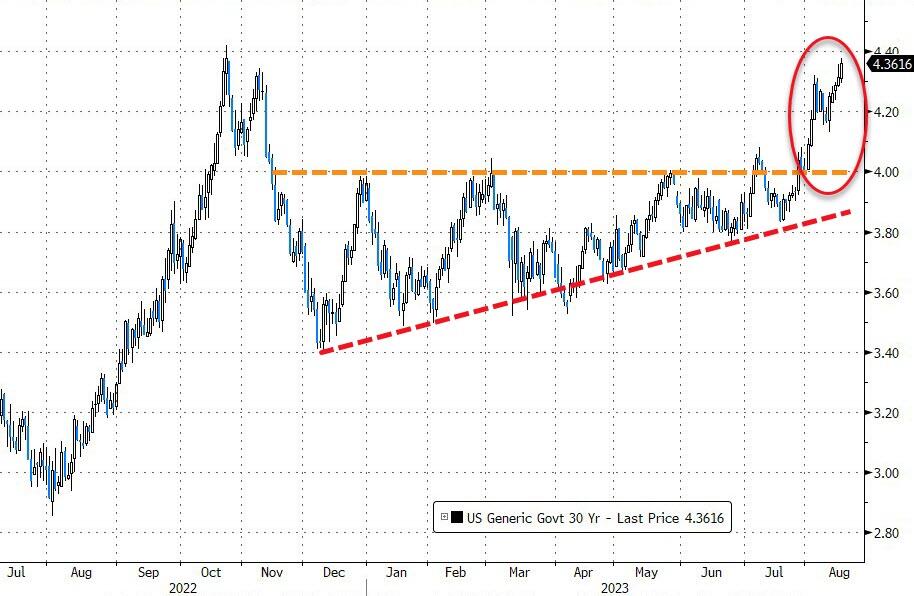
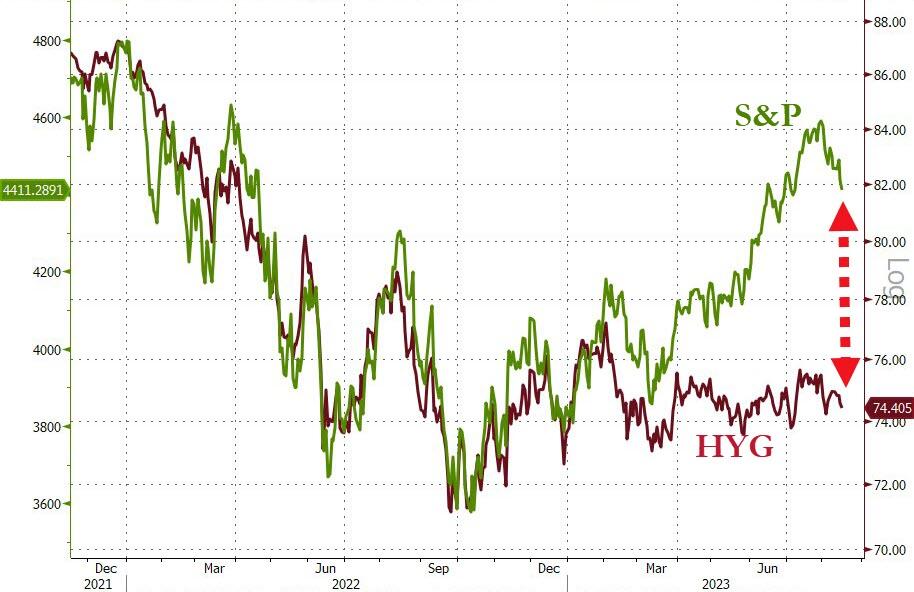
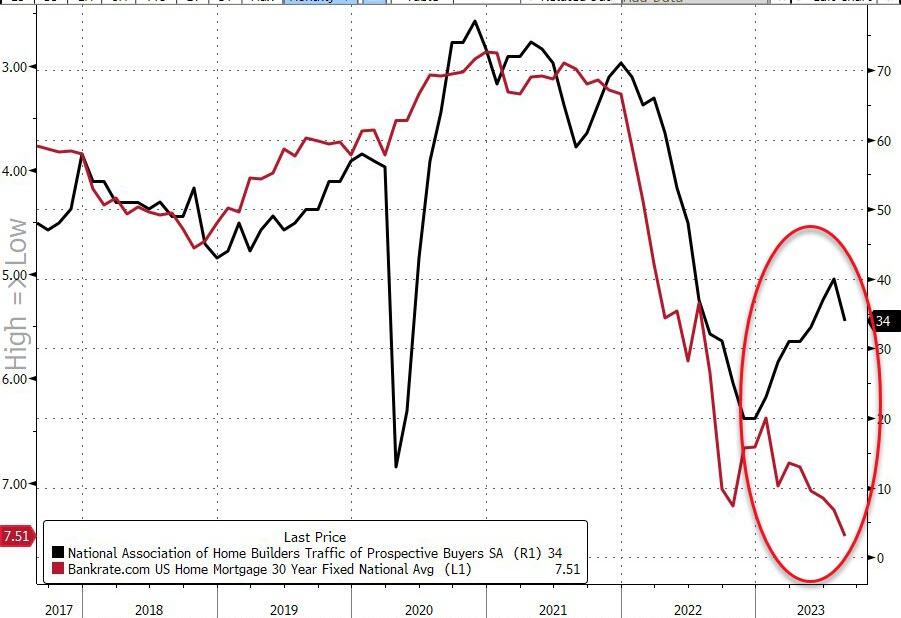
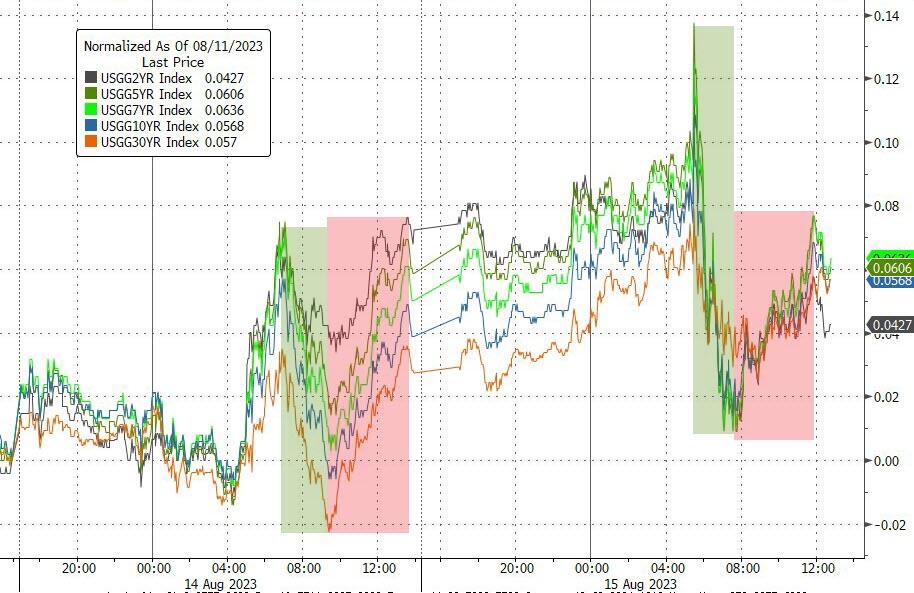
July’s bullish optimism seems to have faded away, as traders are no longer hoping for a soft landing in the economy. Instead, they are wondering how high the Fed will raise interest rates, as inflation worries persist. Yesterday, the 10-year bond yield reached its highest level since last October, but it eased up a bit today by a measly 3.5 basis points to end the week at 4.25%.
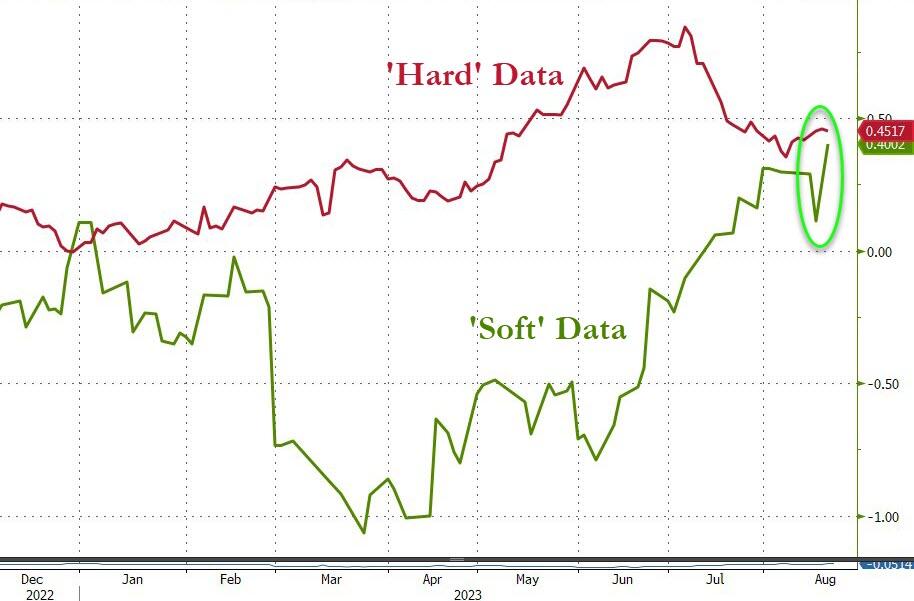
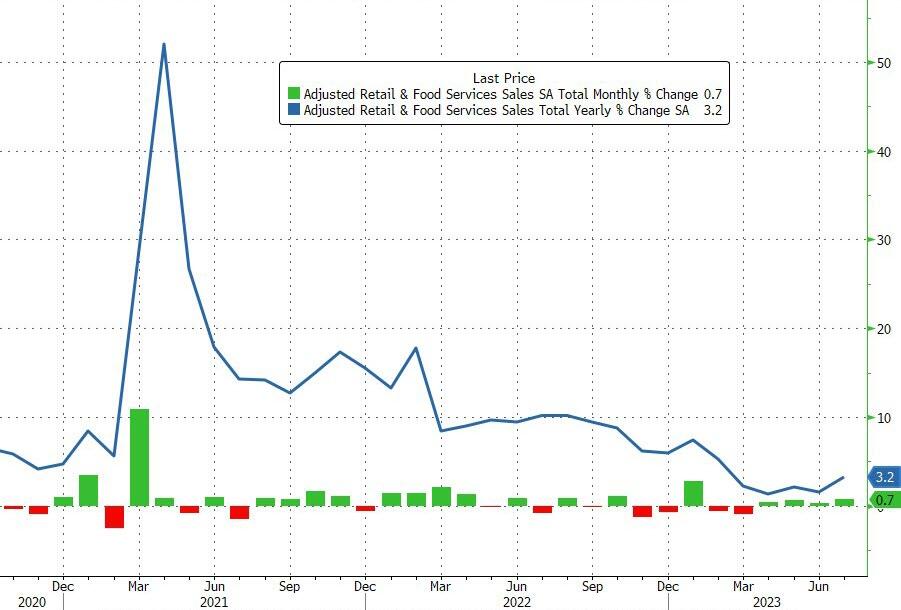
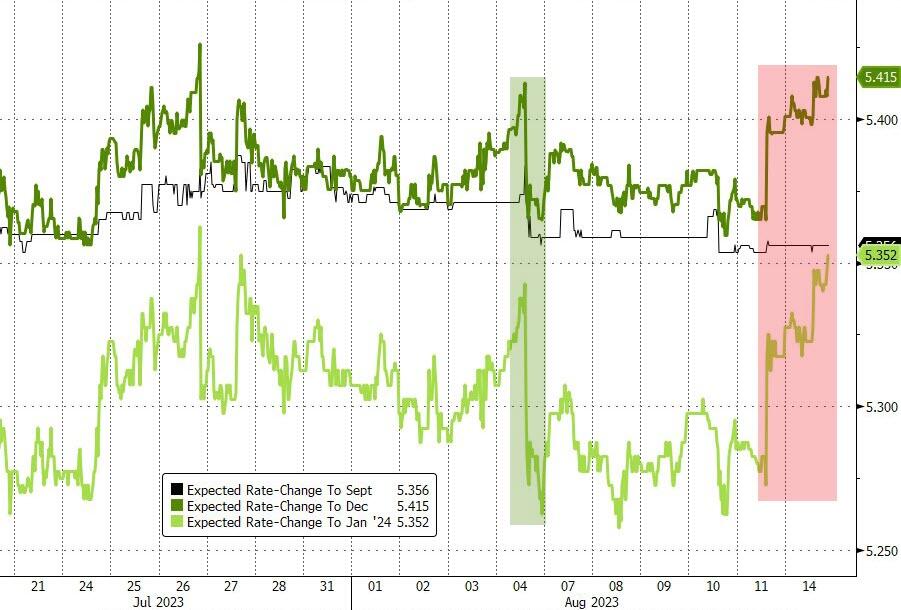
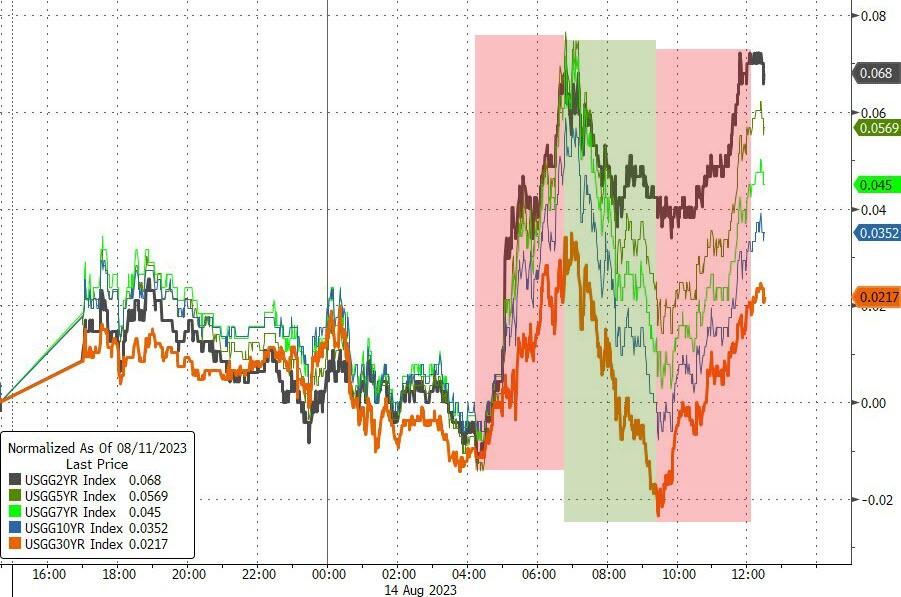
Interestingly, this week’s US macro data was better than expected, both in terms of hard numbers and soft surveys. But this did not help stocks, as the Fed’s hawkish minutes raised the odds of a rate hike sooner rather than later, while also lowering the chances of a rate cut next year.
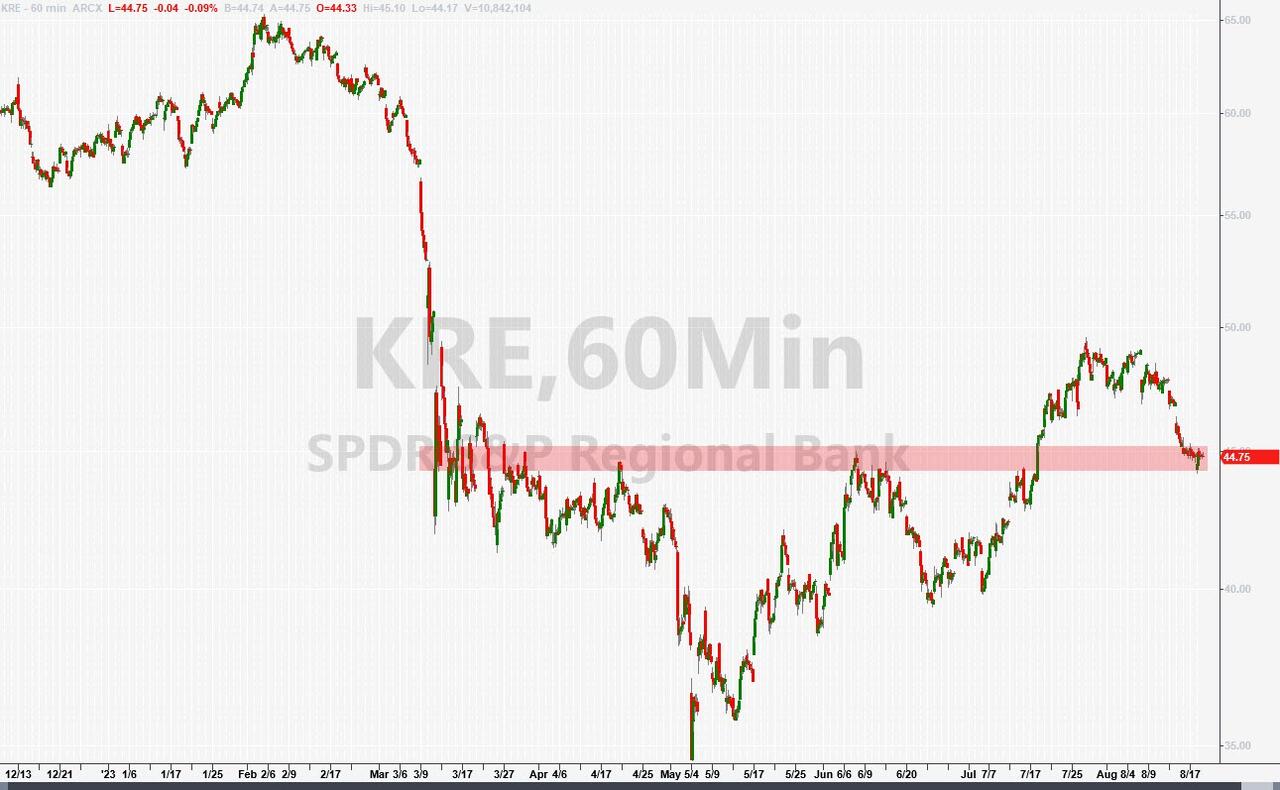
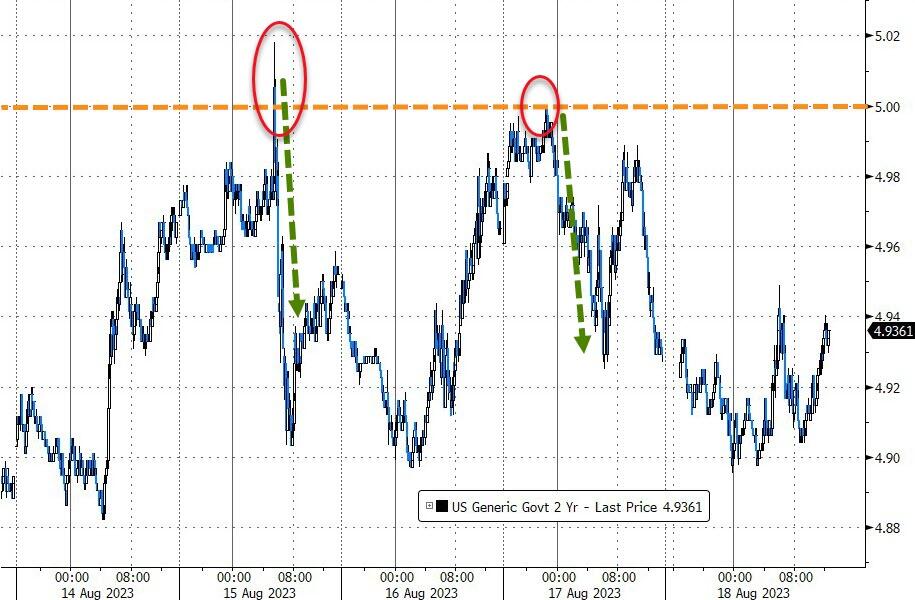
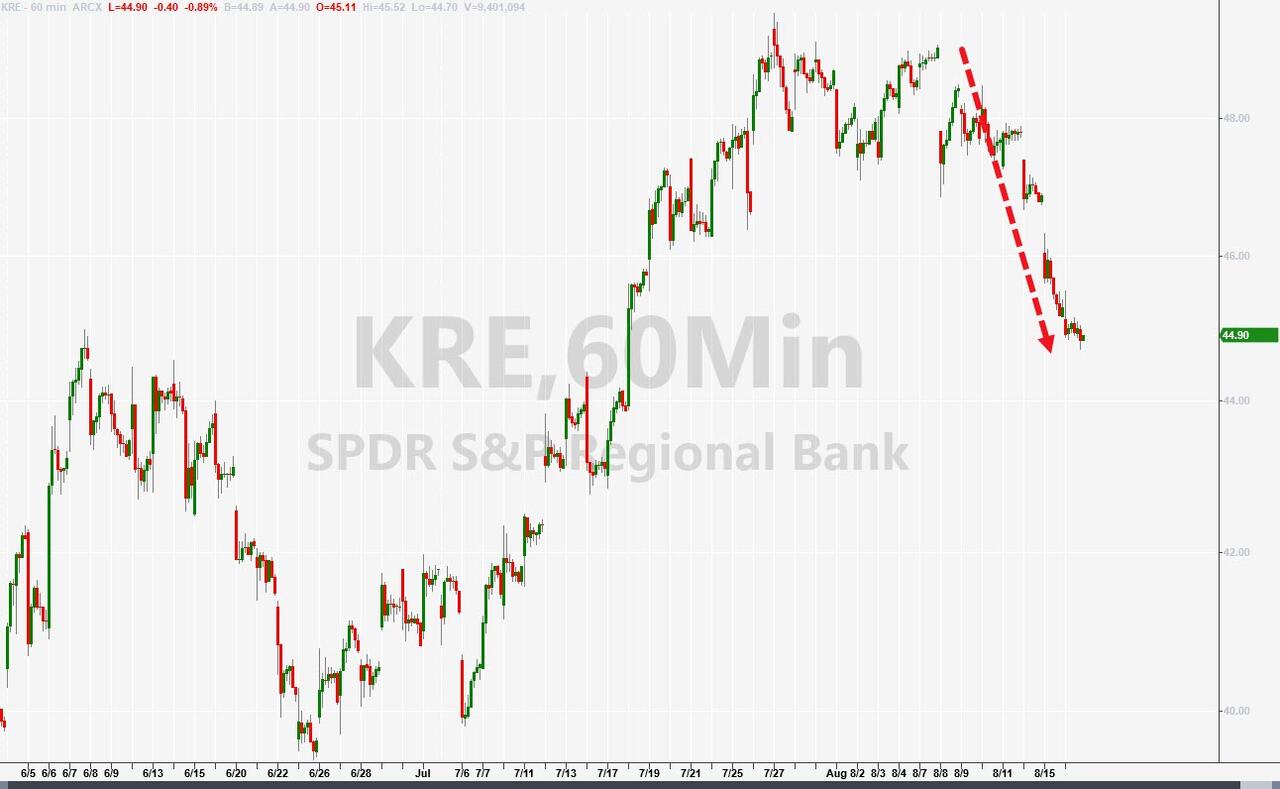
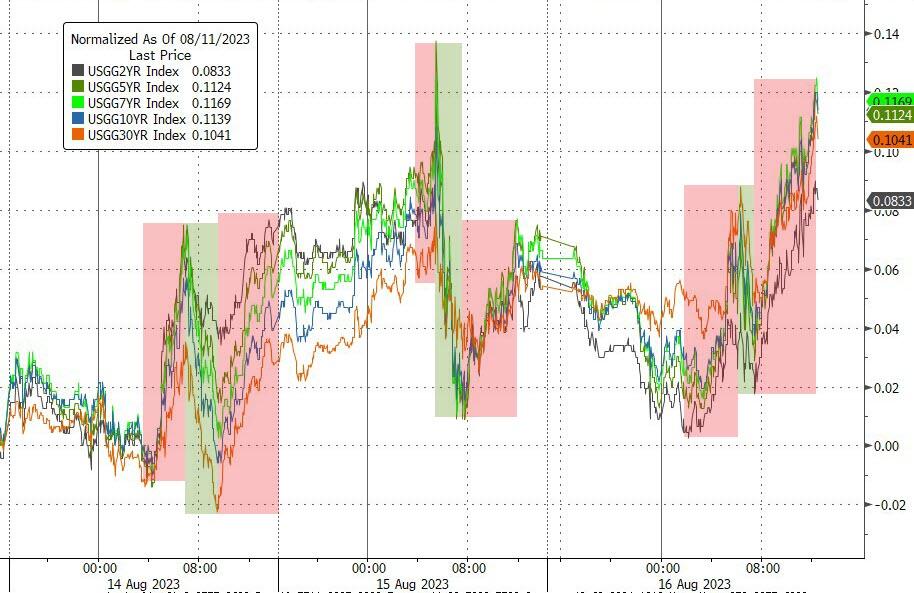
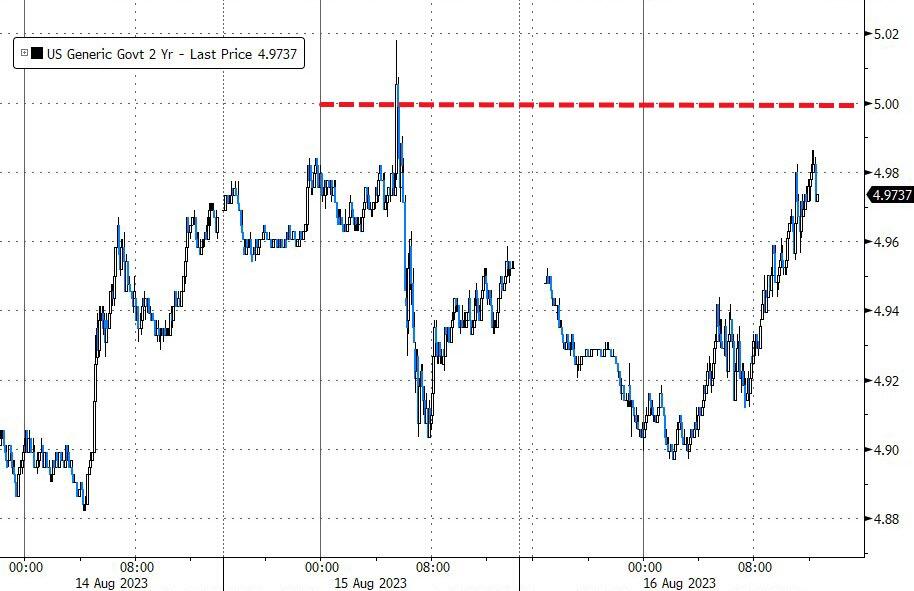
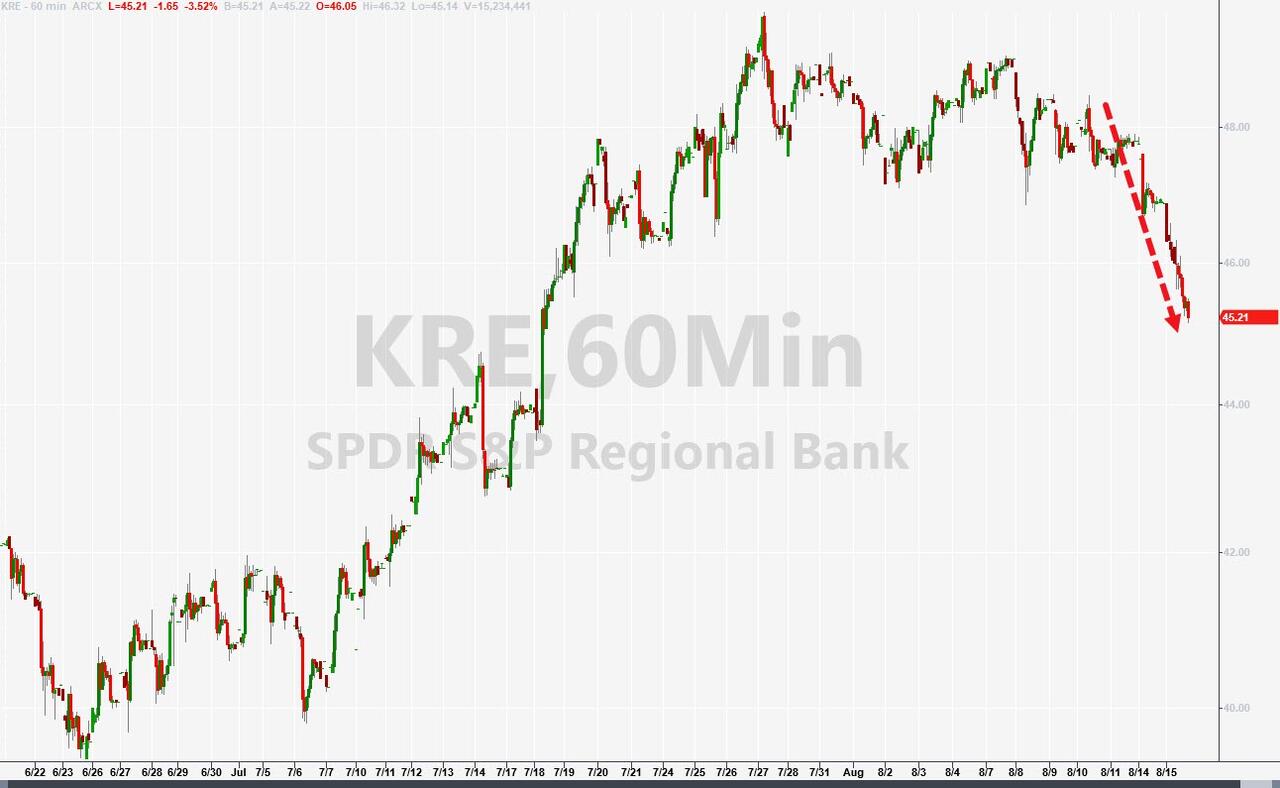
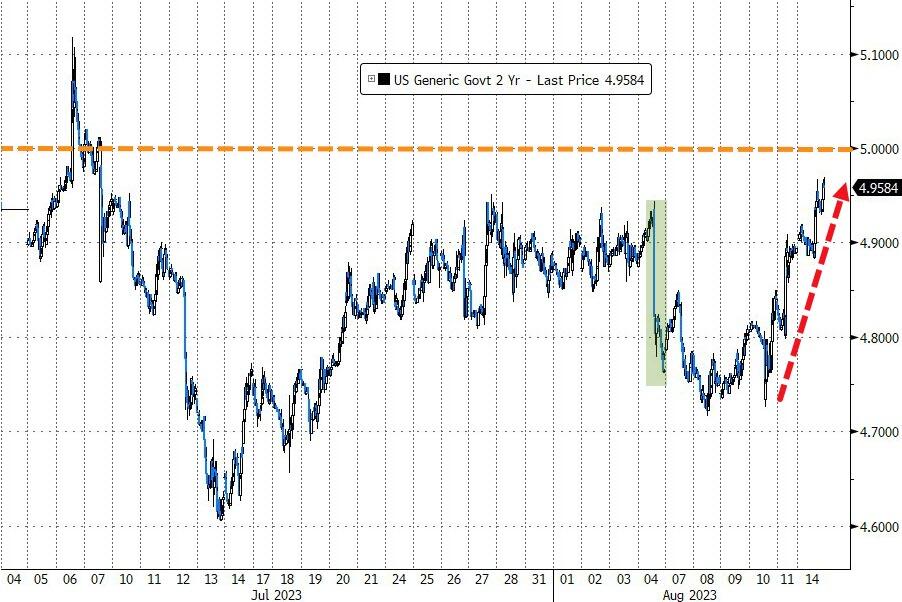
This was a double whammy for traders, who shifted into risk-off mode with Small Caps being the biggest losers of the week. Regional bank stocks also suffered for the third week in a row, and bond yields rose across the board. The 2-year yield briefly touched 5% but could not hold on to it.
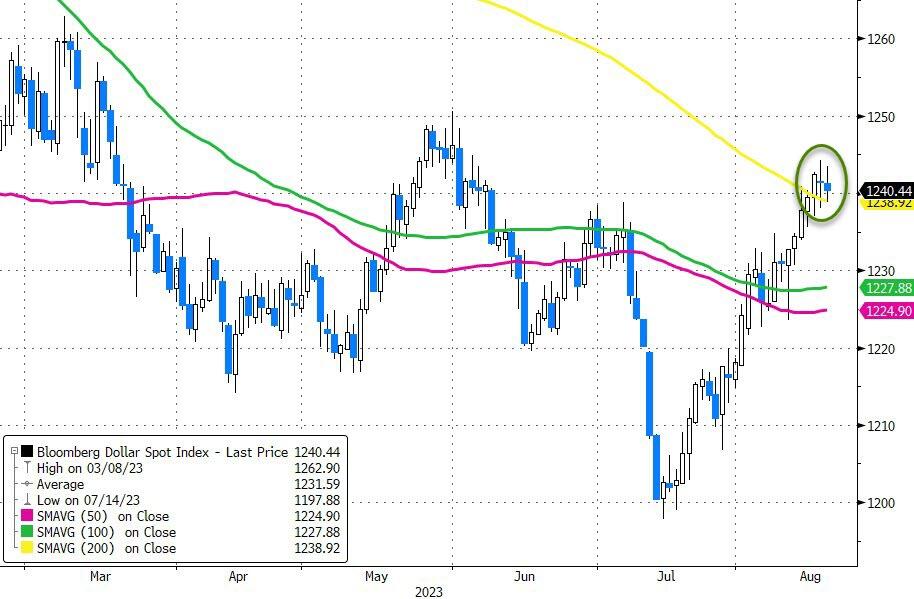
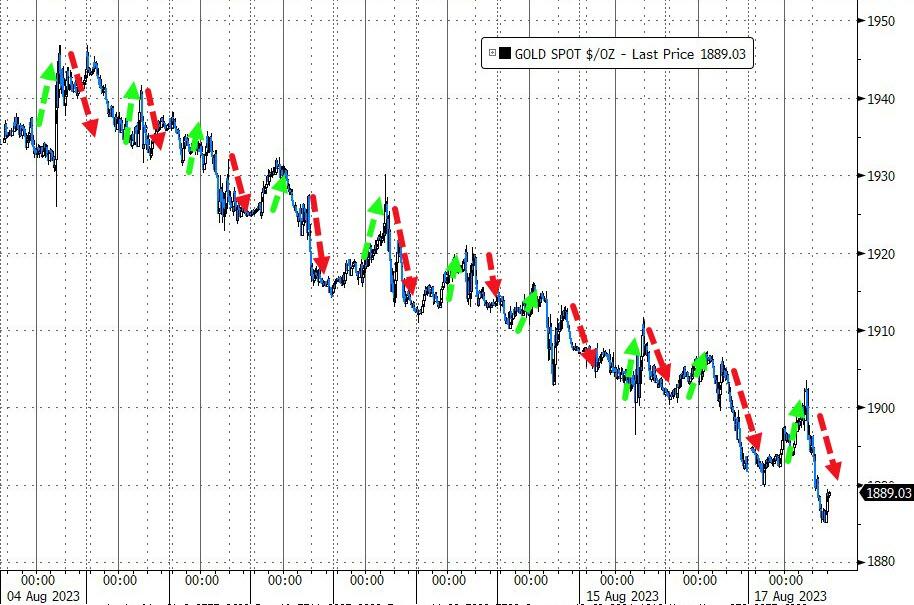
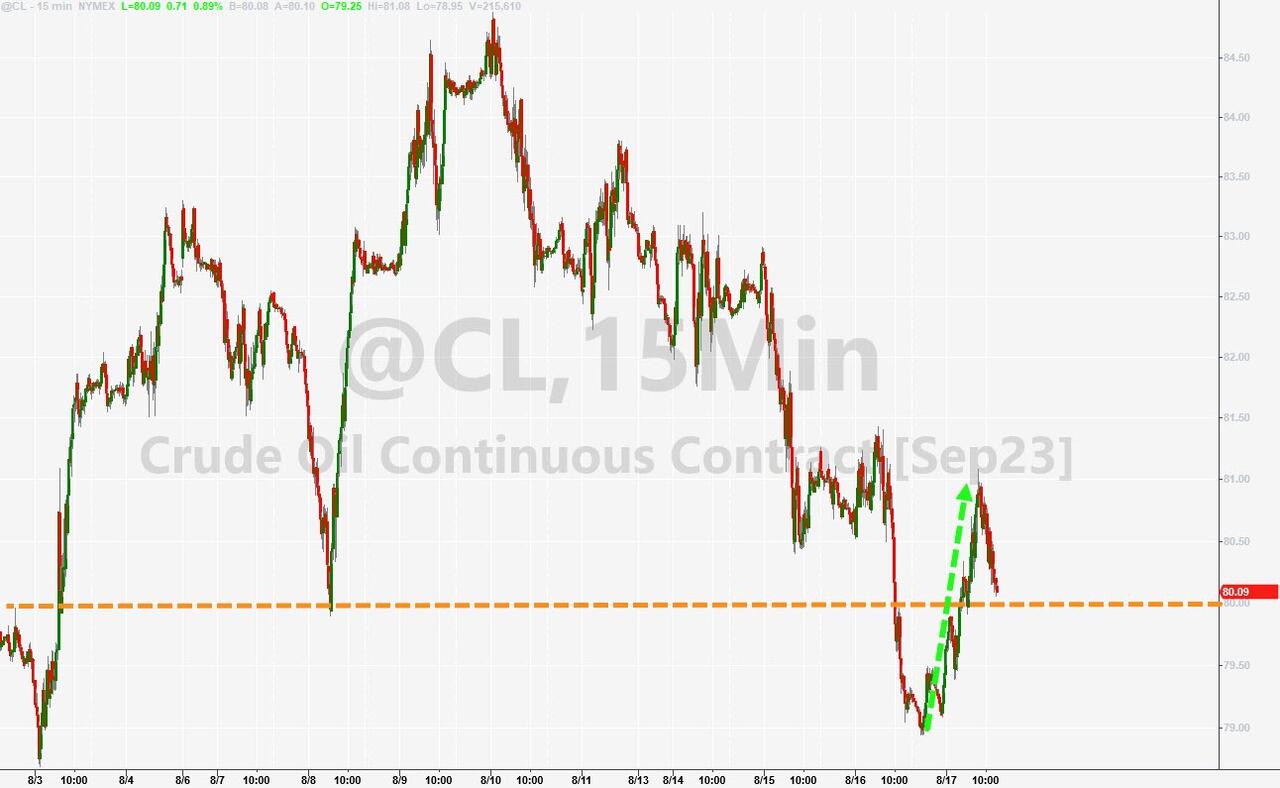
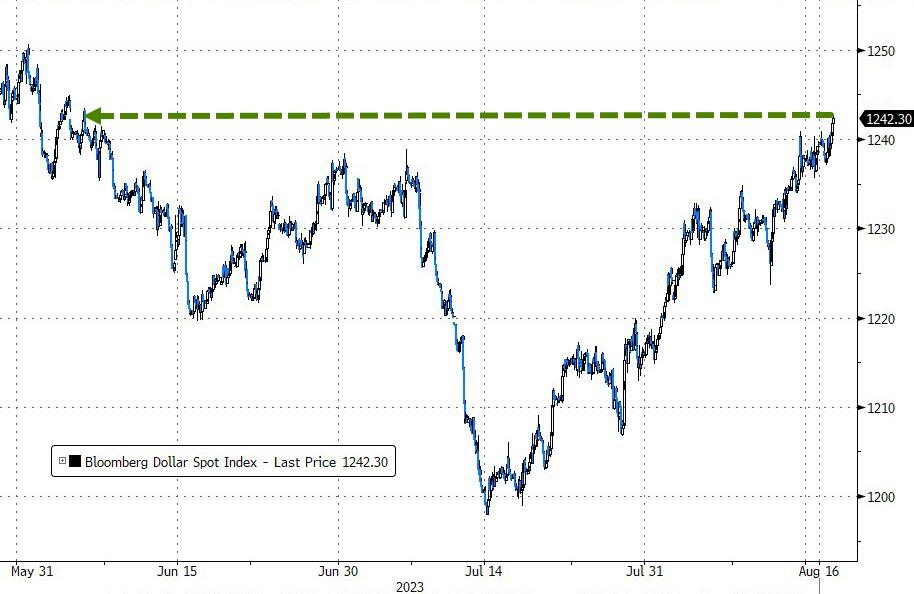
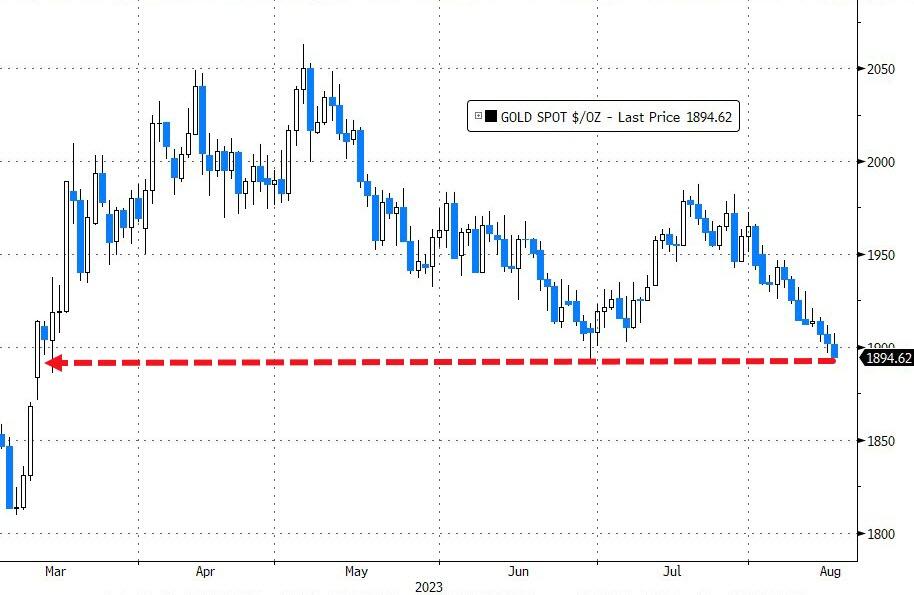
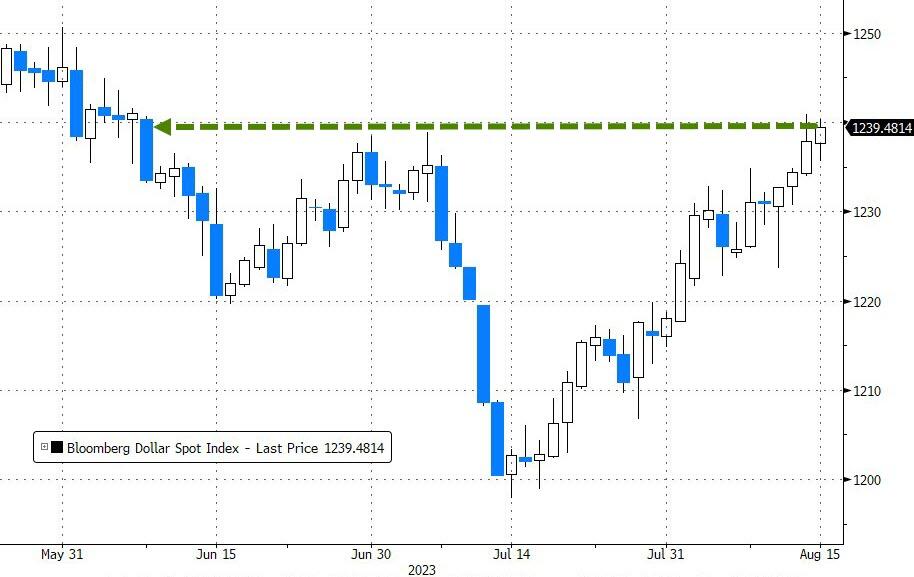
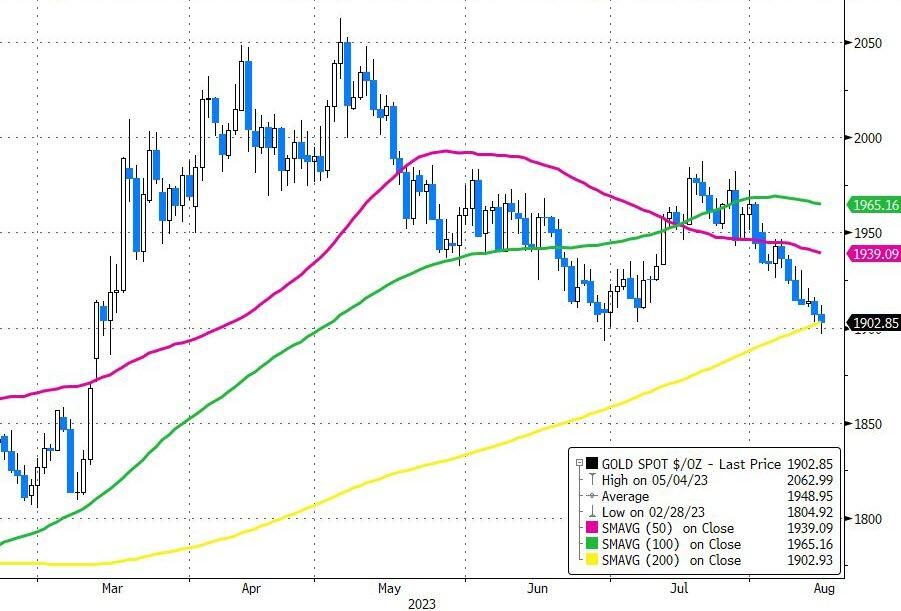
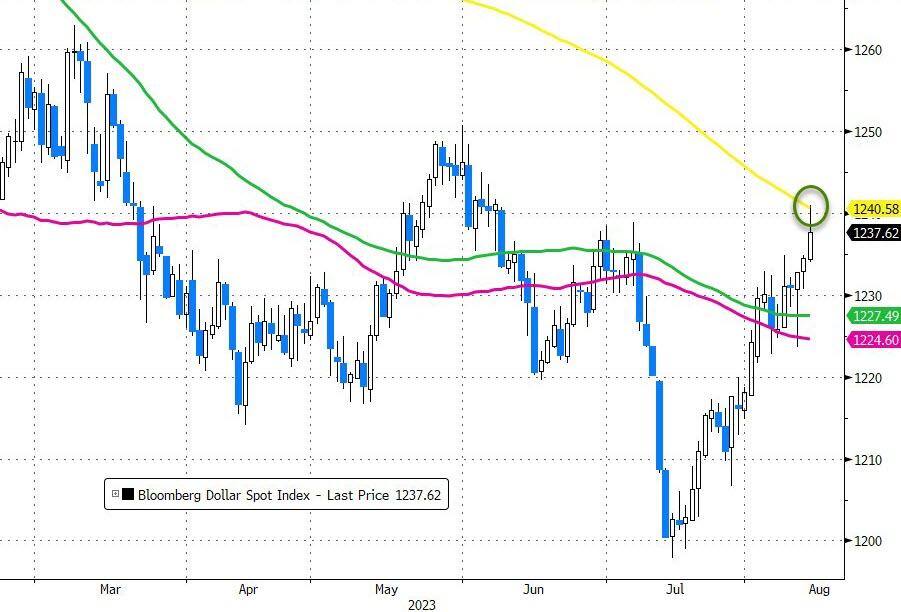
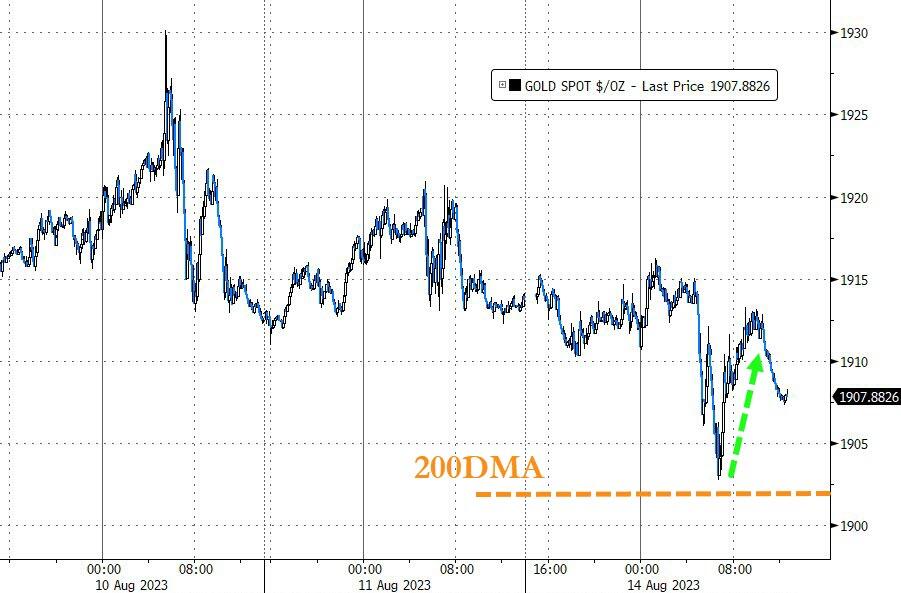
Given the rise in yields, it was no surprise that the dollar rallied and broke above its 200-day moving average. Gold bounced back today and managed to stay above $1,900.
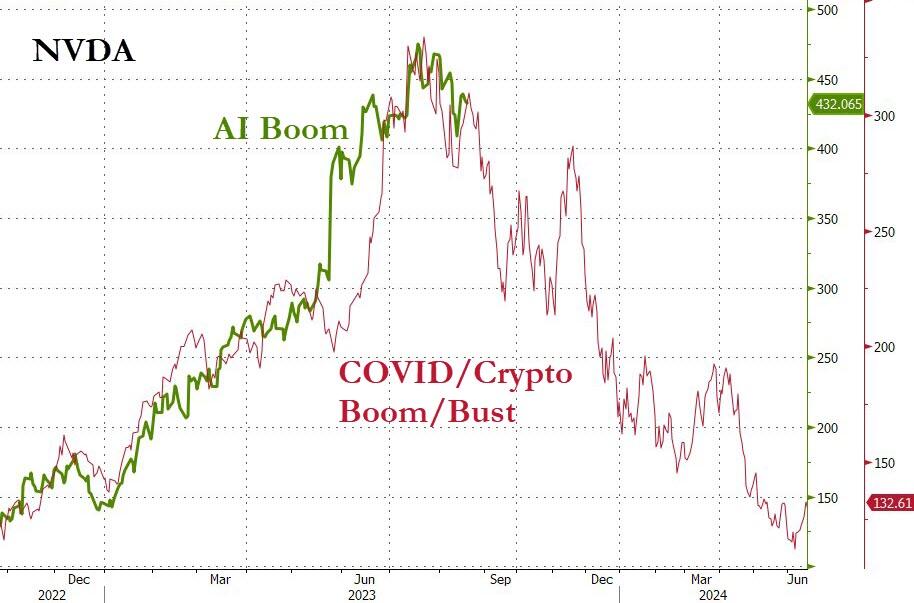
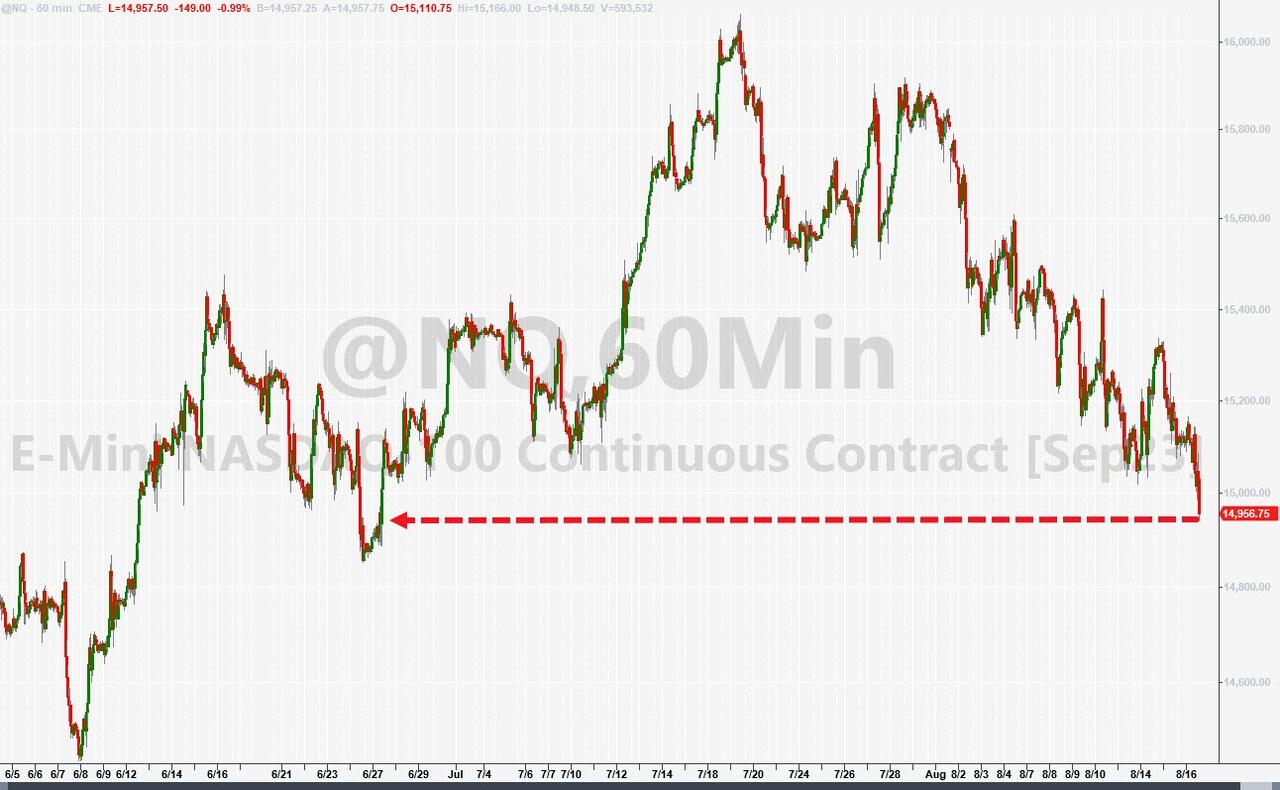
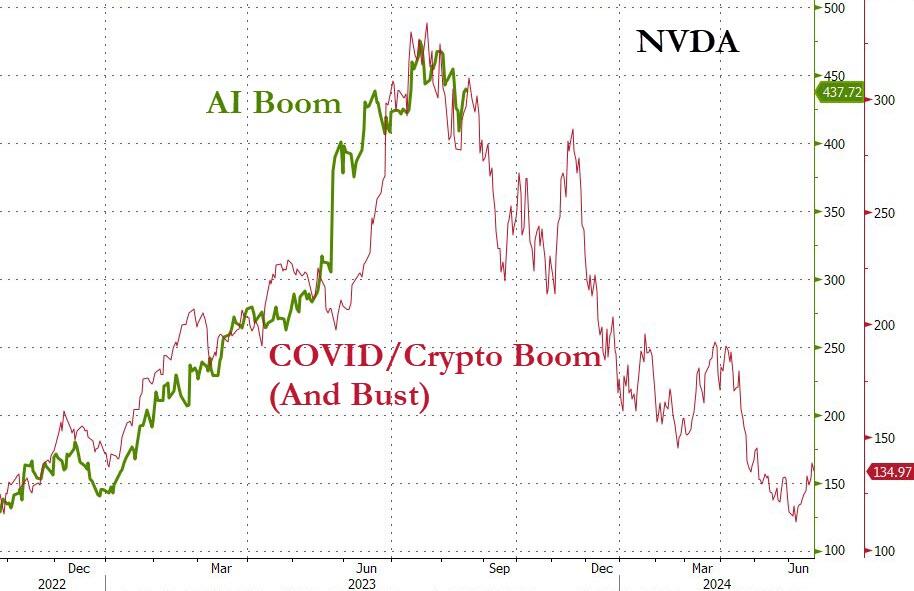
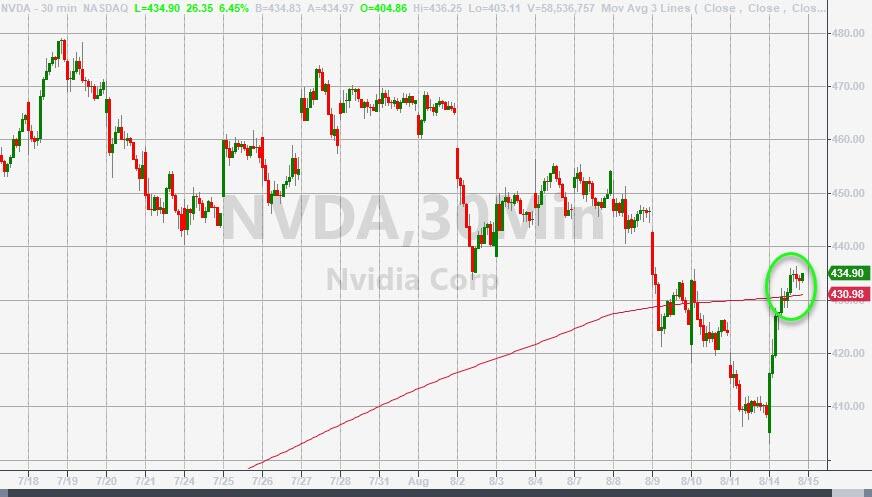
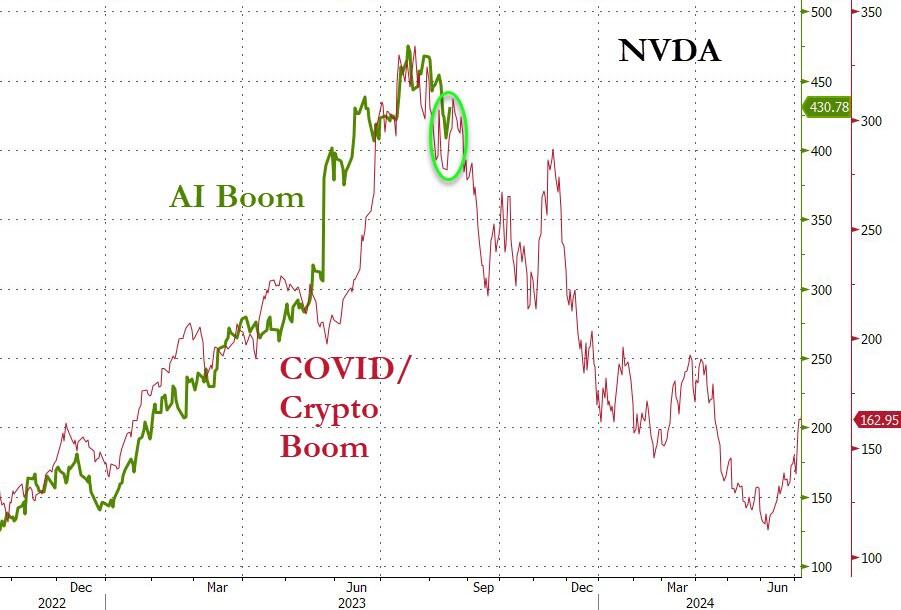
Next week, all eyes will be on Nvidia’s earnings guidance on Wednesday and Fed Chair Powell’s speech at Jackson Hole on Friday.
If this chart is anything to go by, Nvidia may disappoint investors with its outlook. And then there is this…
Read More