

- Moving the market
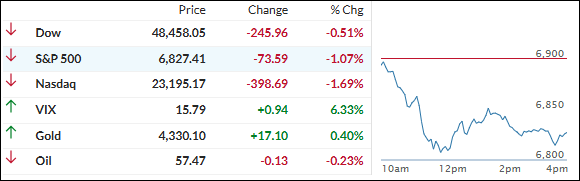
Stocks slipped early on as traders chewed over the long-delayed November jobs report and what it might mean for the Fed’s next move.
The tape felt choppy rather than panicky, with markets trying to balance better‑than‑expected headlines against some softer details under the surface.
November payrolls rose by 64,000 versus expectations for 45,000, but that strength was offset by a hefty 105,000 downward revision to October, an uptick in unemployment to 4.6%, and cooler wage growth.
Put together with weak headline retail sales (even if the core/control group held up) and ugly PMI readings on both the manufacturing and services sides, the broader macro picture landed as “not great, but maybe dovish enough” rather than truly reassuring.
All of that helped keep hopes alive for another Fed rate cut early next year, at least in theory, giving equities some support into year‑end even if today’s price action didn’t fully show it.
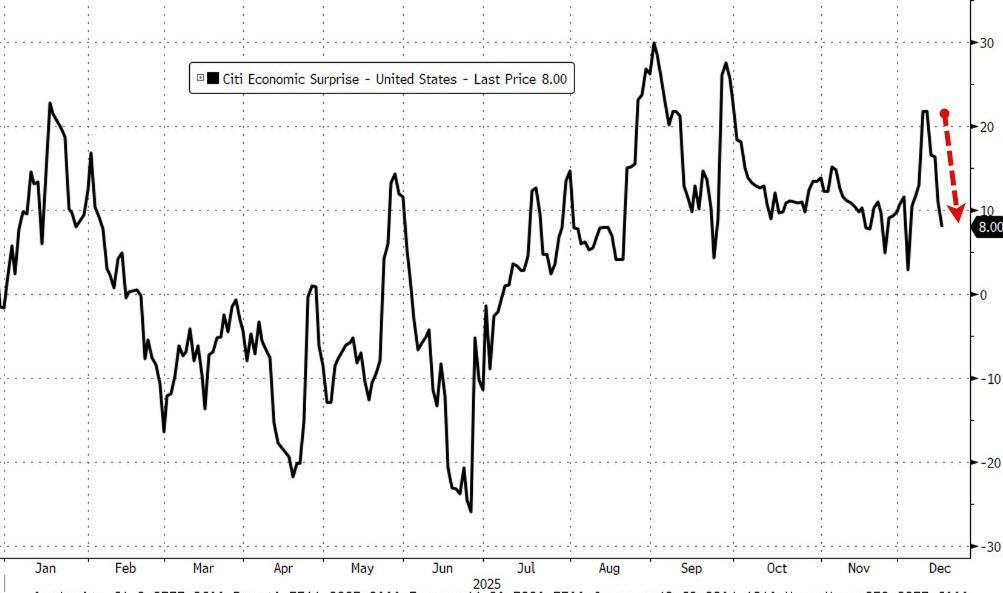
The Citi macro surprise index rolled over alongside the major indexes, while U.S.–Europe trade tensions over digital taxes on big U.S. tech firms added another layer of uncertainty to the mix.
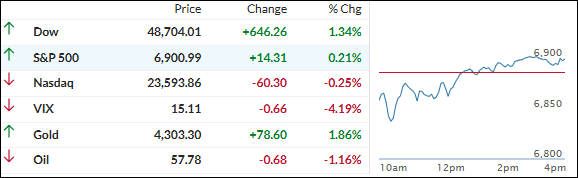
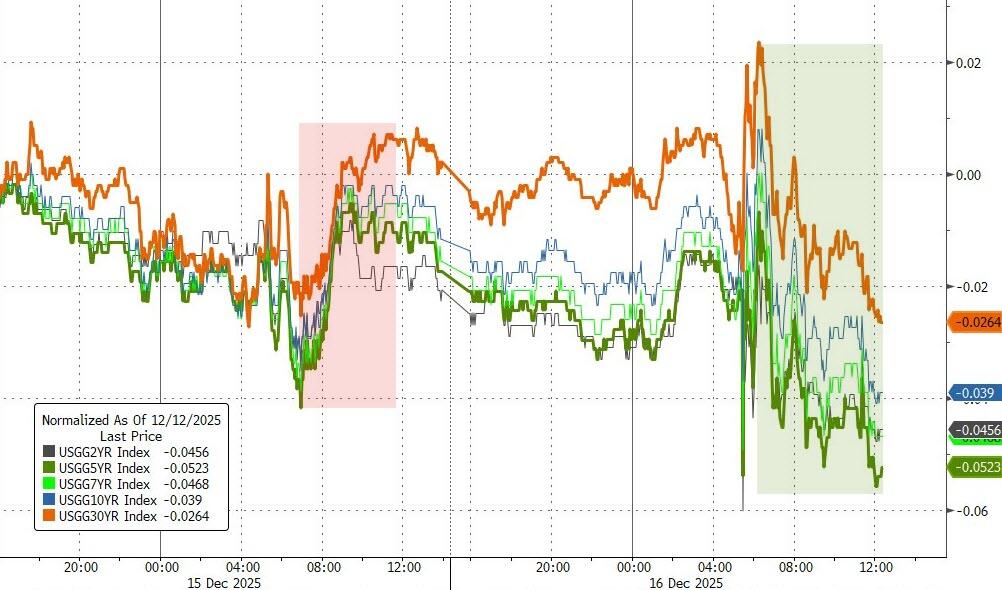
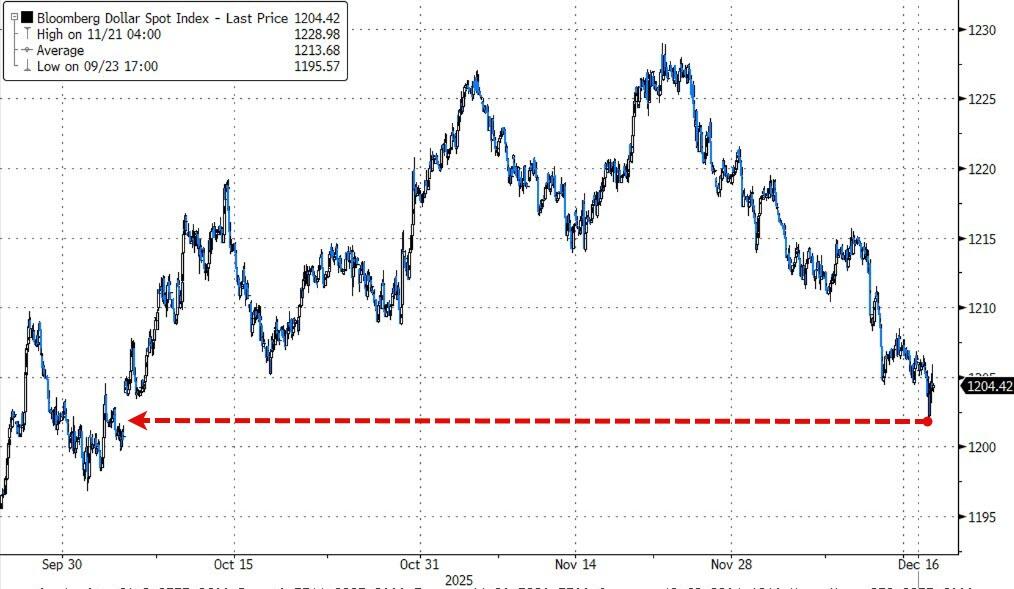
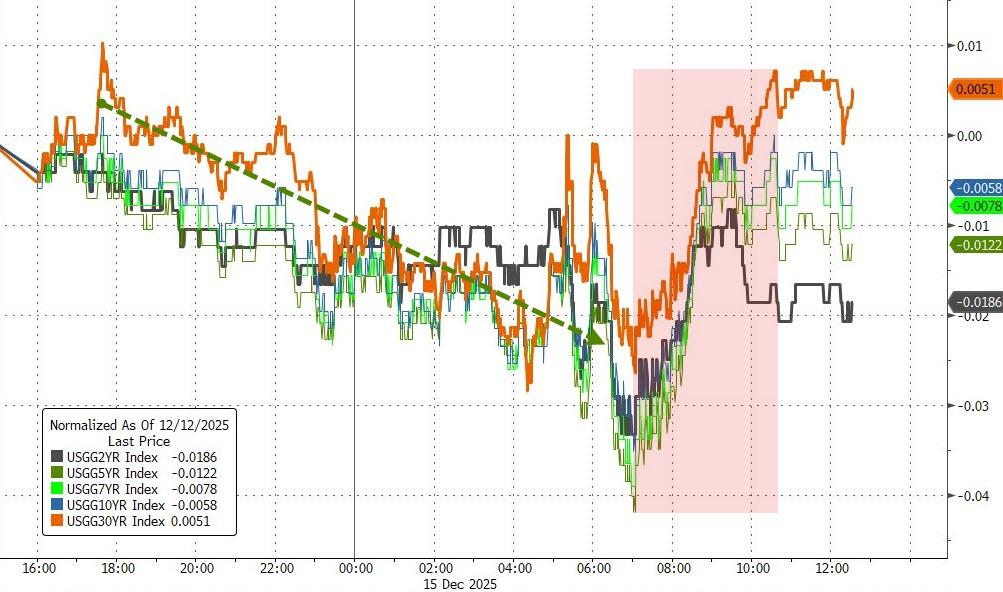
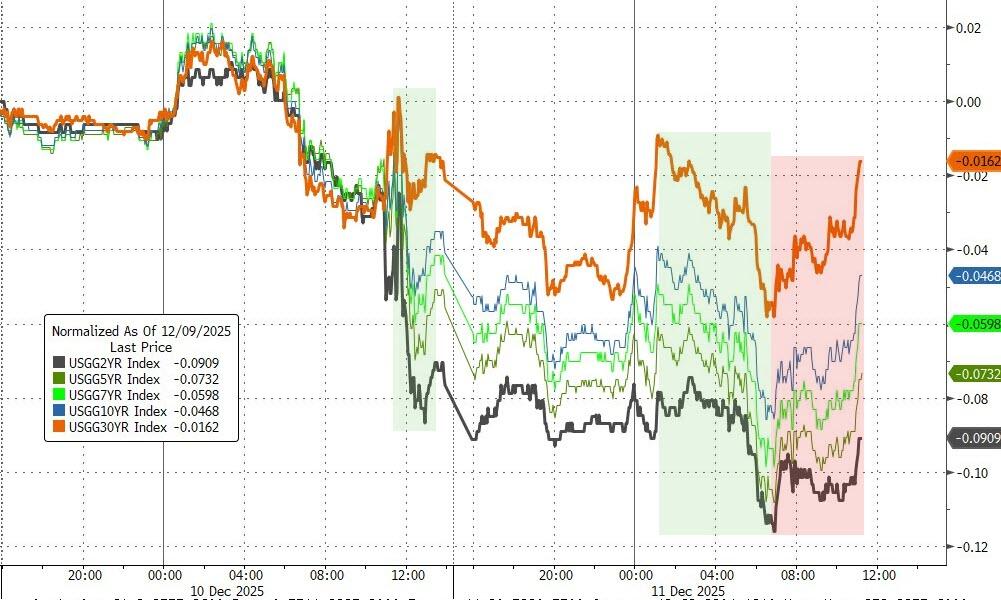
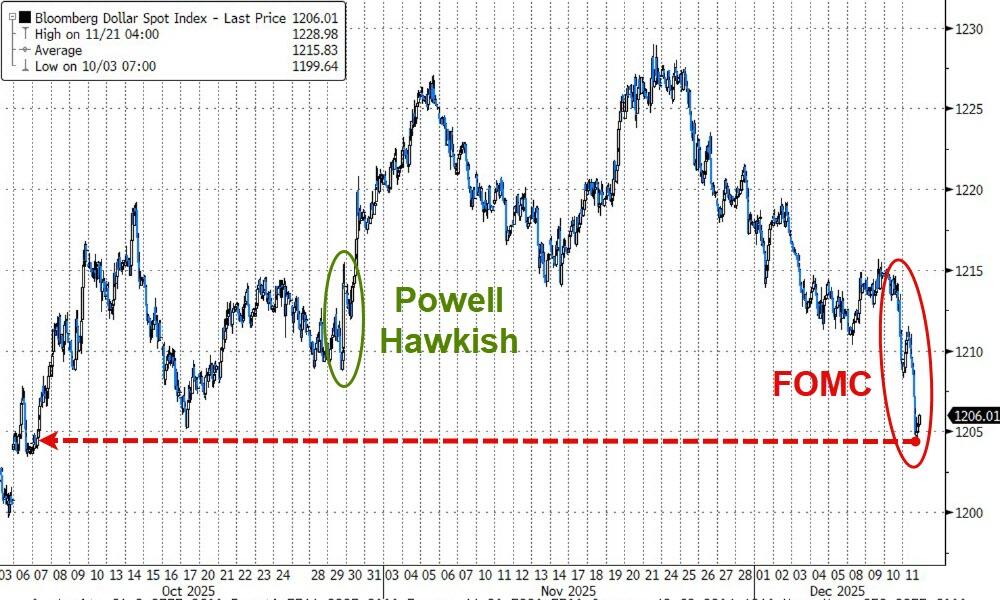
Even so, the Nasdaq managed to sneak out a small gain, helped by sliding bond yields and continued pressure on the dollar.
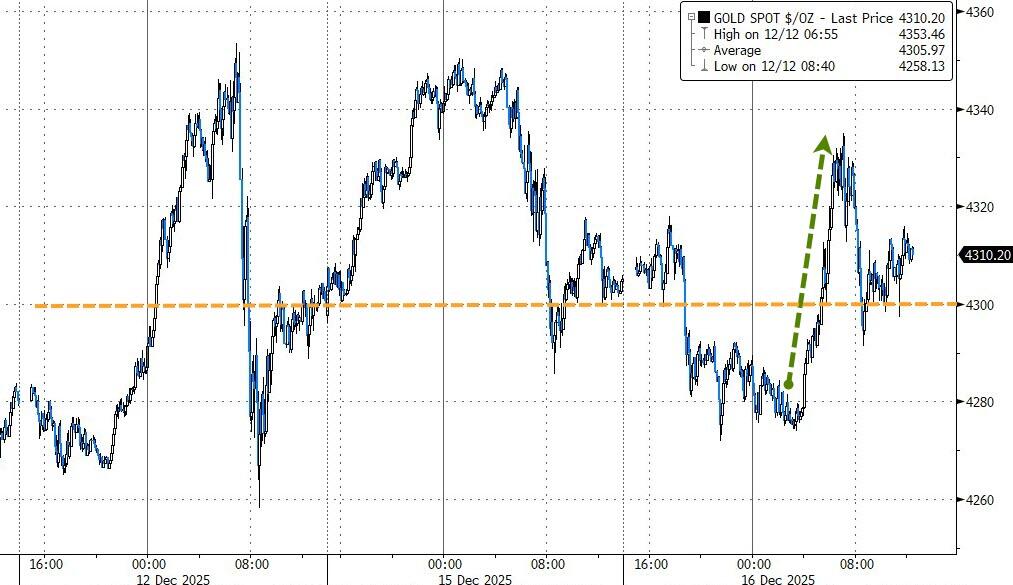
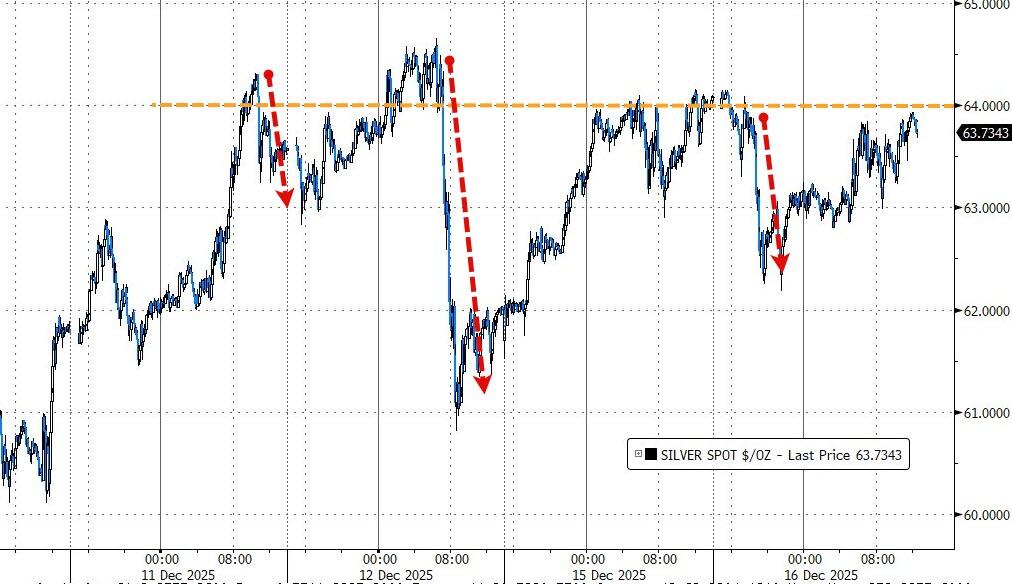
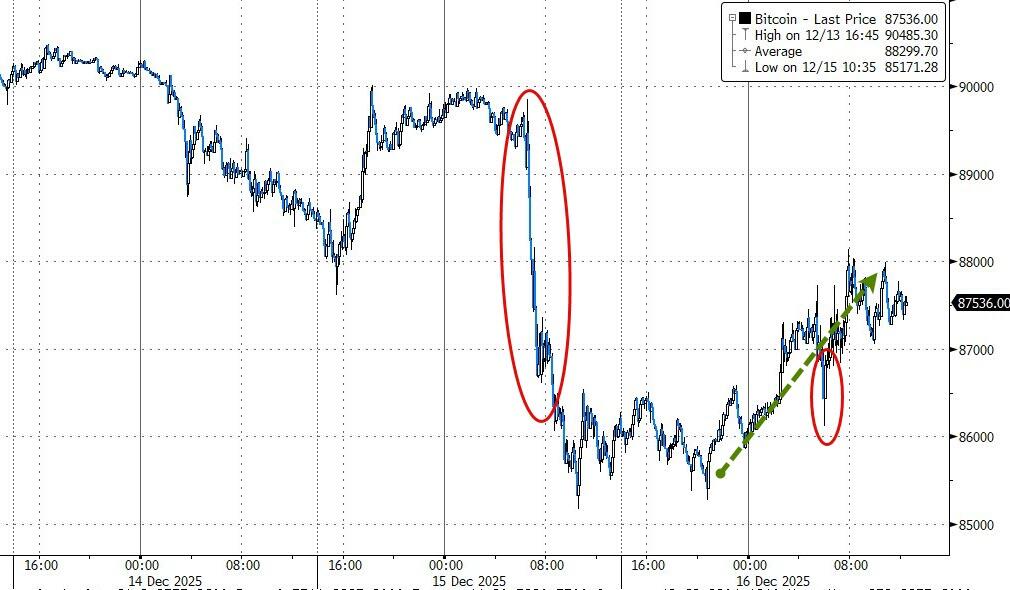
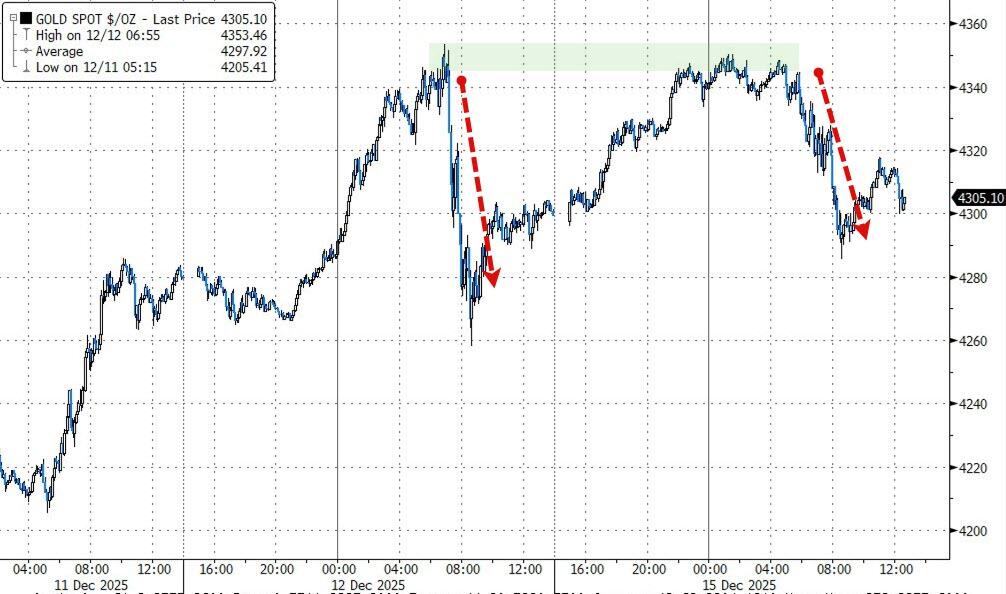
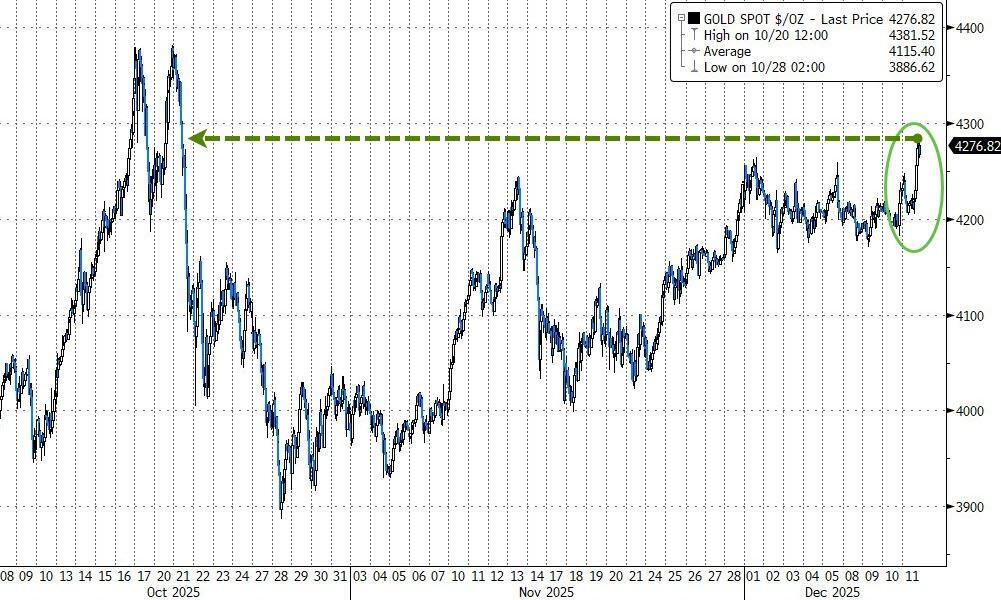
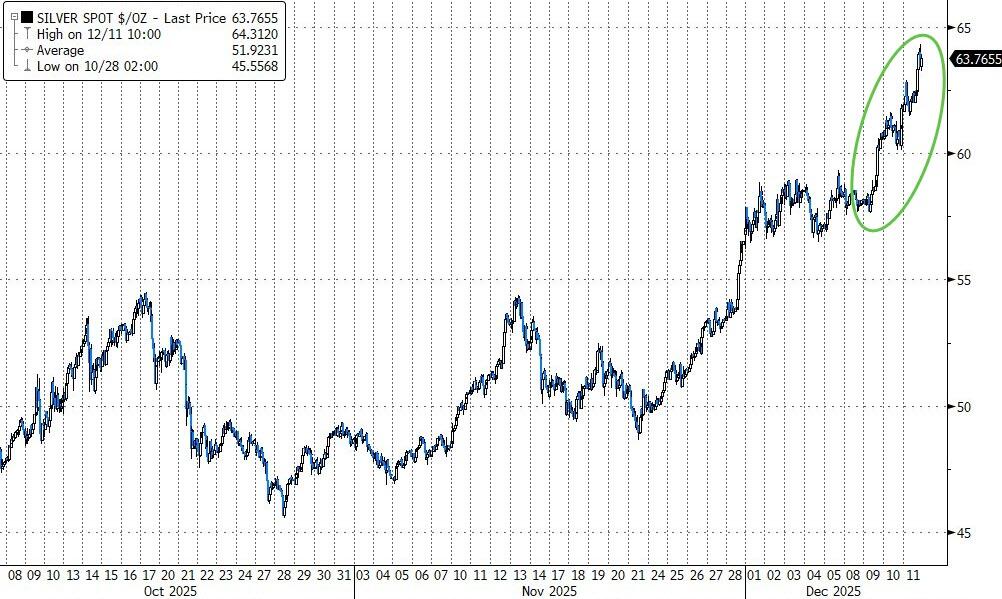
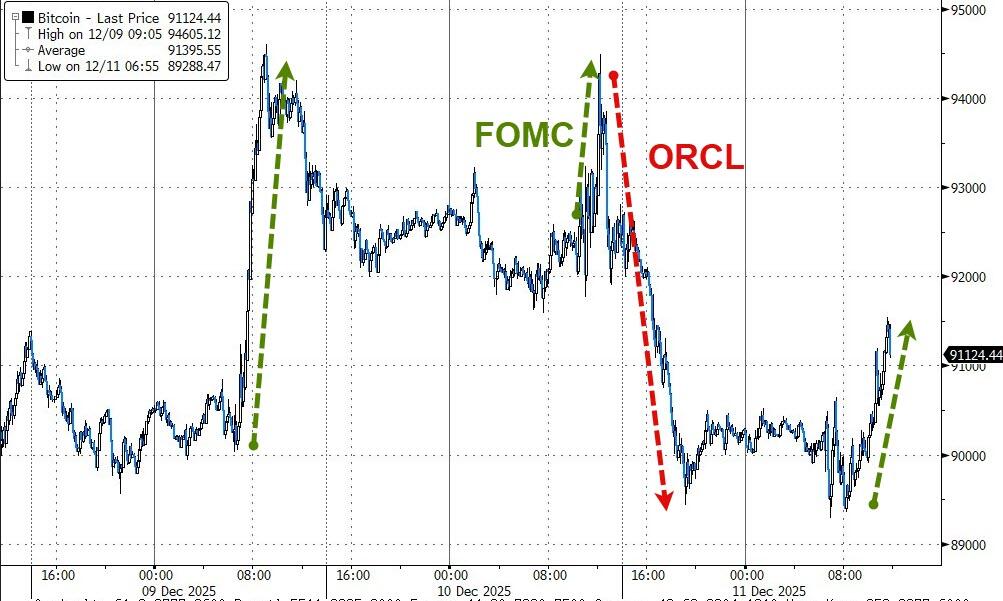
Gold held its ground around the 4,300 level after a mild bounce, silver slipped back below 64, and Bitcoin staged a partial recovery from yesterday’s hit, poking up toward 88,000 intraday before failing to close above it.
So, with data sending mixed signals, yields drifting lower, and markets still debating how many cuts are left in the Fed’s playbook—and when they’ll arrive—the question now is whether this is just a digestion phase before a year‑end push higher, or the start of a more cautious tone as 2026 comes into view.
Read More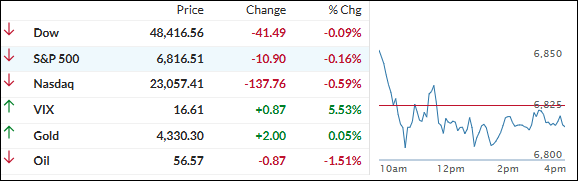