
- Moving the markets
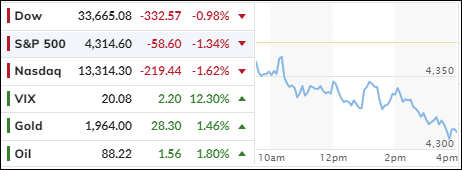
The stock market had a rough day on Wednesday, after the S&P 500 got too close to its glass ceiling and bounced back down.
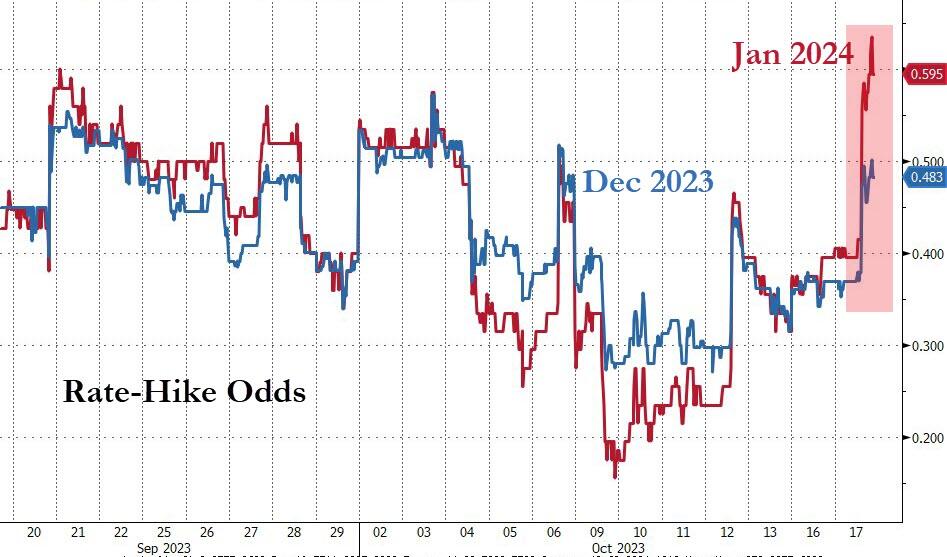
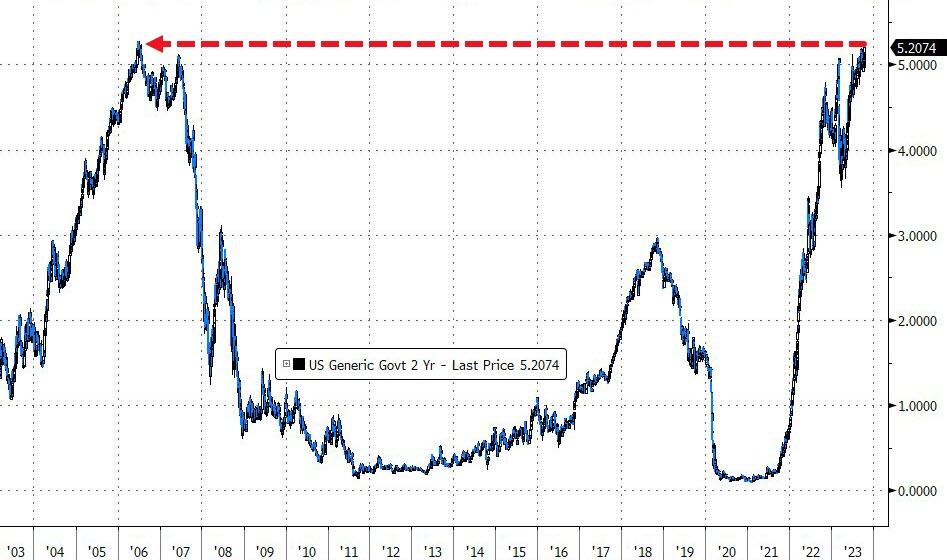
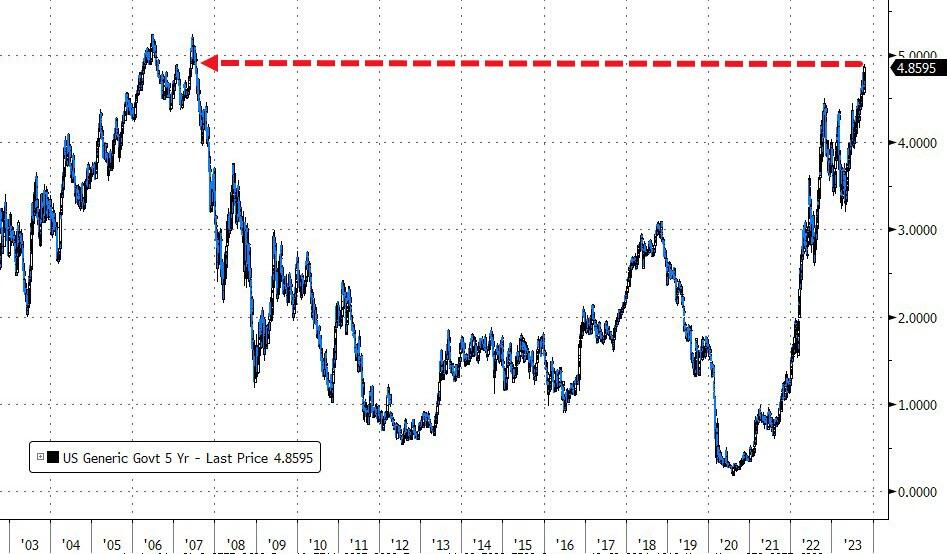
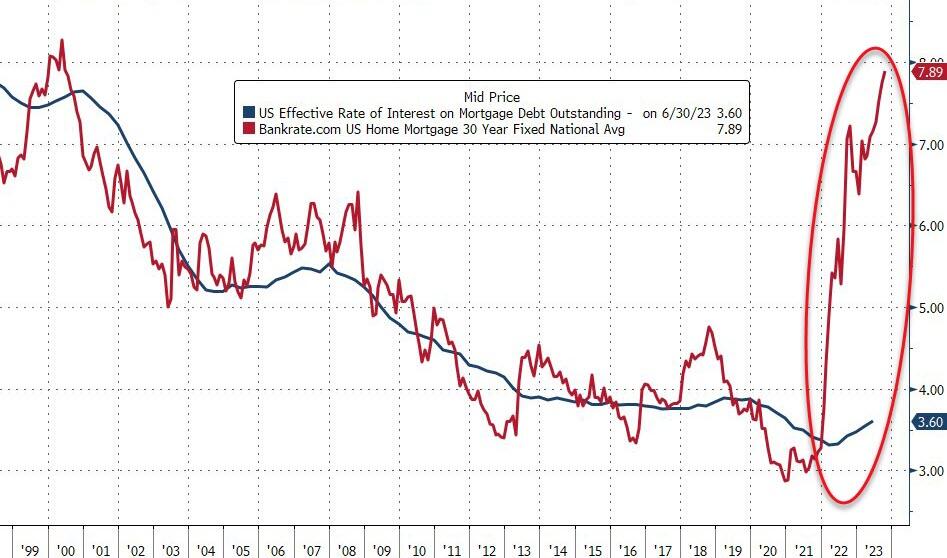
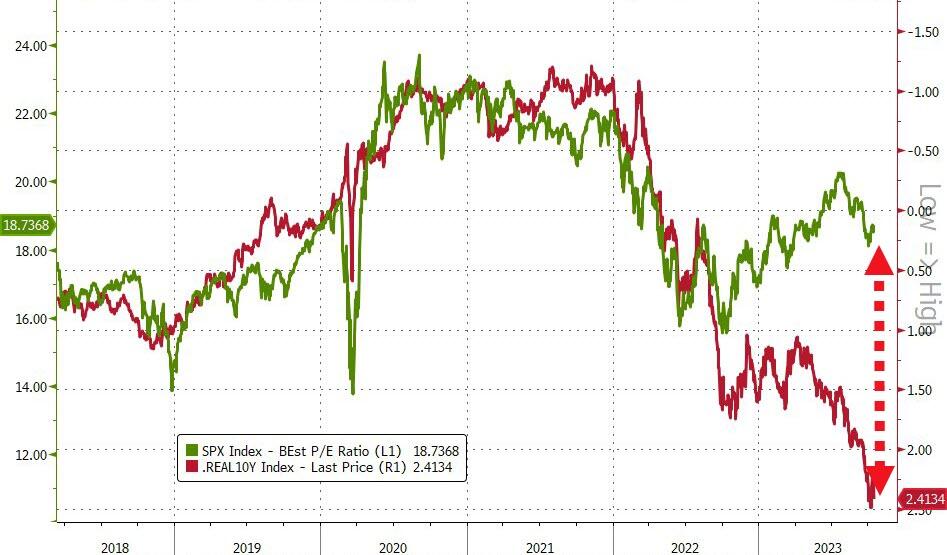
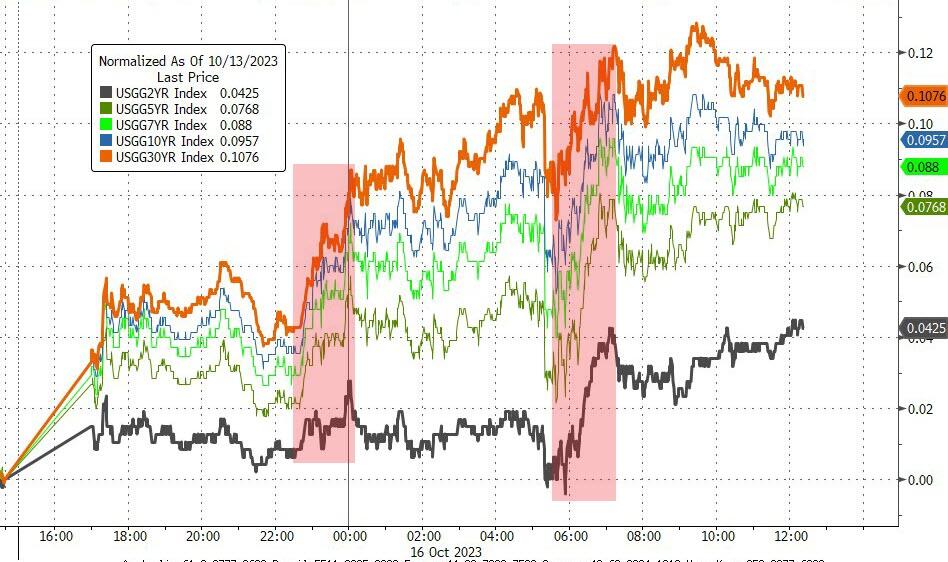
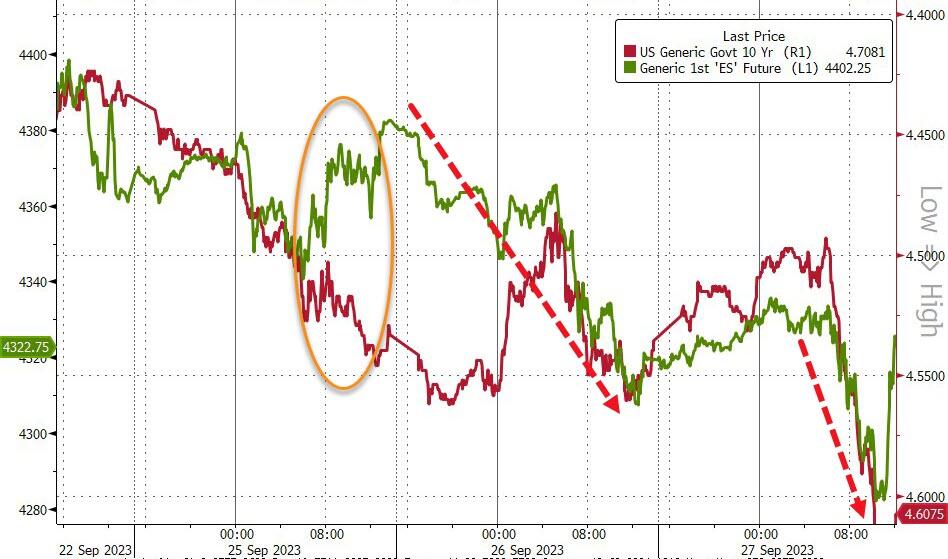
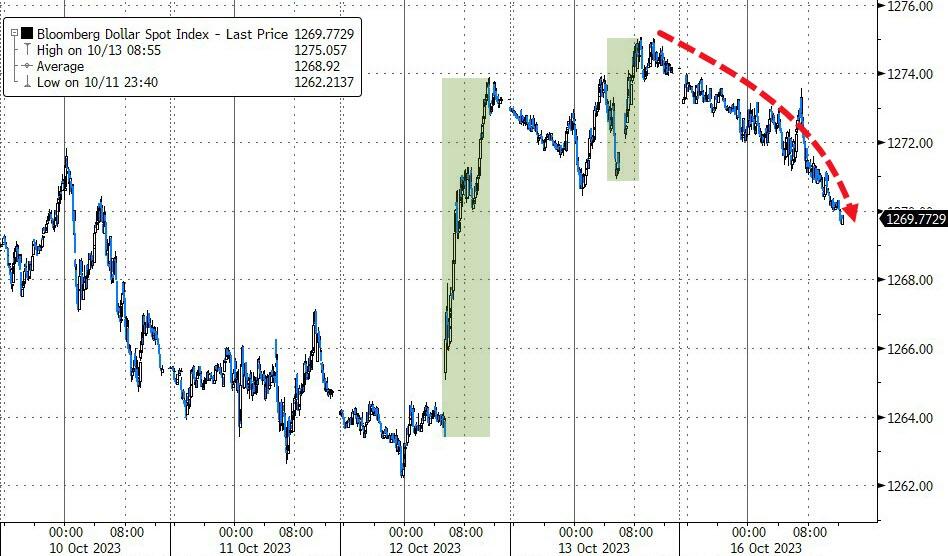
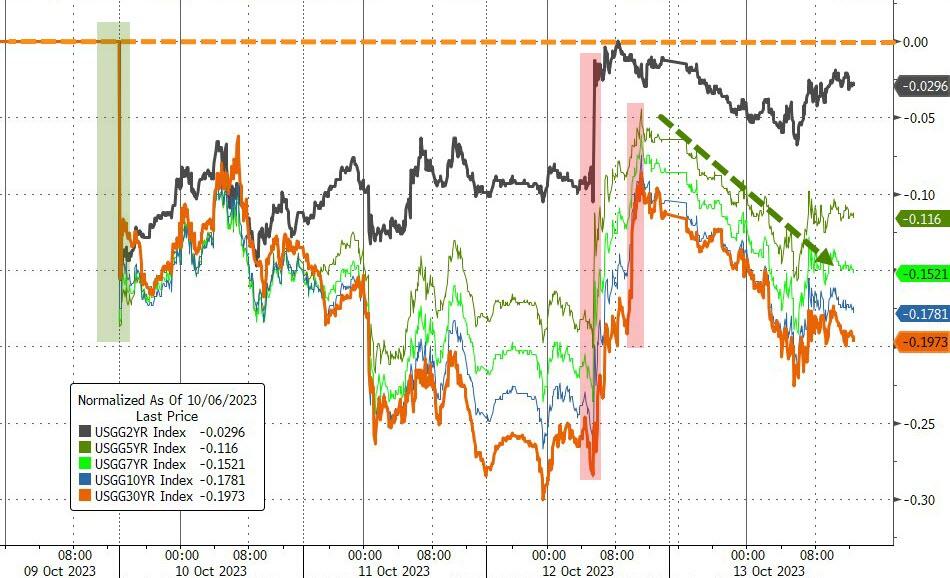
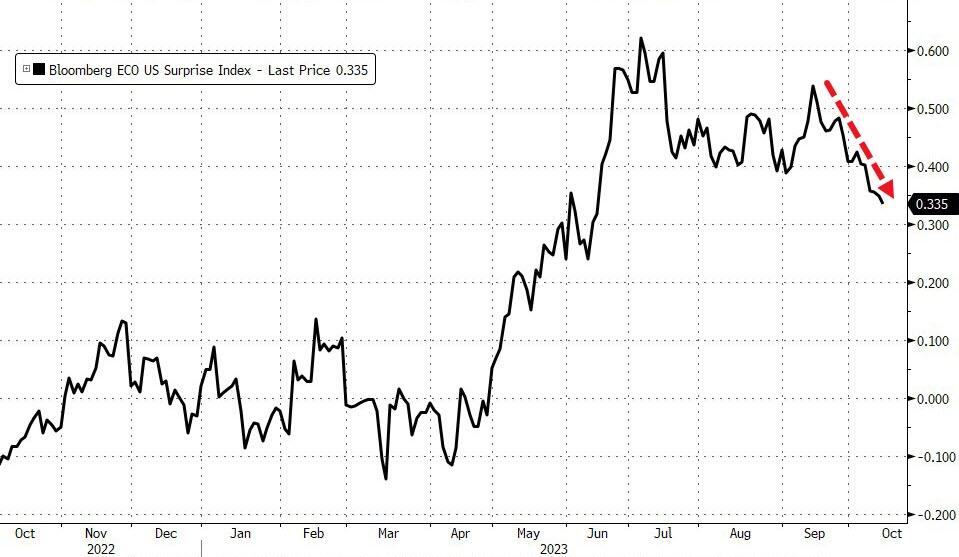
It was a busy day for earnings reports and rising interest rates, which made investors nervous and jittery. The 10-year bond yield jumped over 4.9%, the highest since 2007. That’s bad news for anyone who wants to buy a house, because the average 30-year mortgage rate just hit 8%, the highest since 2000. Ouch!
Earnings were a mixed bag, with only 10% of the S&P 500 companies reporting so far, according to FactSet. Most of them beat the low expectations, but that’s not saying much. The real question is what they expect for the future, and how the interest rates will affect their business.
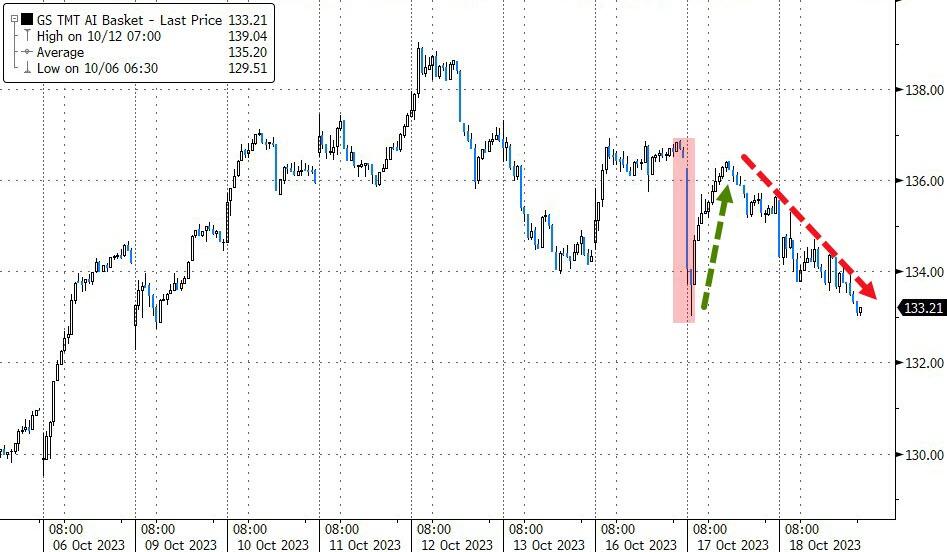
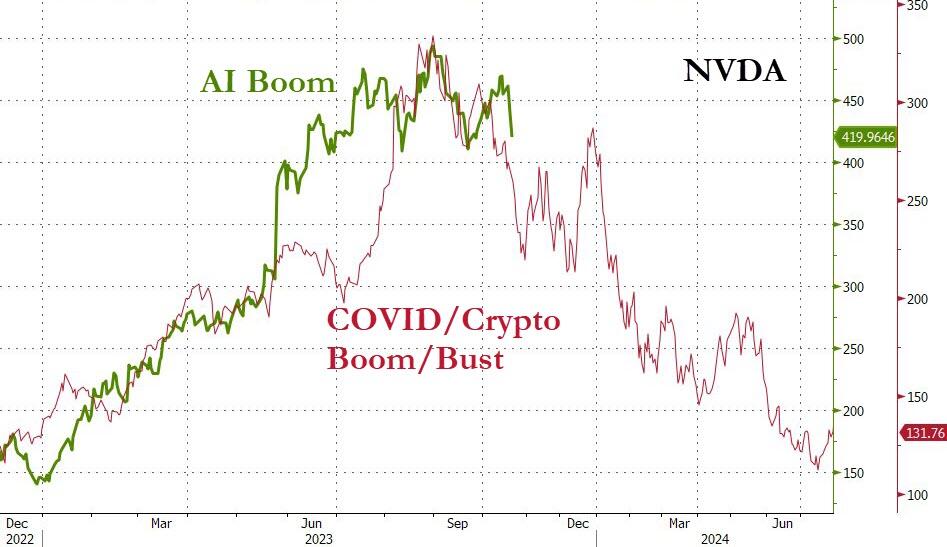
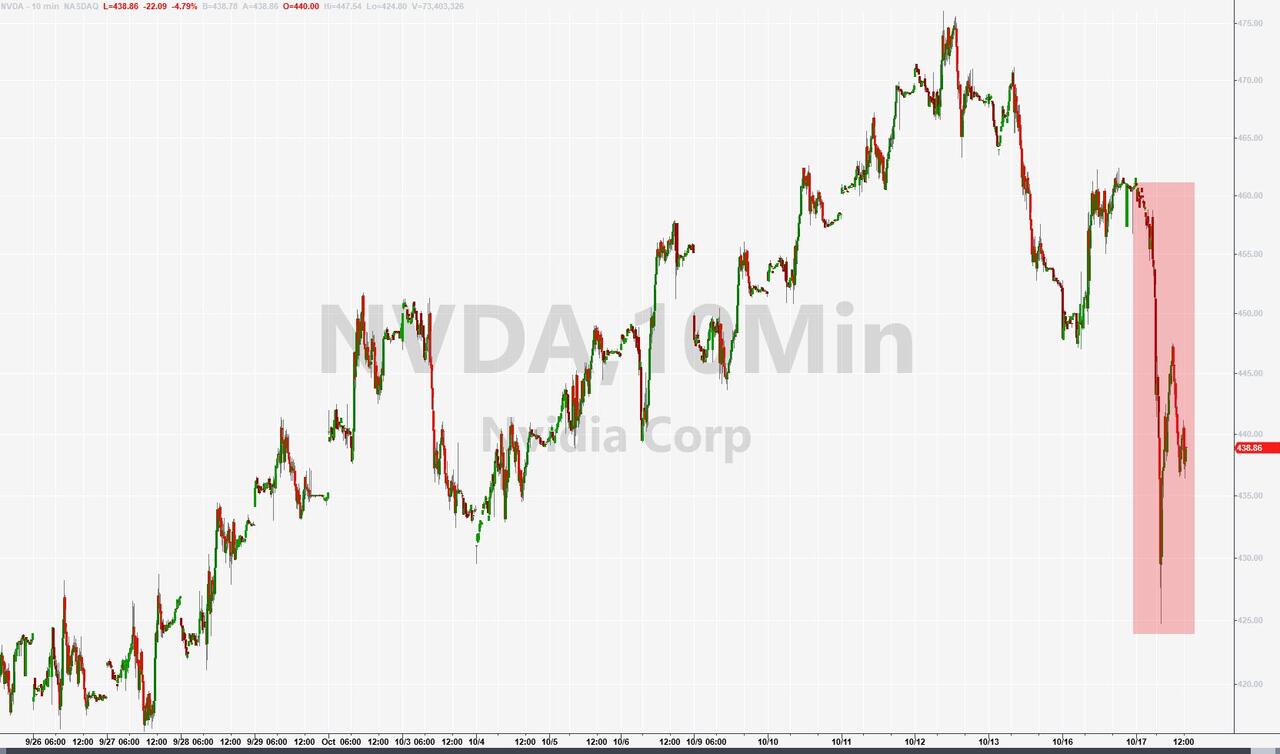
Chip stocks like Nvidia and AMD had another bad day, as the U.S. government decided to limit their sales of AI chips to China. That’s a big blow to their growth prospects, and traders were quick to dump their shares.
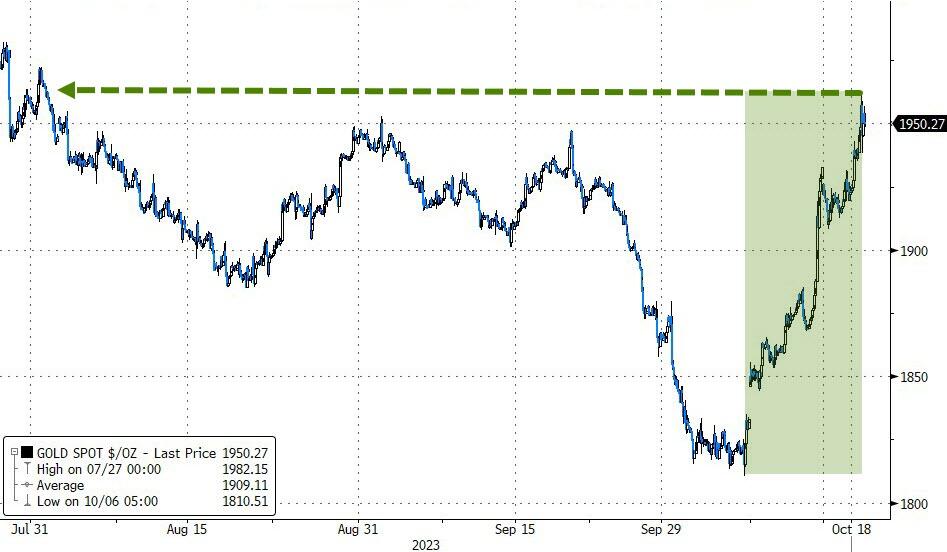
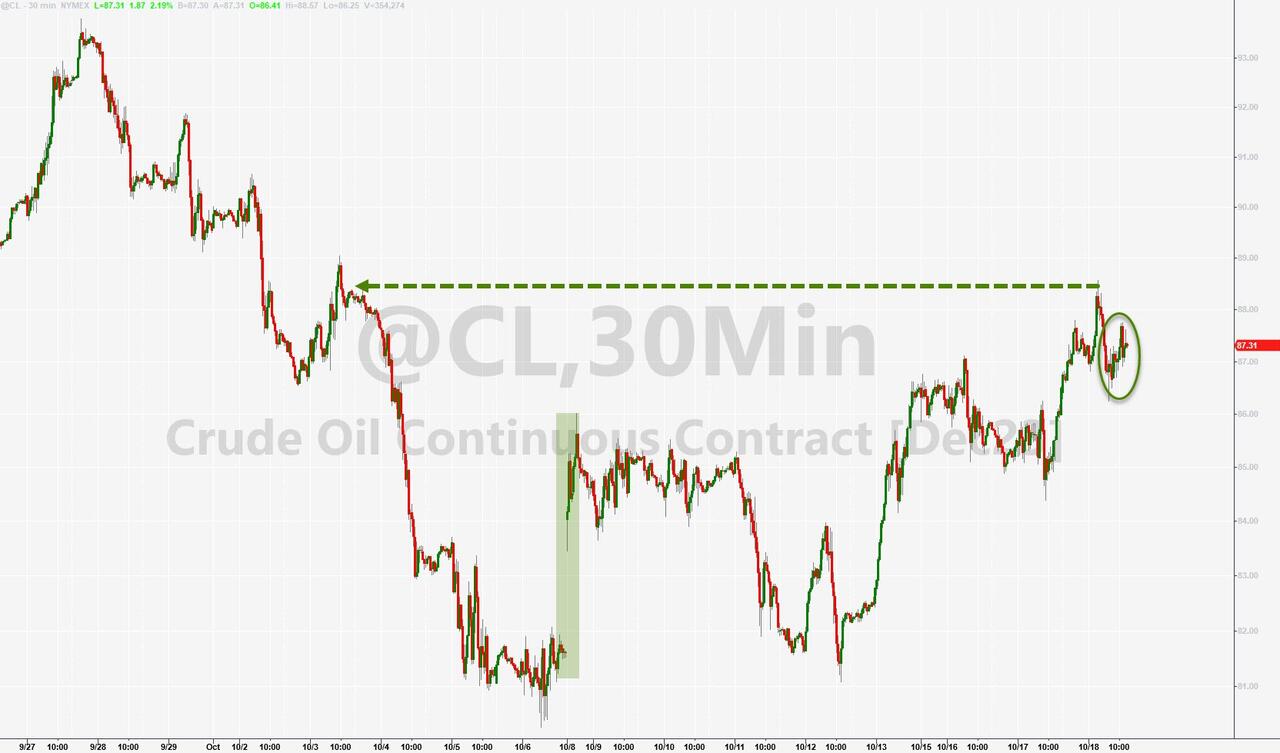
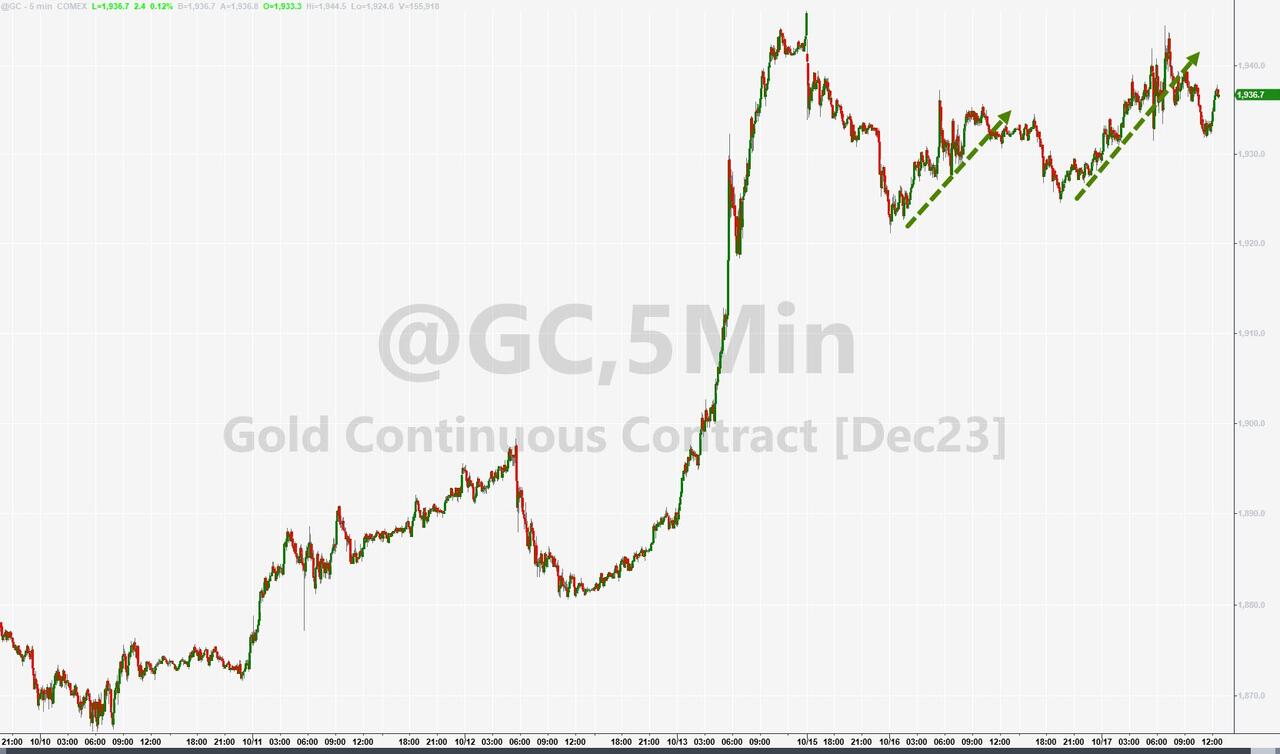
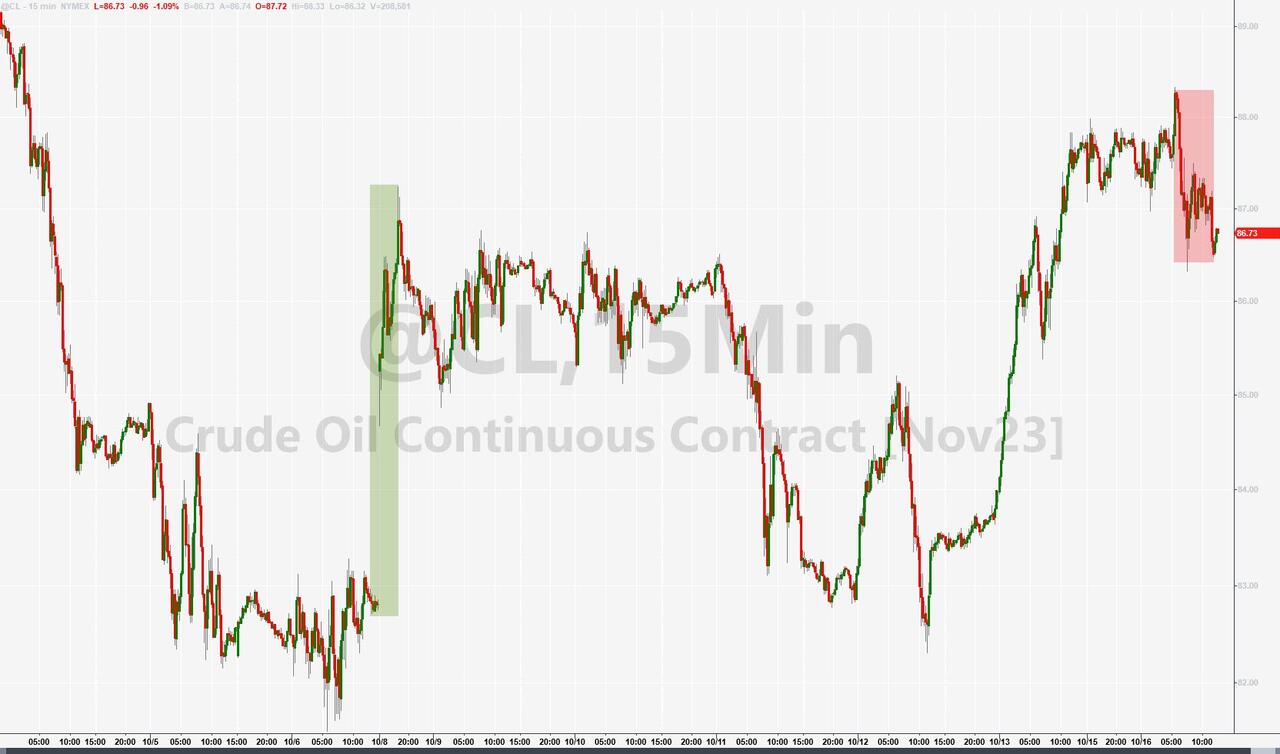
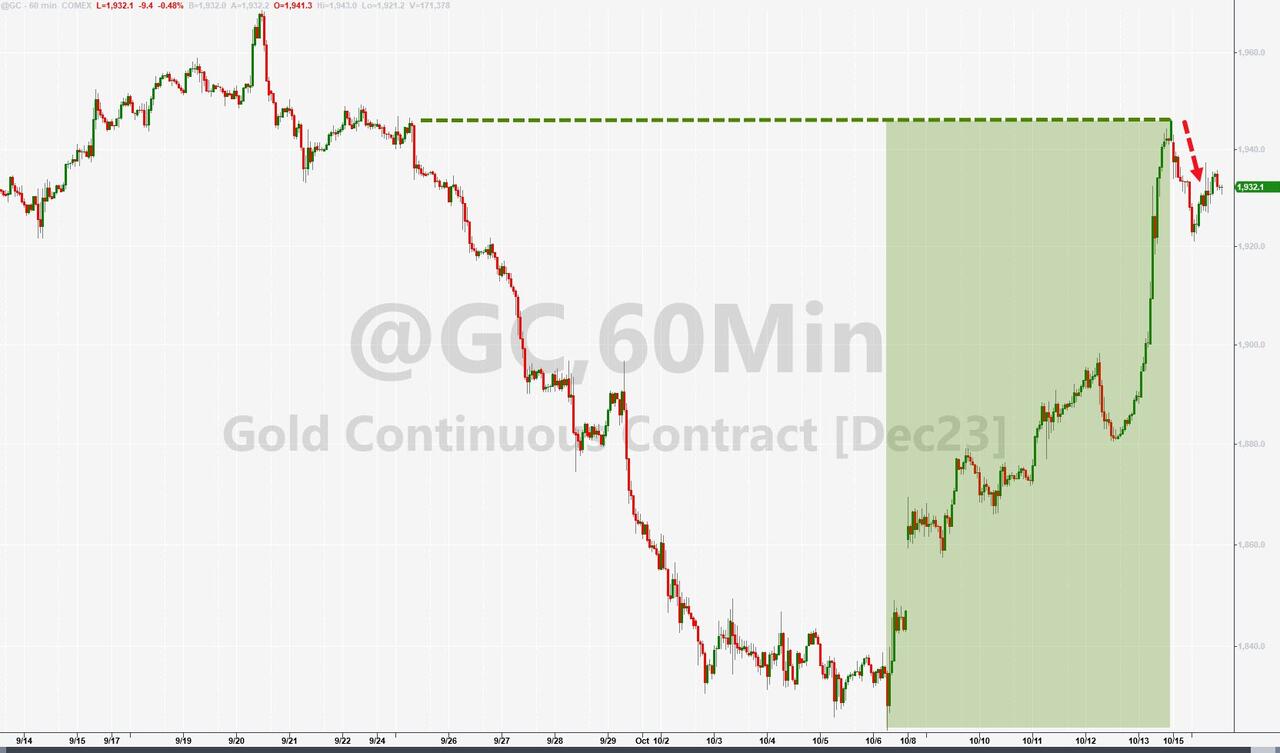
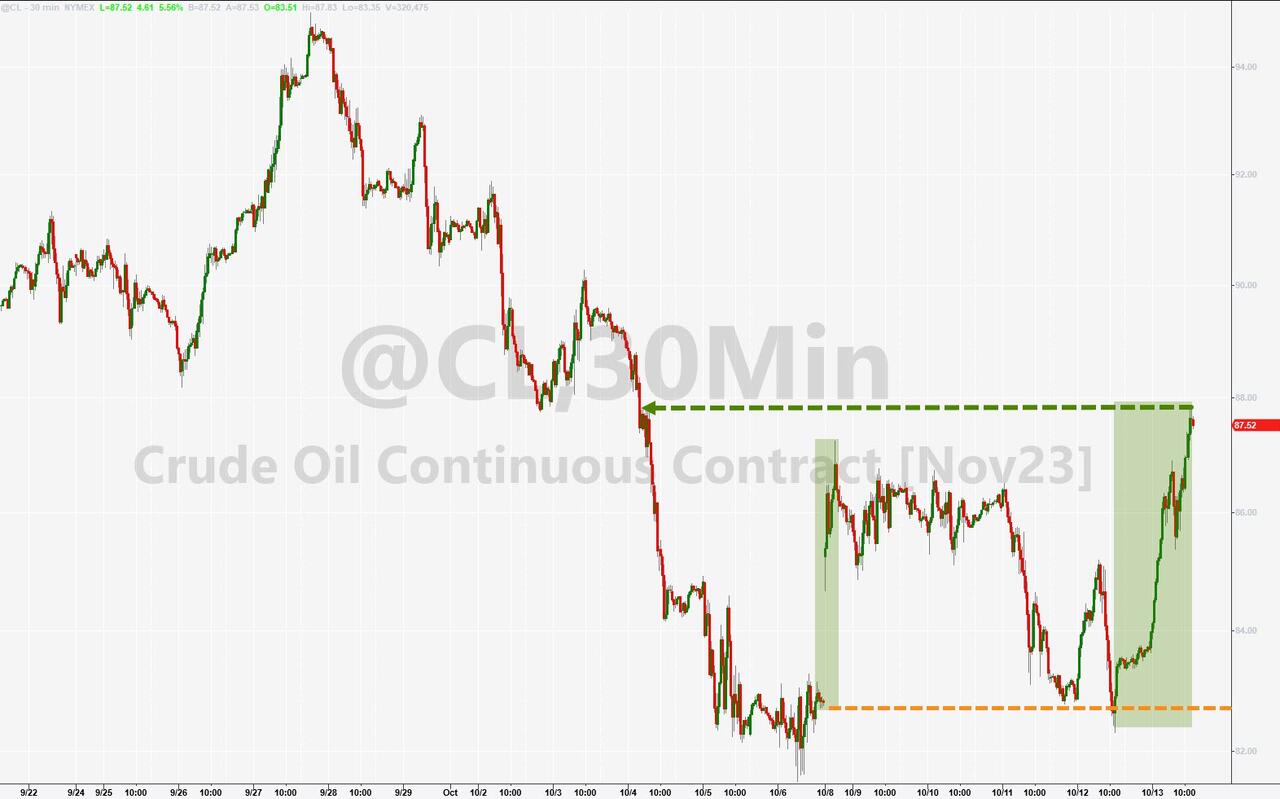
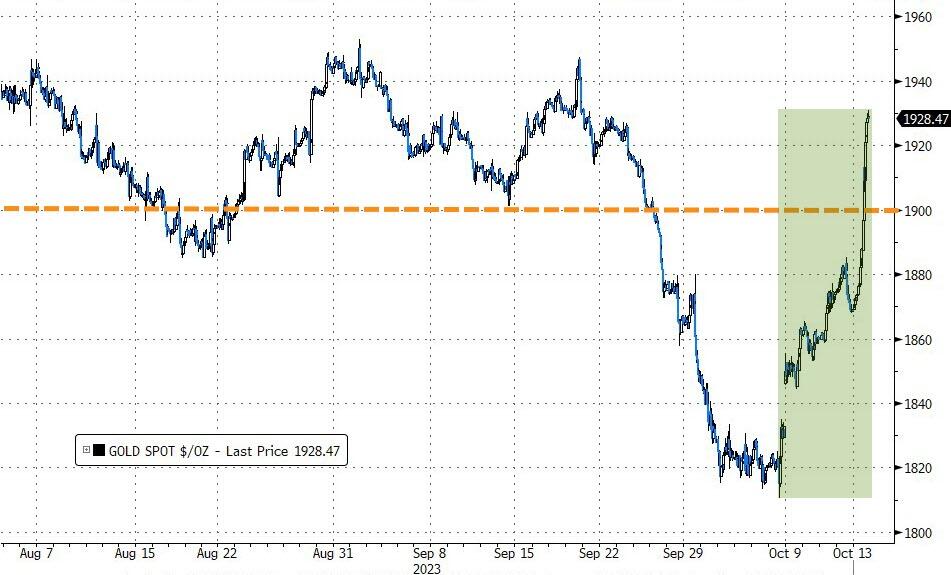
The war between Israel and Hamas also weighed on the market, as investors flocked to gold as a safe haven. Gold prices soared again, along with energy and oil stocks. They were the only ones having a good time on Wednesday.
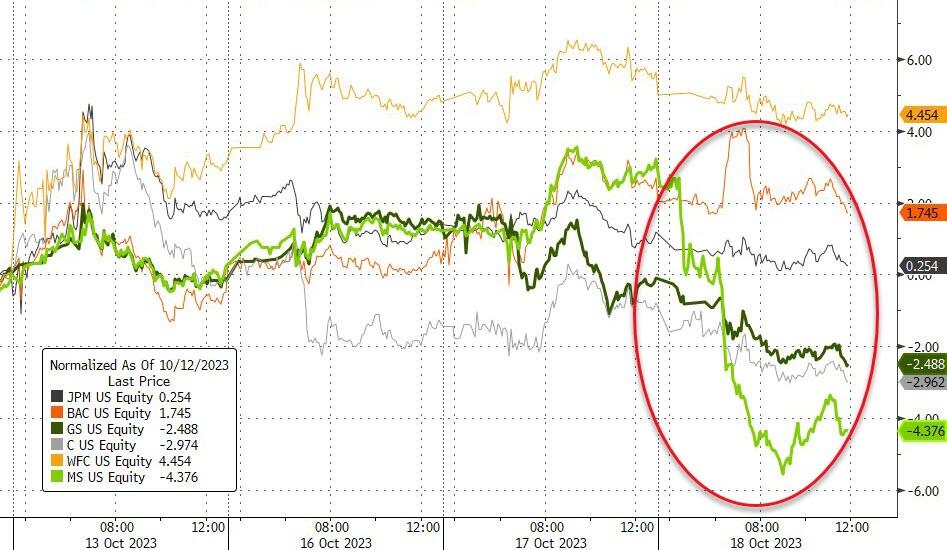
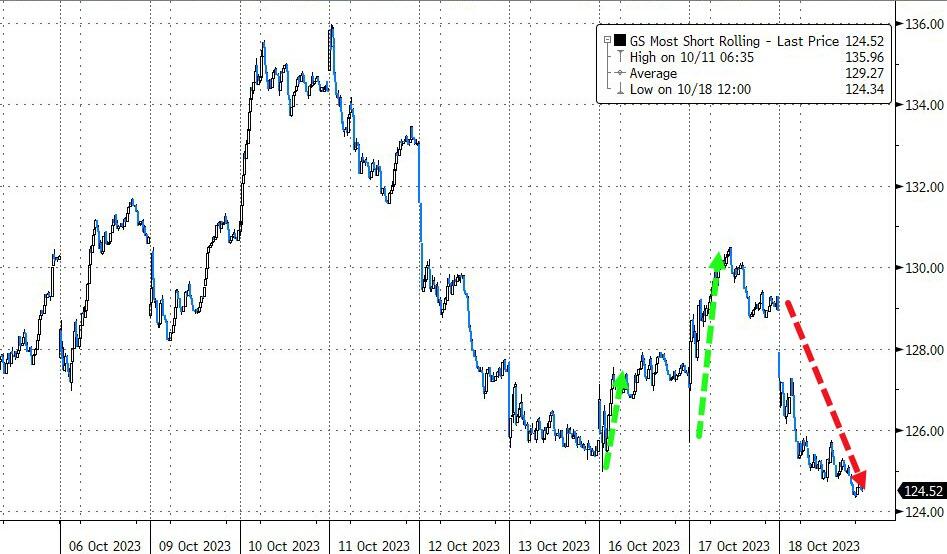
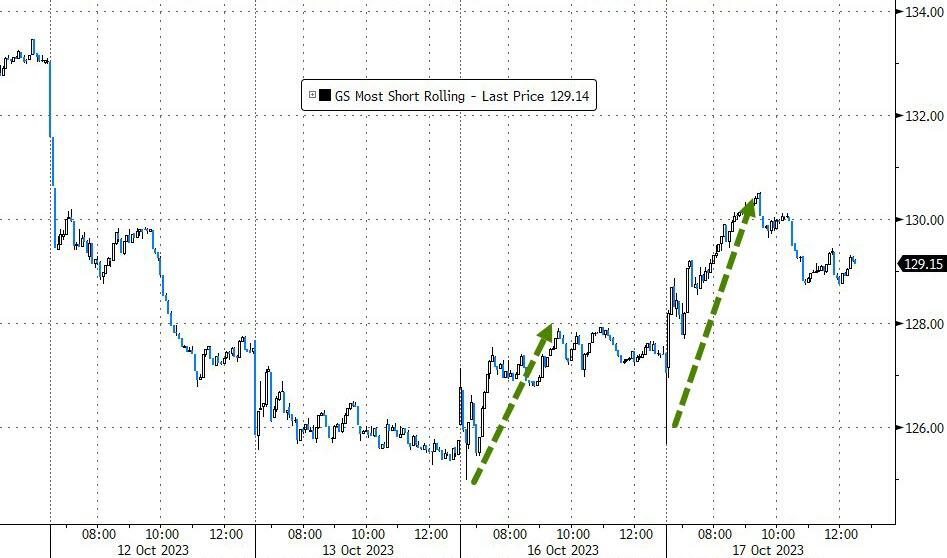
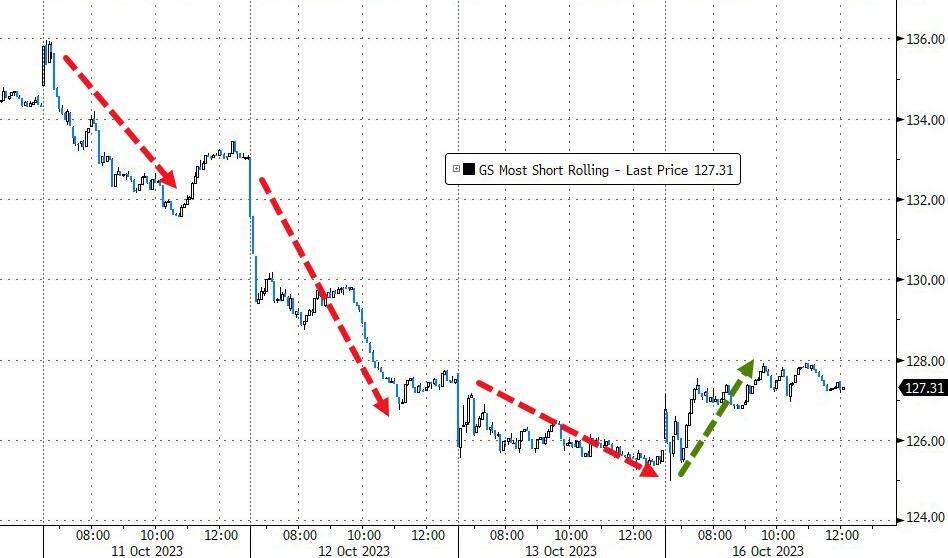
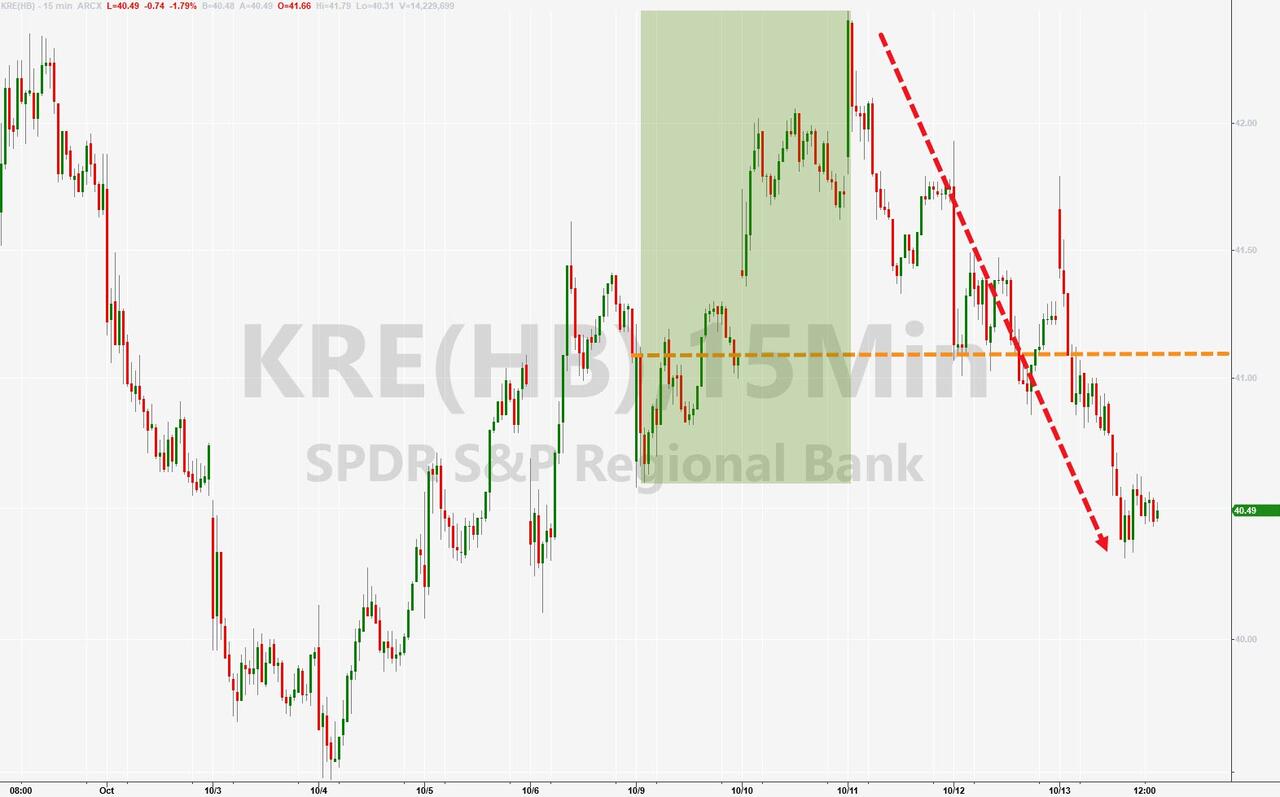
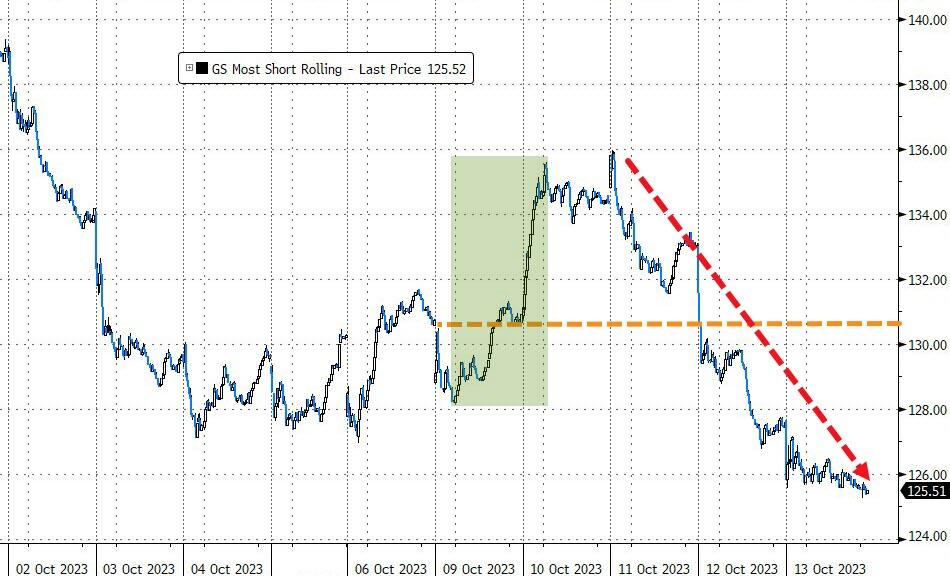
Banks were among the worst performers, especially Morgan Stanley, which dropped more than 6%. That was its worst day since June 2020. The short squeeze craze also fizzled out, as small-cap stocks took a nosedive.
With the AI sector in trouble, could we see a repeat of the Covid/Crypto boom and bust? Or is this just a temporary setback for the tech giants?
Read More
