
- Moving the markets
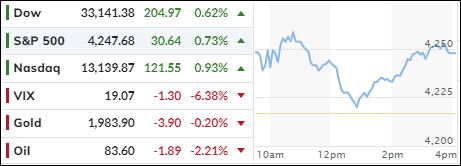
Stocks finally decided to go up on Tuesday, after changing their minds a few times, as investors paid attention to the latest earnings reports and bond yields.
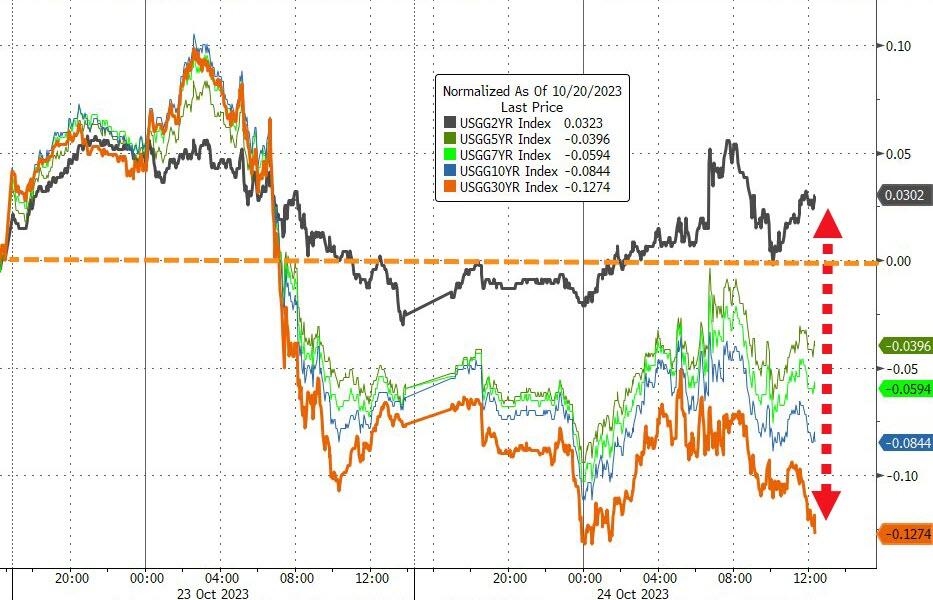
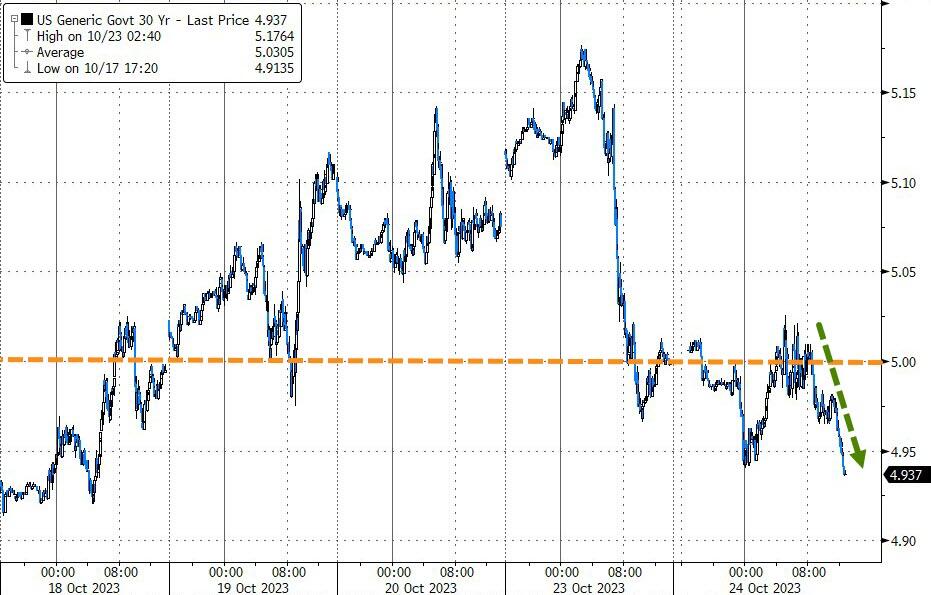
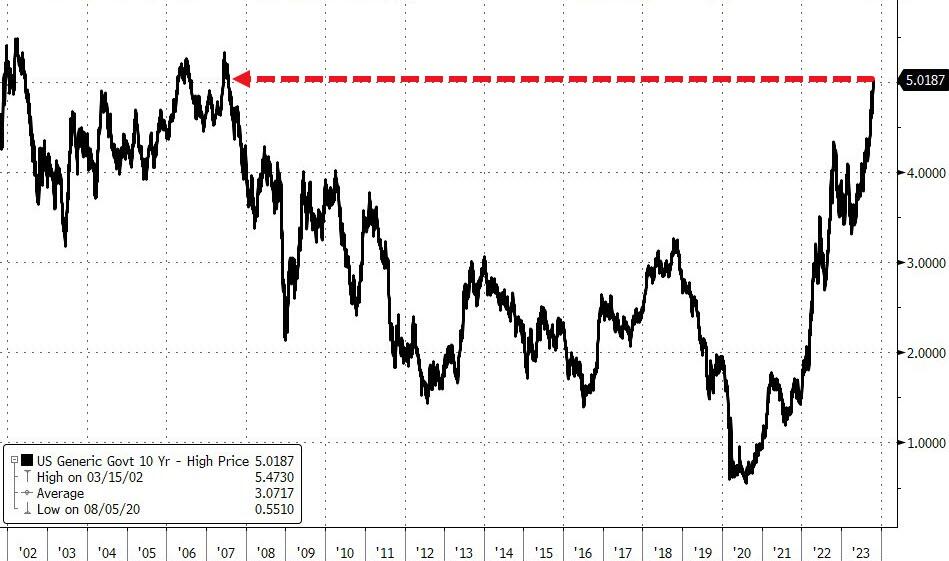
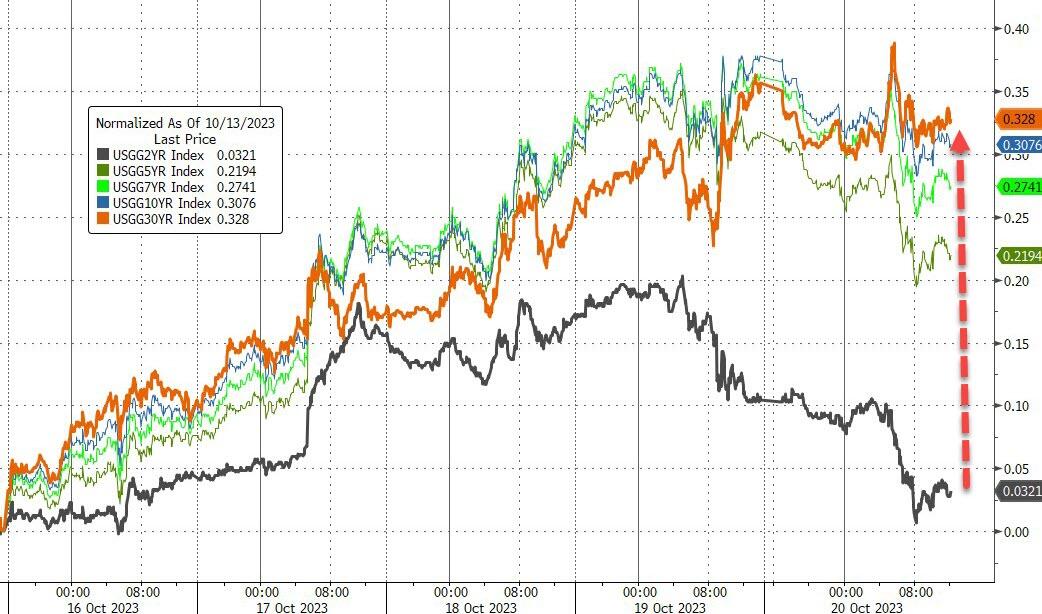
The 10-year yield stayed away from the scary 5% mark, which was a relief for everyone. Coca-Cola made more money than expected, and its stock jumped more than 3%. Spotify also did well, and its stock soared 9% after the music streaming giant impressed everyone with its third-quarter results.
Some big tech names like Alphabet and Microsoft will announce their earnings after the market closes. Others like Amazon and Meta will do so later this week.
But one analyst thinks that even if these tech giants beat expectations, they are still overvalued and overhyped. He said that their prices are too high for what they offer, and that this situation will not end well for anyone. He sounded like a party pooper. We don’t know if he is right or wrong. We’ll have to wait and see what happens.
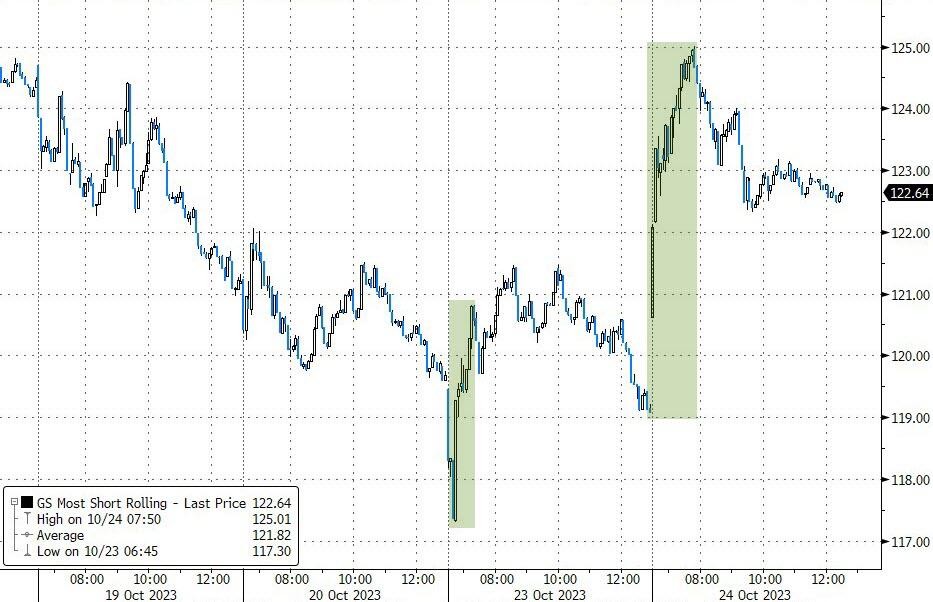
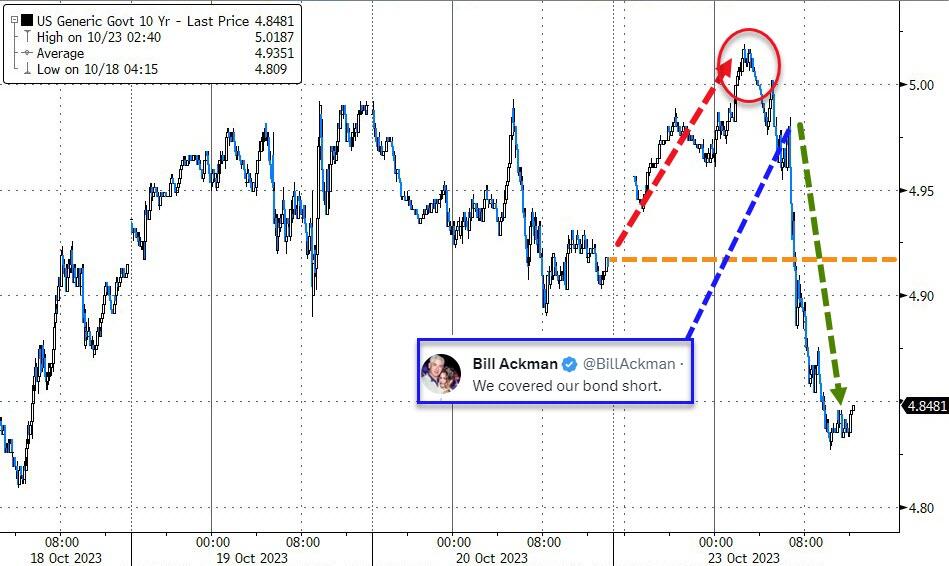
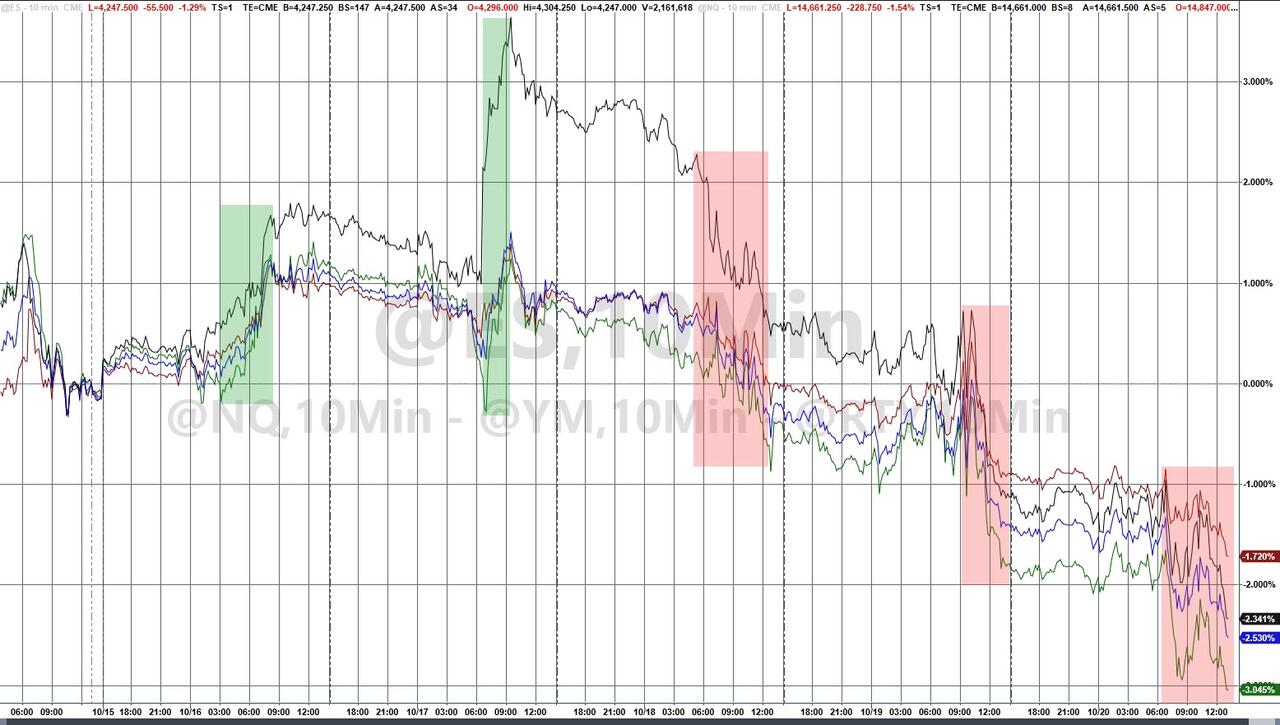
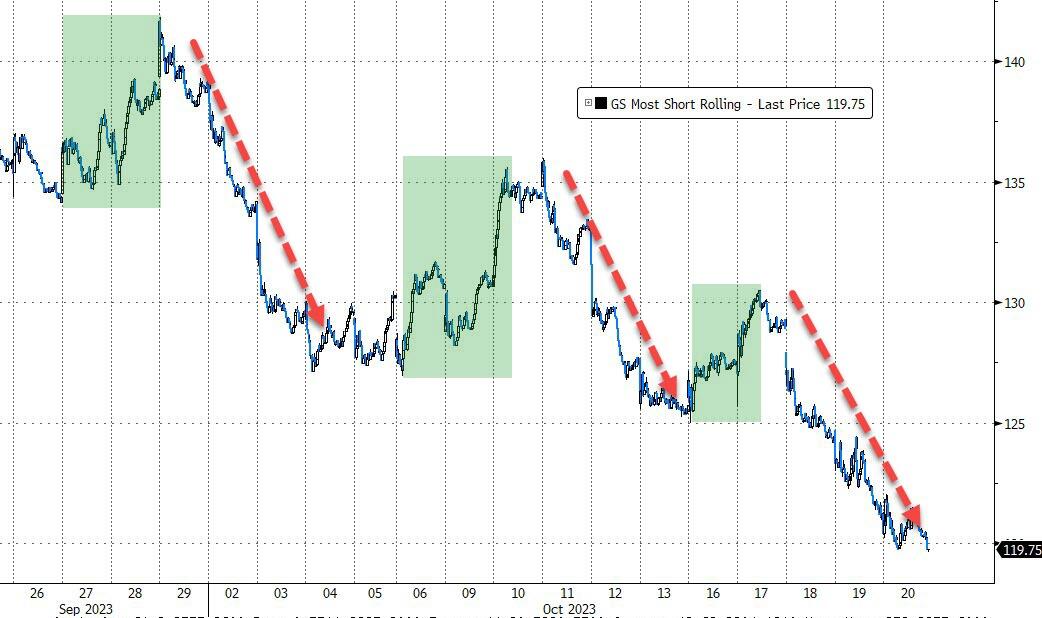
For now, the bulls managed to push the market higher, thanks to a clever move that squeezed the shorts out of the game. The major indexes ended the day in green, which was a nice change.
About 23% of S&P 500 companies have reported their earnings so far, and 77% of them have done better than the low expectations.
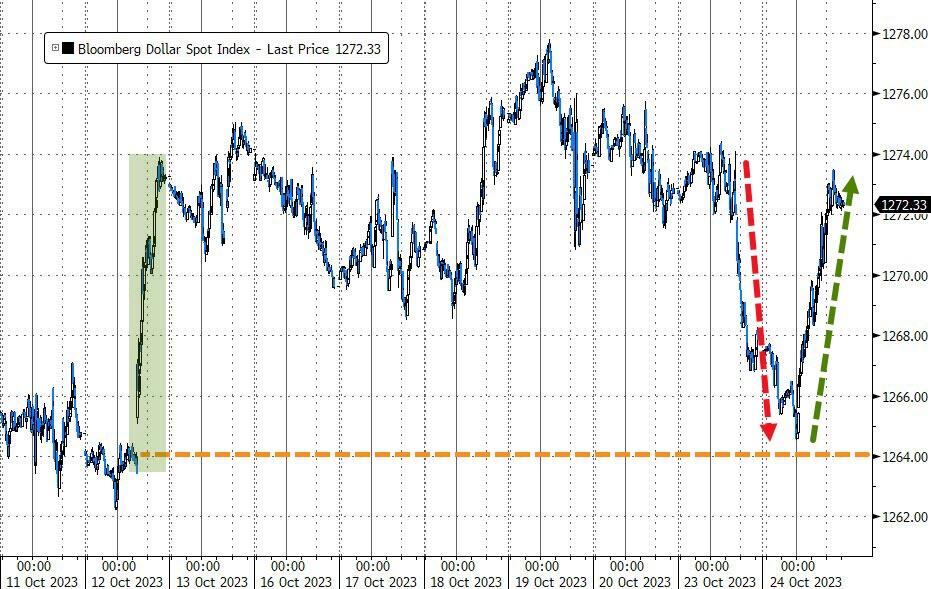
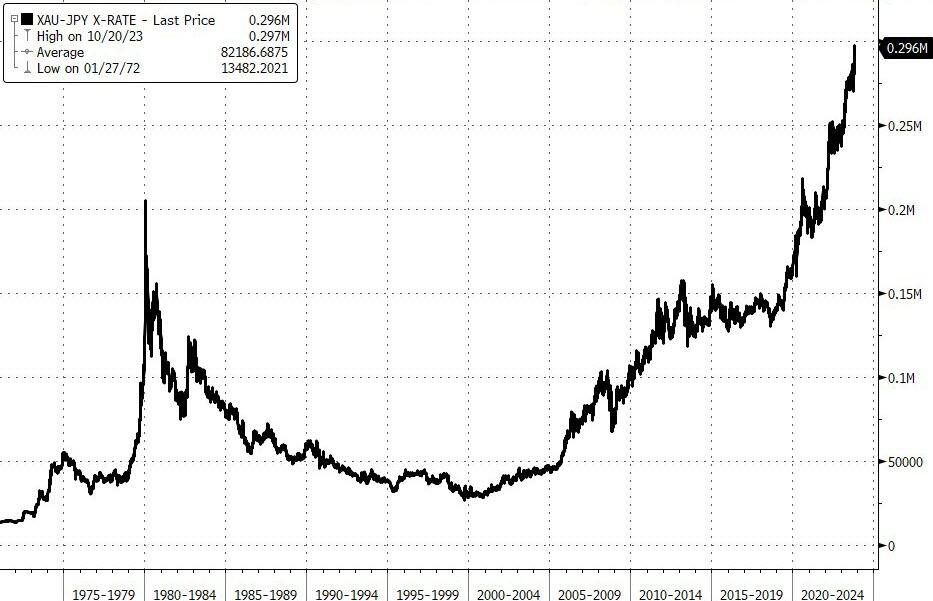
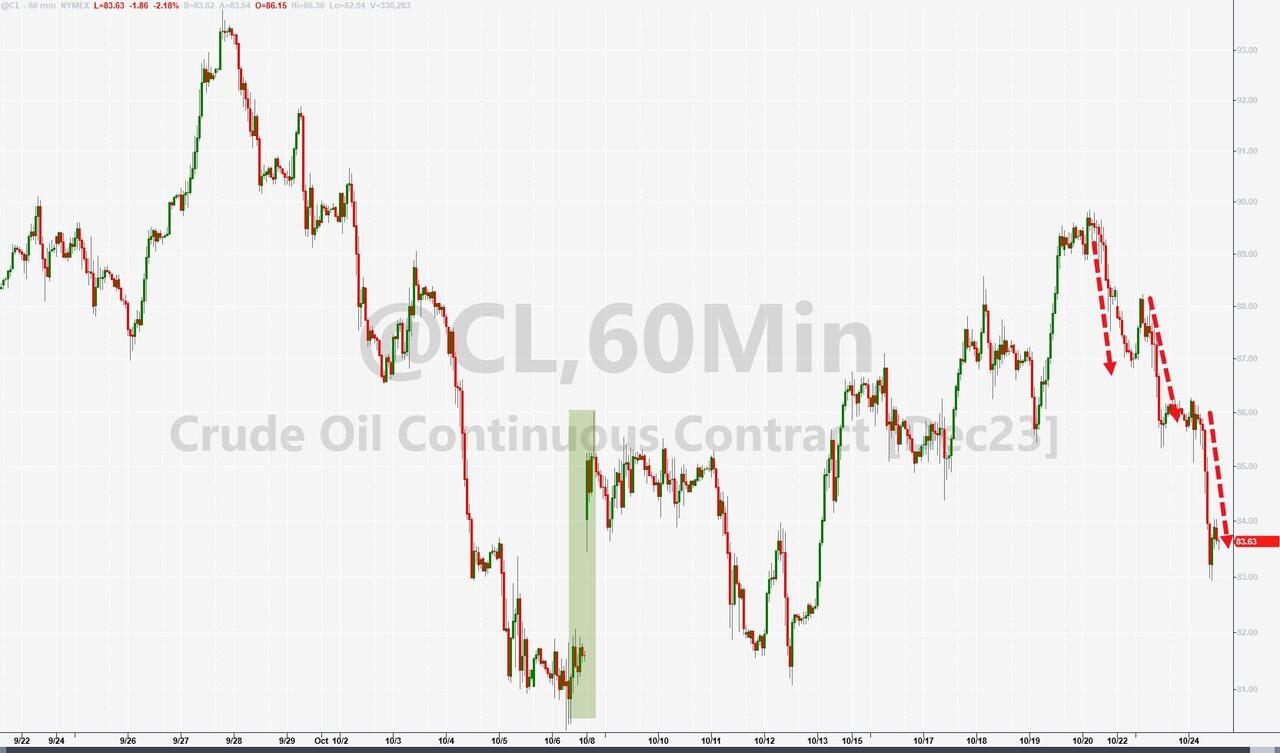
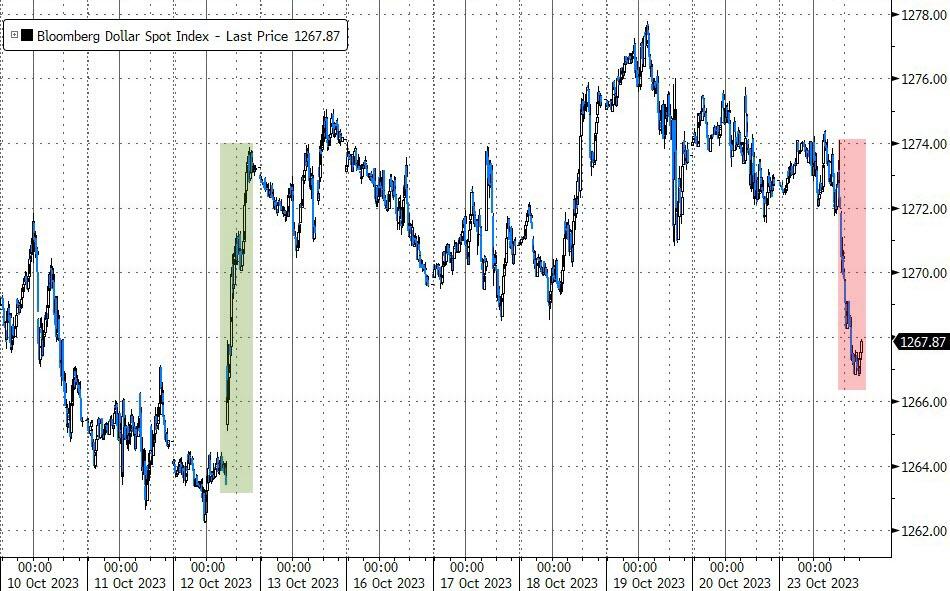
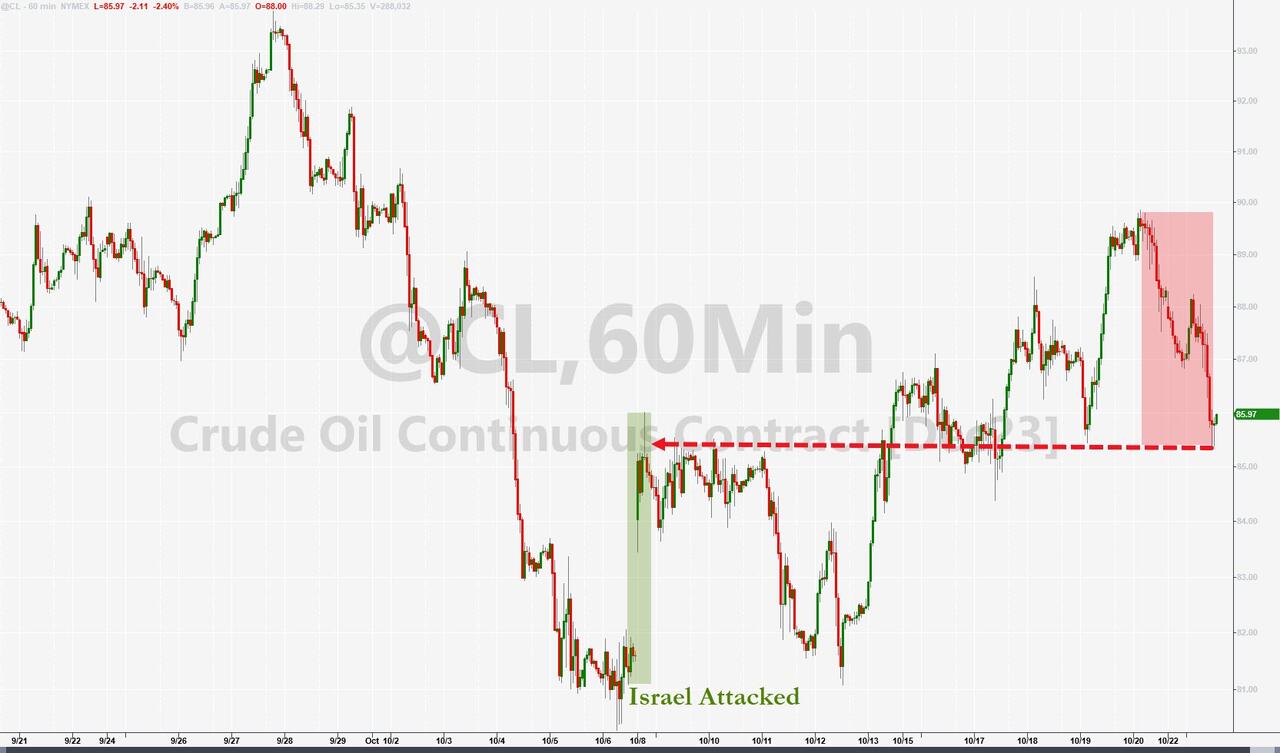
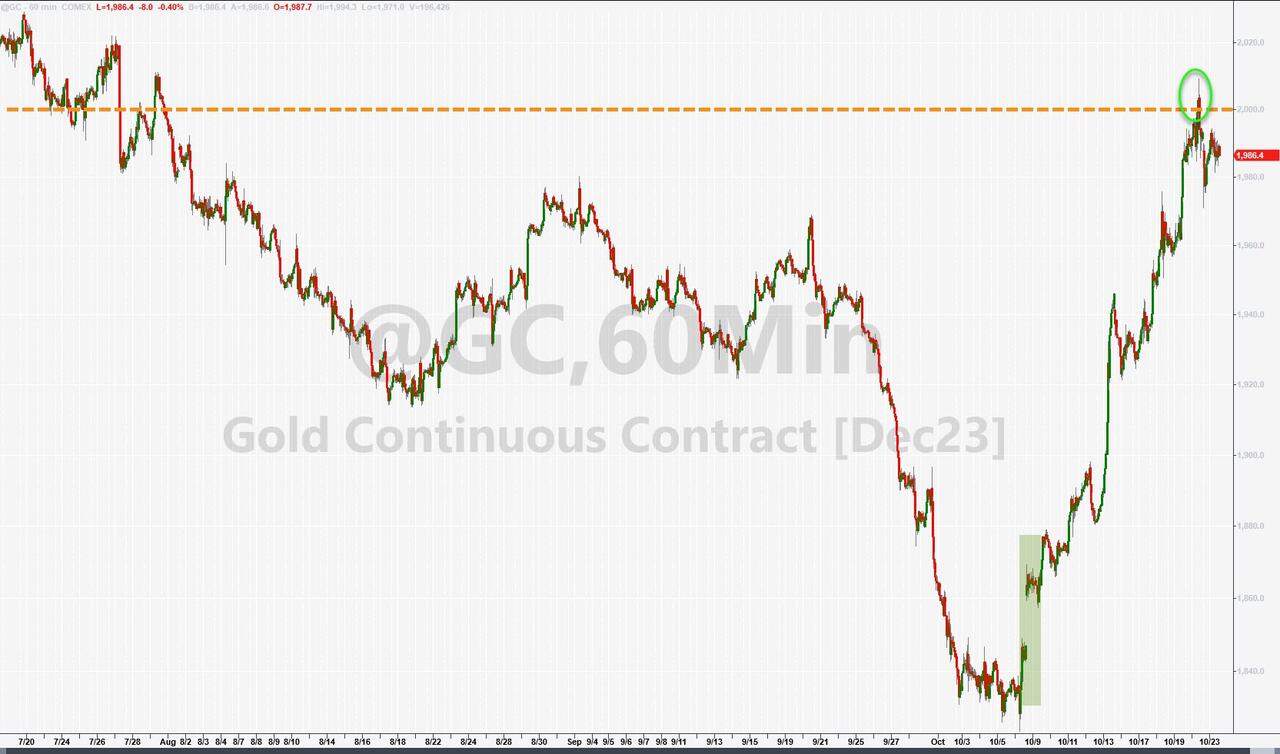
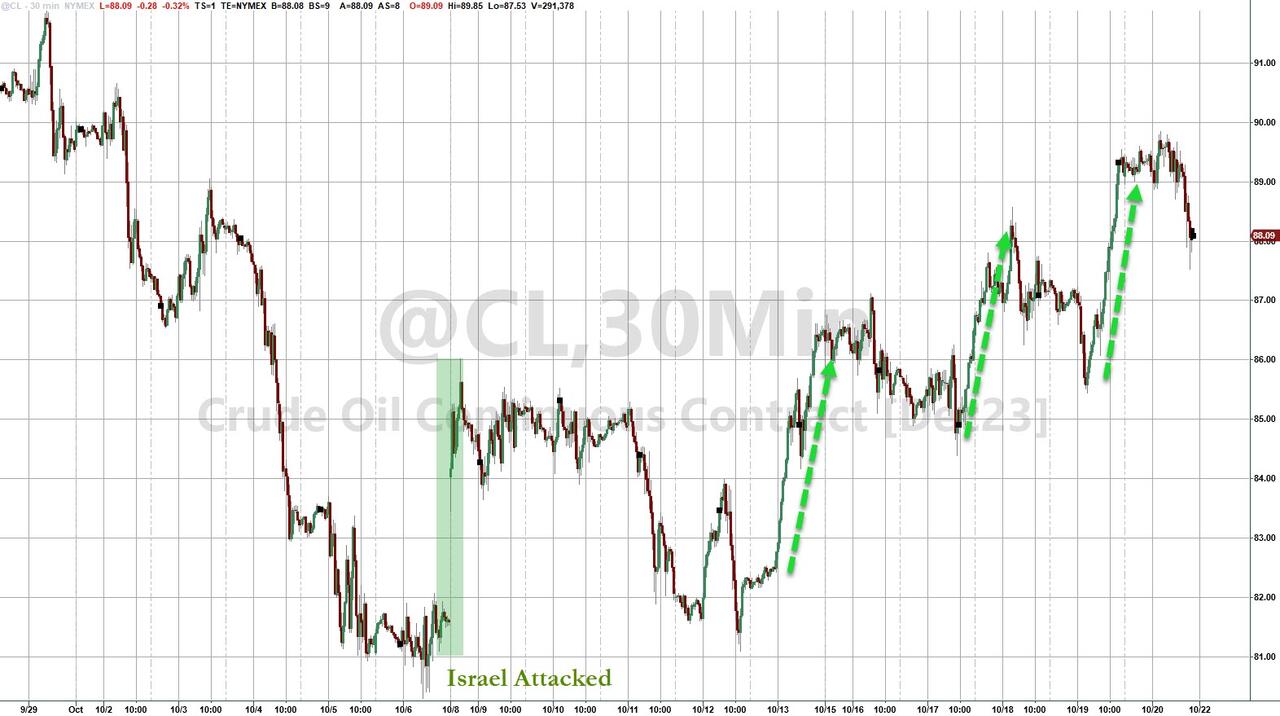
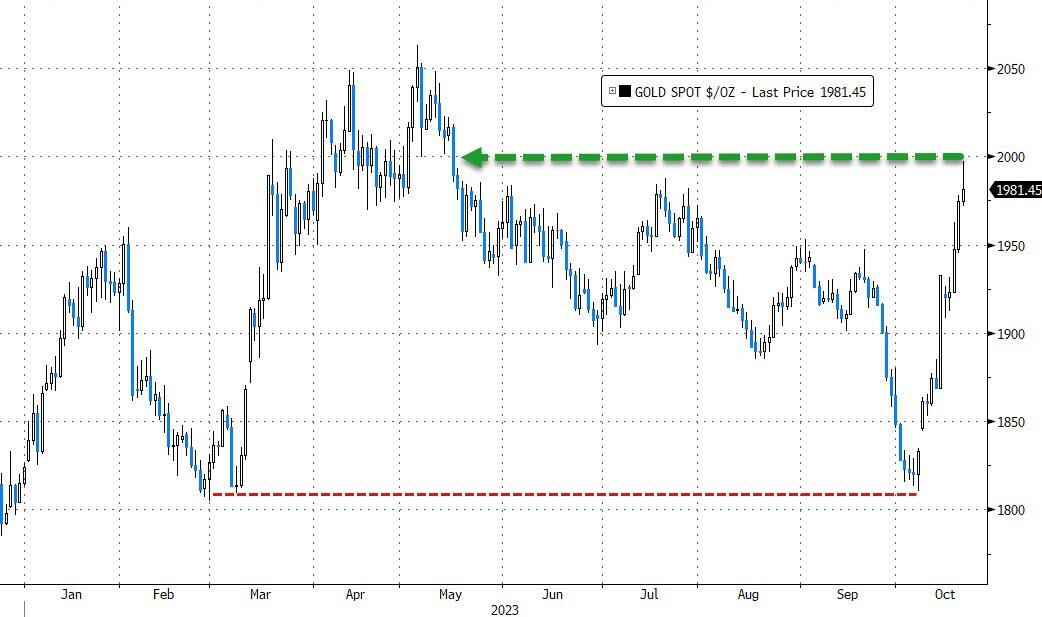
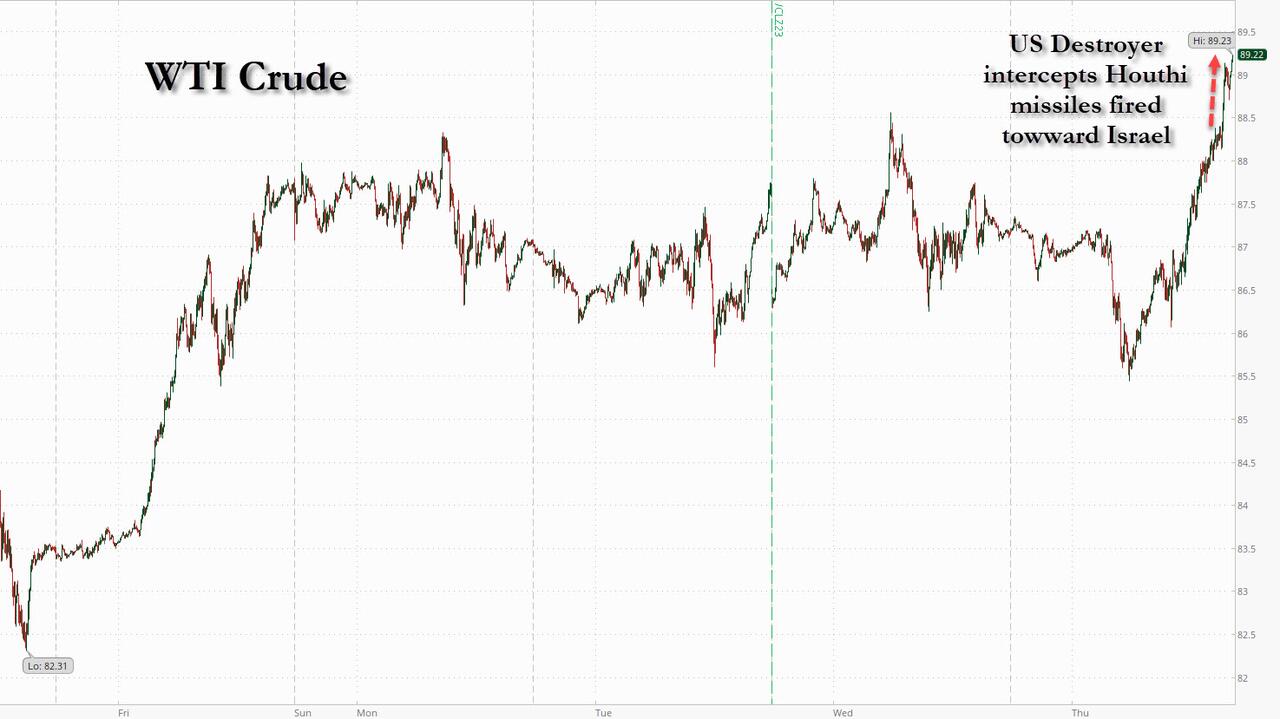
Bond yields were mixed, as the 30-year went back below 5%. The dollar bounced back from yesterday’s fall, while gold was unchanged in the U.S. but hit a new high in Japan. Crude oil got a spanking before tonight’s data, which dragged down the energy sector as well.
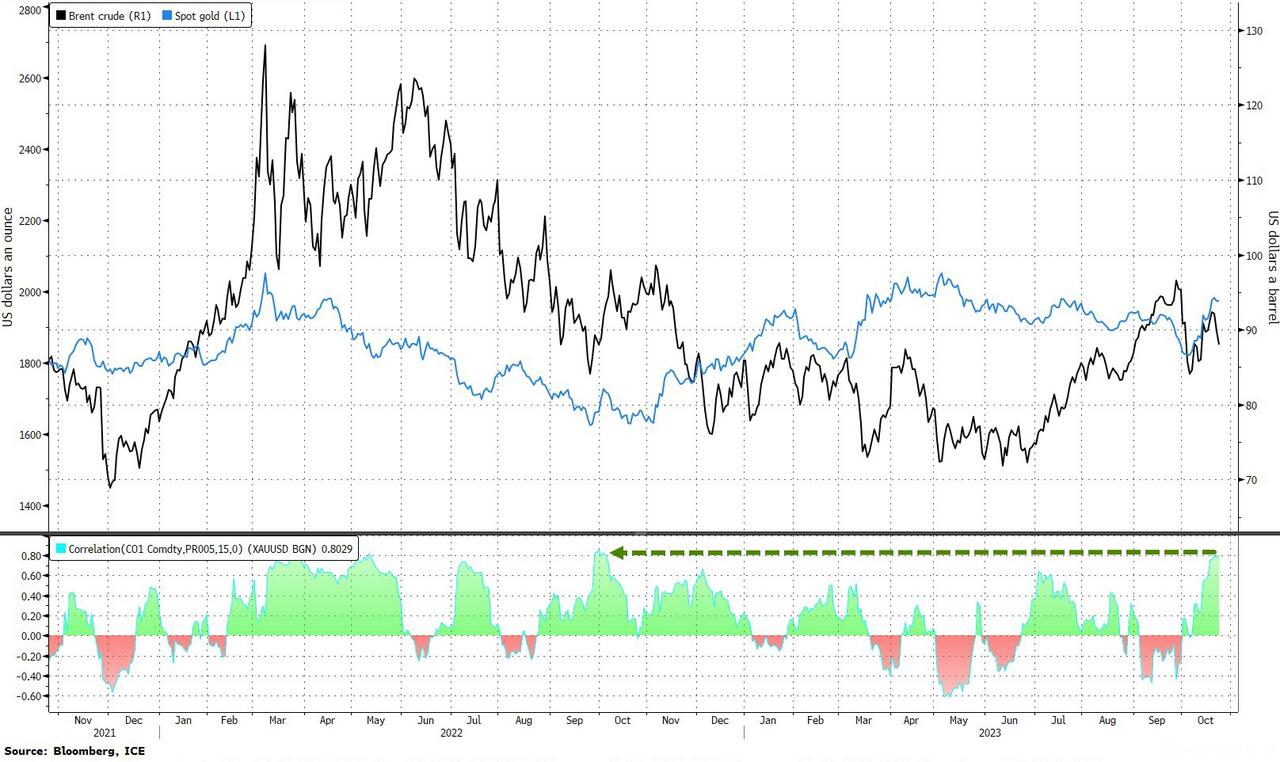
Bloomberg said that gold’s big rally since Hamas attacked Israel was linked to oil prices, which means some traders are worried about stagflation.
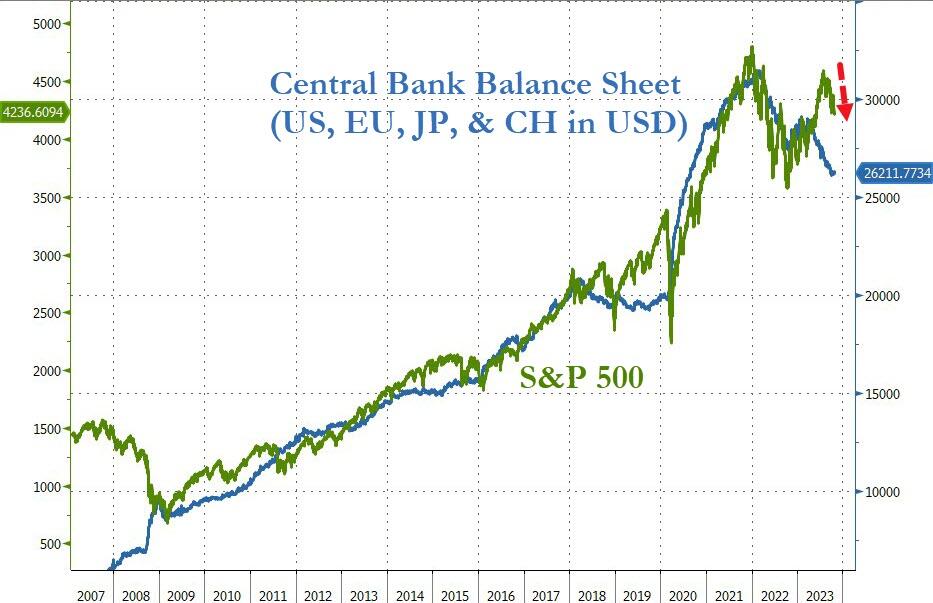
Central Banks’ balance sheets are supposed to predict the direction of stock markets. If they grow, it’s good for stocks. If they shrink, it’s bad for stocks. According to this chart, they are shrinking right now.
Does that mean the bear market is about to worsen?
Read More
