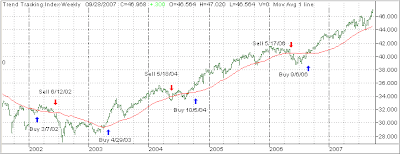
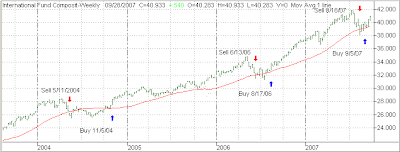
 Recently, a reader mentioned that he was using my M-Index to pick bottom of the barrel ETFs, namely real estate related beaten down indexes. My personal preference is to buy ETFs that are on the way up and not trying to catch the proverbial knife.
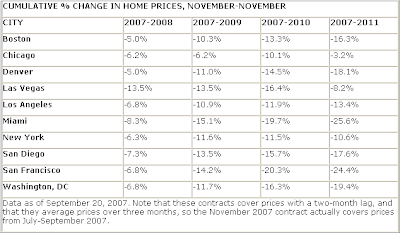
Especially, real estate appears to be the next super bubble, which may take many years to unwind. Case in point is the Chicago Mercantile Exchange’s (CME) extension of the futures market on the S&P; Case-Shiller Home Price Indexes from one to five years. Now, futures investors can make bets on where home prices will be as far out as 2011. Matthew Hougan of Index Universe featured the gloom and doom tables along with their estimated percentage change in real estate prices on the most recent futures sale on the CME:

Matthew makes 2 important points:
1. Read that chart carefully. Over the next 12 months, traders expect prices to fall in each of these cities by 5-13%. By November 2009, prices will be down more than 10 percent in every city save Chicago. By November 2010, prices will be down 20% in Miami and San Francisco, and 15%+ in San Diego, Las Vegas and Washington, D.C. It gets worse in 2011.2. As a point of emphasis, remember that these are priced in actual dollars and do not take into account inflation. Factor in 3% annual inflation and the real value of these homes falls a further 11.5% by 2011, putting prices in Miami and San Francisco down 37% and 36% respectively on a real-dollar basis. Who said house prices never fall…
Of course, there is no guarantee that this will actually happen to the exact degree, because traders are notorious for being wrong. However, my feeling is that there is certainly some validity to this down trend given what happened with the dot com bubble, which took years to unwind.
Additionally, since real estate demand was artificially inflated with the help of subprime borrowers, which have now been eliminated, you have to wonder where the next driving force will come from.


