No Load Fund/ETF Tracker updated through 5/18/2007

Ulli Uncategorized Contact

My latest No Load Fund/ETF Tracker has been posted at:

http://www.successful-investment.com/newsletter-archive.php

Another notch in the bedpost for the bulls.

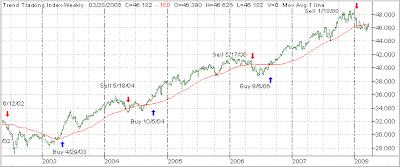
Our Trend Tracking Index (TTI) for domestic funds/ETFs now sits +5.57% above its long-term trend line (red) as the chart below shows:


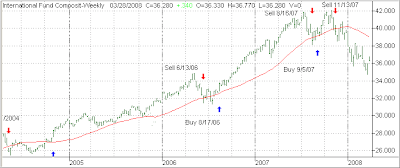
The international index has now moved to +10.03% above its own trend line, as you can see below:

For more details, and the latest market commentary, as well as the updated No load Fund/ETF StatSheet, please see the above link.

From the ETF/No Load Fund Files: Active vs. Passive Investing

Ulli Uncategorized Contact

I came across another article (thanks to reader Nitin) in the NYT called “In Investing, Passive Beats Active.”

It’s the same old story, which makes the case for lower cost index funds beating actively managed mutual funds—most of the time. Sure, all things being equal, if I were a Buy-and-Hold investor, it would make sense to use a less expensive ETF over a more costly no load fund. If performance is very close, the lesser expensive vehicle would come out ahead over time.

However, as I said before, articles like this can create a false sense of security, in that an investor only looks at bull market performance and doesn’t realize that both vehicles will go down sharply in a bear market.

To give you a different perspective, and to add a dose of reality, I have included some of my actual Trend Tracking data for the past 6.5 years. The period covers our Buy and Sells from 10/13/2000 to 3/30/2007. However, I am obliged to state that past performance is no guarantee of future results.

Here’s the performance for the above 6.5 year period:

S & P 500: +3.41%
FDGRX: -12.53%

I used the widely held FDGRX fund as an example. You can plug in any fund you wish and see what answer you come up with. The data used for FDGRX were the adjusted closing prices as listed in Yahoo Finance.

This result obviously supports those in favor of index investing.

Next, I was curious to see if the extremely meager S&P; 500 Buy and Hold results could be improved, if an investor using this index would have invested using my Buy and Sell points for the same period. Here’s my actual Buy/Sell matrix:


I inserted the S&P; 500 figures and came up with a gain of almost 41%. In my advisor practice, we followed these Buys and Sells with actively managed no load mutual funds and the result was a gain of +53%. In this case, indexing lost out.

There you have it. If you’re using Buy & Hold, over time, including a bear market, you’ll be ahead using index funds as my example shows.

If you’re following trends, actively managed mutual funds (or a combination with indexes) appear to be the better solution based on the above data.

If you decide to play with this and insert your fund holdings, please share your results with me.

Technical Analysis: Can It Forecast Market Behavior?

Ulli Uncategorized Contact

The short answer is: To some degree and in certain cases. Why bring it up?

A client e-mailed me this past weekend because he noticed a phenomenon on the domestic Trend Tracking chart (TTI). Since he is very much interested in technical analysis he observed that, a few weeks ago, the TTI “gapped” to the upside. Could that have any significance on future market behavior?

What does he mean? Take a look at the weekly TTI chart below:


Notice the red arrow pointing at an area where the chart shows a gap. That was caused by the highest price of the previous week being lower than the lowest price of the following week thereby creating a gap. Here’s a section of the chart detailing what I mean:

If you look at this chart, or any chart for that matter, you’ll find upside breakaway gaps occurring on extremely bullish sentiment, where the markets simply open higher and never look back. The opposite is true on the downside, where a breakaway gap identifies extreme weakness.

Having looked at thousands of charts over the past 25 years, I have to concur with what technical analysts are saying: Breakaway gaps will always be closed. That means that prices will eventually come back down to “close” the gap.

This is not a timing indicator, because you don’t know when it will occur, but it will happen. Prices may decline to a point slightly below the beginning of the gap (and rebound), or go past it.

While this is an interesting phenomenon, it has no effect on my decision making process. However, when the markets retreat, this point may very well coincide with some of my trailing stop losses.

Knowing that this occurs with regularity, let’s re-visit the above TTI chart in the future to see if the theory of the closing of the gap can be confirmed.

Are 401(k) Plans Ready For ETFs?

Ulli Uncategorized Contact

I just read an article in the WSJ called “Exchange Traded Funds appear in 401(k)s.”Some providers like WisdomTree Investments are rolling out funds invested in ETFs.

Keep in mind that these offerings are still in an infant stage and improvements should materialize once this market matures. This story alerts you to some of the pros and cons and also reinforces what I have been saying before: Many of the 500 ETFs are focused on small and narrow market segments and are, in many cases, more of a gamble than a long-term investment.

Should You Re-Invest Your ETF Dividends?

Ulli Uncategorized Contact

A few days ago, I posted about the tremendous increase in assets ETFs experienced over the past few years.

I also mentioned that, once pension plans and 401k make ETFs available to their investors, more money should flow in that direction. Several readers pointed out that a problem could be the transaction fees of ETFs for re-investing dividends.

I did not think that there were transaction charges for re-investing dividends; a call to my custodian (Schwab) confirmed that this in fact is true—no fees. If you have your assets housed with a different firm, you might want to verify this. Whatever you find out about this topic, I’d appreciate it if you would post your findings in the comment section below.

While on the subject, should you re-invest dividends at all? There are different views, and I understand all about compounding your earnings. However, if you are investing with a taxable account, you should definitely reconsider.

If you are invested in a no load fund or ETF that pays regular dividends, your year end basis calculations could be a nightmare, or at least require some time commitment on your part. Your tax preparer will not want to do it.

The other choice is, one that I favor, to let your dividends accumulate. They will earn interest in the money market portion of your account and compound that way. Once you have a more substantial amount collected, say a few thousand dollars, invest the lump sum.

This will also give you the opportunity to put your money in a different fund/ETF at that time, in case the one that generated the dividends is no longer a great performer.

Which No Load Fund Is better: CVGRX or CAAPX?

Ulli Uncategorized Contact

The following story made me chuckle because the answer surprised me and may surprise you as well.

MarketWatch had an interview with Morningstar mutual fund analyst Marta Norton. The point of the interview was Marta’s contention that funds should earn their place in your portfolio by “meeting future expectations” rather than past performance. As an example, she mentioned CVGRX and CAAPX.

Hmm. How do you do that?

Being a numbers person, I first compared the 2 funds against each other over 2 years, 5 years and 10 years. The 2 year comparison is shown below:

It appears that, based on those numbers, CVGRX is the clear winner. Add to that Morningstar’s (in my view useless) ranking of four stars for CVGRX vs. three stars for CAAPX and, to the casual observer, the case for CVGRX is further supported.

To prove her point, however, Marta put a hold rating on CVGRX suggesting that recent performance and asset growth could hinder future returns. At the same time, she put a Buy on CAAPX.

This is confusing. Morningstar has always promoted their star rankings as the ultimate in comparing funds before you buy. Has that now changed? Are they weighing other factors?

While I don’t subscribe to their theory, I thought it would be interesting to compare these funds side by side using the momentum data from my weekly StatSheet. Here’s what I found (double click to enlarge):

It’s obvious that, based on all momentum figures for our current buy cycle, CAAPX came out ahead.

Does that mean that Morningstar is now looking at shorter term numbers to identify funds with good growth potential or are they perhaps (anonymously) subscribing to my StatSheet? (Humor attempt)