 Mish at Global Economic Trend Analysis reviewed the demographics of jobless claims and in his article he referred to the credit binge as follows:
The structural problems created by a 25 year credit binge simply are not going to be cured by a two quarter recession that Paulson and other economic cheerleaders will not even admit has started. Peter Bernstein a financial manager, consultant and financial historian agrees. Inquiring minds may wish to take a look at a Wall Street Journal Interview with Peter Bernstein.
I read the interview with the 89-year old Bernstein and found it worthwhile to share with you. Here are some excerpts:
WSJ: Aside from securitization, what were the main causes of the problem?
Mr. Bernstein: You don’t get into a mess without too much borrowing. It was sparked primarily by the hedge funds, which were both unregulated by government and in many ways unregulated by their owners, who gave their managers a very broad set of marching orders. It was a real delusion. It was like [former New York Gov. Eliot] Spitzer: “I am doing something dangerous, but because of who I am, and how smart I am, it is not going to come back to haunt me.”
When you think about how all of this will work out in the long run, we are going to have an extremely risk-averse economy for a long time. The lesson has painfully been learned. That’s part of the problem going forward. You don’t have a high-growth exit from this, as you’ve had from other kinds of crises. We won’t have a powerful start, where the business cycle looks like a V. Here, the shape of the business cycle is like an L, where it goes down and doesn’t turn up. Or like a U, a flat U. The reason for that is that people aren’t going to get caught in this bind again. They will tell themselves, “I’m too smart to do that again.” And everyone else is going to be saying the same thing. It is, in fact, going to be a wonderful environment in which to take risk, because there aren’t going to be any excesses.
I’m a child of the Depression, and I am thinking about what the early years were like after World War II. It took a very long time to get the memory of the Depression out of business decisions, and certainly banking decisions. I think this is going to be the same. The Fed, too, is going to be less decisive and is going to feel that what it should do is less clear. One of the things that gave people a sense that they could afford to take risks was the sense that the central bankers more or less know what they are doing. But I don’t think we are going to feel that way going forward.
WSJ: You said that it could turn out that the smart thing to do is to take more risk, because everyone will be so risk-averse. What kinds of investments do you see as the big winners coming out of this?
Mr. Bernstein: You could say: the things that have been beaten down the most, which would be real estate. But I think real estate is going to be under a cloud for so long, and you can’t buy real estate with cash, it is too much money. I think you should go with the stock market. If things are better, the stock market will go up, and if things are awful, the stock market is going to be way down. But it is a place where, if you want to take risks, you’ve got a wide range of choices. This is why I own stocks [in addition to other investments], because I don’t know where the bottom is going to come, and I want to be exposed to every kind of possibility I can think of. And, at least, if you pick the stock market and you are wrong, you can change your mind. There is some liquidity there. Stocks never became cheap, but they didn’t become crazy, the way other assets were.
WSJ: How long do you think this whole process will take, before we get back to normal?
Mr. Bernstein: Longer than people think. The people who think we will have turned in 2009 are wrong. There has to be a respite along the way. Nothing goes in one direction forever. But it will take longer than people think. If that weren’t the case, I would be talking entirely differently. I would be saying, “What an opportunity we have got.” And I just can’t believe that the opportunity is here yet. There is too much to unwind.
WSJ: Can you explain the reason you think it will take a long time?
Mr. Bernstein: We have to go back to a moment when people have the courage to borrow and lenders have the courage to lend. Until credit is going up instead of down, you can’t have growth. Housing has got to be a very important part of that; it always has been. You have to reach a point where somebody says, “This house is cheap, I am going to buy it,” or where some businessman says, “This is a great opportunity for us to expand our business. Everything is available to us.”
If China goes into a recession, God knows. The Iraq war and the whole situation with terrorism, we really don’t know where that is going to come out. There are so many things that have got to get buttoned down before you say that the future looks good enough to take a risk.
WSJ: What kind of indications are you looking for as signs that the economy is about to get better and that the stock market and the investment world are about to turn the corner?
Mr. Bernstein: Somehow, the housing trouble has to at least flatten out. As long as that is going on, I think the pressure on the credit system is going to persist. It is kind of the leading indicator. It is where the trouble started. We have to underpin the consumer. That is why this is different. That is why this is like nothing we have had before.
Before, it was investment that made the V at the bottom of the business cycle. I don’t see real investment turning enough without some sign from the consumer side. Maybe the foreign countries will do it for us. That is a substitute for consumption here. Maybe. But I think that they won’t do enough for us, and maybe will be too infected by us to do it. But maybe growth in Asia will help us. The Asian thing is tremendously exciting.
To me, the gist of the story is that uncertainty is bound to stay with us for quite some time.
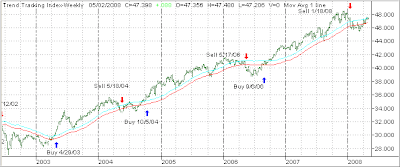
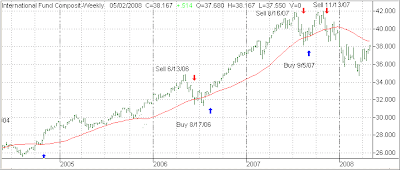
While we currently may have a disconnect from the market place to economic realities, the key to surviving this period with your portfolios intact is to take selective picks in those areas that are showing upward momentum and are trending higher—at least for the time being.
And that’s the key. Trends will start and may end quicker than we like, so be aware of reversals and use your trailing sell stops. Don’t be afraid to take a small loss, but stay away from the big ones.
 Leave it up to bankers, the main contributors to the mortgage crisis, to come up with the stupid and ignorant quote of the year (or possibly of the century). Reuters reports in “Bank of America-Countrywide to curb risky mortgages:”


