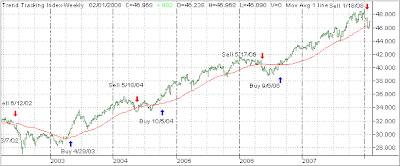
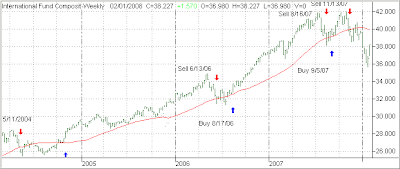
No Load Fund/ETF Tracker updated through 1/31/2008

Ulli Uncategorized Contact

My latest No Load Fund/ETF Tracker has been posted at:

http://www.successful-investment.com/newsletter-archive.php

Another interest rate cut was all the bulls needed. Despite negative economic news, the major indexes closed sharply higher.

Our Trend Tracking Index (TTI) for domestic funds/ETFs moved to +1.42% above its long-term trend line (red), back into bullish territory. To avoid a whipsaw signal, I will wait for further upside confirmation before moving back into the domestic market.


The international index dropped to -4.24% below its own trend line, keeping us in a sell mode for that arena.


For more details, and the latest market commentary, as well as the updated No load Fund/ETF StatSheet, please see the above link.

Testing Patience

Ulli Uncategorized Contact

David Gaffen of the WSJ had this to say:

Don’t like what the stock market is doing? Wait a few minutes. The Dow Jones Industrial Average was lately up 111 points, after losing nearly 200 points at one point earlier in the day.

Such swings have become commonplace in this period of increased volatility. Through the first six months of 2007, the Dow, on average, traded in a range of 111.69 points in any given day. By way of comparison, between the beginning of July and including today, the Dow has moved by an average of 198.62 points on any one trading day.

The volatility has only increased in the last month — during January, the average daily trading range for the 30-stock average has been 285.49 points, which includes today’s range, currently at 344 points.

What that means is the current wide swings are a sign that uncertainly in the market place about the major trend is here to stay for the time being. Eventually, a breakout will occur, either up or down, and a new major trend will be established. In the meantime, simply accept trading ranges of some 300 points as a temporary theme. The road ahead could remain rocky as David Nelson of Minyanville explains:

Without the wind at our back, making money and holding onto profits will be difficult at best as the wounds are fresh and will take some time to heal. The overhead supply of stock to be sold is large and getting larger. You can feel like you aren’t bullish enough when the market rocks and too bullish when the market rolls.

Investors are desperately searching for an investment theme that lasts for more than a few days. A change in leadership will probably lead us out but lately has the feel of one step forward and two steps back.

Most great investors will tell you not to panic. It’s good advice but it doesn’t just apply to panic selling. Yesterday was a buying panic. The market overdosed on “Fed cut euphoria” as investors went into a buying frenzy, fearful of missing the boat. By the end of the day we all had a hangover.

Let’s slow the process down and eliminate the day-to-day overreaction to every bit of news that hits the tape.

Read that last sentence again. Don’t get too caught up in day-to-day events and keep the big picture in focus. The big picture is that we try to get onboard major trends and avoid sideways patterns that serve no purpose other than to cause needless frustration.

A Non Event

Ulli Uncategorized Contact

Despite all of the hoopla and anticipation of the Wednesday’s interest rate cut, the markets ended on a down note. In a way, it may have been a classic “buy the rumor sell the fact” type of outcome. Personally, I think it’s slowly sinking in that these unprecedented rate cuts of the past 8 days actually represent bad news about the health of the global and domestic financial markets.

The major averages spiked up after the announcement of a 50bp lowering of rates with the Dow gaining some 200 points before drifting into negative territory on the close. Apparently, the downside move was spurred by a news report that bond insurer FGIC was downgraded by Fitch from AAA to AA. The markets hit a glass ceiling and it was downhill from there.

So far, this week’s events have left our trading plans unchanged. The domestic TTI remains below its long-term trend line by -0.37% while the international TTI has retreated to -7.39%. Both are therefore in bear market territory, and I will look for more downside confirmation before initiating any short positions.

Right now, we’re safely on the sidelines. Friday’s employment report has the potential to throw the markets into a tizzy fit. I will watch the action but will sit on my hands until some major trend emerges.

A Gold Bubble?

Ulli Uncategorized Contact

As you know from my recent posts and updates, we are still holding a small position (10% of portfolio value) in gold. With the financial markets mired in uncertainty, is there more upside potential for the metal or will the Fed’s easing eventually create a gold bubble?

Lance Lewis of Minyanville had this to say:

With the equity market now likely set up for some sort of bear market rally in the wake of the Fed detonating its 75 bp “nuclear weapon” on Tuesday, the “fear of the margin clerk” – which has weighed on gold and gold shares over the past week or so – should now be removed, and that opens the door for both to release to the upside and make new all-time highs very shortly. My own near-term target for the yellow metal is $1000+, but that’s just me.

Remember, the Fed is easing with gold at an all-time high. When has this ever happened in history? It hasn’t, because never before has the threat to the financial system been so horrific due to all the leverage and financial engineering that has built up over the past 25 years. To allow this to “unwind” (as it should have been allowed to years ago) is now virtually impossible due to the dire consequences involved.

Faced with that prospect as stocks began to crash and the two largest credit insurers were teetering on bankruptcy, the Fed was forced to ease 75 bps in a single day on Tuesday (and promise more easing to come), even as the equal-weighted CRB (CCI) was just a few percent off its all-time high and gold was at an all-time high. The result is going to be that Wall Street will now take that 75 bps and create more money and credit (i.e. “print money”), but the “liquidity” won’t go where the Fed wants it to go (i.e. the US credit markets).

Where it will go, however, is into gold and certain other hard assets, because this time around “printing money” is not going to blow an asset bubble that will support the US economy, unlike in 1998 (when the Fed created the stock bubble) and 2001-2003 (when the Fed created the housing bubble). Now all we are going to get is a collapse of the world’s fiat dollar-based monetary system, more inflation on top of a weak economy (i.e. stagflation), and a “bubble” in gold.

Predictably, the Fed has chosen to “run the printing press” and inflate its way out of the housing bust, and inflation is exactly what it will get for its efforts. If this thought process sounds new, it shouldn’t be, because I’ve been talking about how the Fed would inevitably respond to the housing bust and what the likely result would be for over a year. And I feel things continue to unfold pretty much to script…

While we have seen a lot of volatility in most orientations over the past year, my records show that the gold ETF (IAU) was one of the more stable investments as measured by my MaxDD% indicator. This measures the drop from the highest to the lowest point (Maximum Draw Down) over a certain period.

Over the past 12 months, the MaxDD% for IAU was only -7.65%, which occurred on 3/5/2007. Compared to the S&P; 500’s (IVV) MaxDD% of -13.51%, gold has displayed amazing stability and lack of volatility. This is not to say that this trend will continue but, given the overall global turmoil, there may be more upside potential. However, I will always apply my sell stop discipline in case the trend reverses all of a sudden.

Who Is The biggest Subprime Investor?

Ulli Uncategorized Contact

Ever since the Subprime crises started, I’ve been curious as to whether there was one entity or institution that had the biggest exposure to Subprime slime.

I found the answer as I was reading Bloomberg’s article “SEC to Rework Rules After Funds Struggled with Subprime Prices.” A couple paragraphs caught my attention:

“Within the $12.1 trillion U.S. mutual-fund industry, the biggest subprime-debt investors are taxable bond and money-market funds, which managed a combined $3.93 trillion of assets as of November, according to the Investment Company Institute.

Money funds, which try to maintain a stable net asset value of $1 per share, are considered among the safest investments because they only buy highly rated debt with short maturities. Falling below a $1 a share can shake investor confidence and spur withdrawals.”

Surprised? Read that first sentence again! If you are one of those investors who is chasing after the highest money market yield, think again. Higher yields equal higher risk. The Subprime/credit crisis is far from being over and, as I said in a previous post, I strongly suggest that you move your idle cash to a money market account consisting of U.S. treasuries only. All major brokerage firms have these, although some may have high minimum requirements.

Market Commentary: Yesterday’s rebound was a euphoric reaction to another potential sharp interest cut by the Fed on Wednesday. The markets ignored poor economic data and earnings and focused on nothing but lower rates. At this time, I would not read too much into this reversal from Friday. Caution is of the utmost importance.

Sucker Punched?

Ulli Uncategorized Contact

This weekend, I was reflecting on some of the wild events of last week, including a rogue trader’s loss of some $7 billion of France’s number 2 bank (Société Générale), and the Fed’s once-in-a-lifetime 75 bp interest rate cut.

As we now know, last Monday, while the U.S. markets were closed, Société Générale, unwound their massive market positions before going public with the loss caused by one of their traders. This unwinding may have very much contributed to the world wide market melt down and prompted the Fed to cut rates sharply. According to news reports, the Fed was not aware of Société Générale’s troubles.

To me, that means that they may have very well been sucker punched into a rate reduction, which otherwise might have been smaller and/or implemented at the next Fed meeting. While we will never know the truth, Keven Depew of Minyanville had this viewpoint in his five things you need to know (item 2):

“It does look like they were snookered into cutting rates,” Lou Crandall, chief economist at research firm Wrightson ICAP LLC, told the Wall Street Journal in response to a question about the Fed’s Tuesday rate cut.

Snookered? By a Société Générale rogue trader? I don’t think so. If the Fed really was “snookered,” it was “snookered” by any number of the following that are absolutely not related to a Société Générale rogue trader:

More than $100 billion in writedowns (so far) related directly to subprime mortgages, including $22.4 billion from Merrill Lynch (MER), $19.9 billion from Citigroup (C), $14.4 billion from UBS (UBS) and $9.4 billion from Morgan Stanley (MS).

From the July peak, a stunning $340 billion, or 15.6%, collapse in total commercial paper, a decline of unprecedented magnitude.

A $1.2 billion third quarter loss by Countrywide Financial (CFC), the nation’s largest mortgage lender, the first loss for the company in 25 years.

A 1.4% drop nationally in the median price of a home, the first national drop since the Great Depression.

A 70% year-over-year increase in homes in some stage of foreclosure, per the latest data available from the Mortgage Bankers Association.

A 25% decline nationally in housing starts, the steepest decline since 1980.

Tighter credit standards for businesses and consumers despite a reduction in interest rates.

A loss of 61,800 residential construction jobs, according to the Bureau of Labor Statistics.

Be that as it may, it appears that Fed watchers are confused as to what to expect from the next meeting this coming Wednesday. The anticipation is another ¼ point cut and possibly a ½ point.

Either one can have a dire effect on the market place as further cutting is evidence of a weakening economy, which will translate into earnings slowdown and subsequent lower stock prices and therefore a further slide into bear market territory.