

- Moving the markets
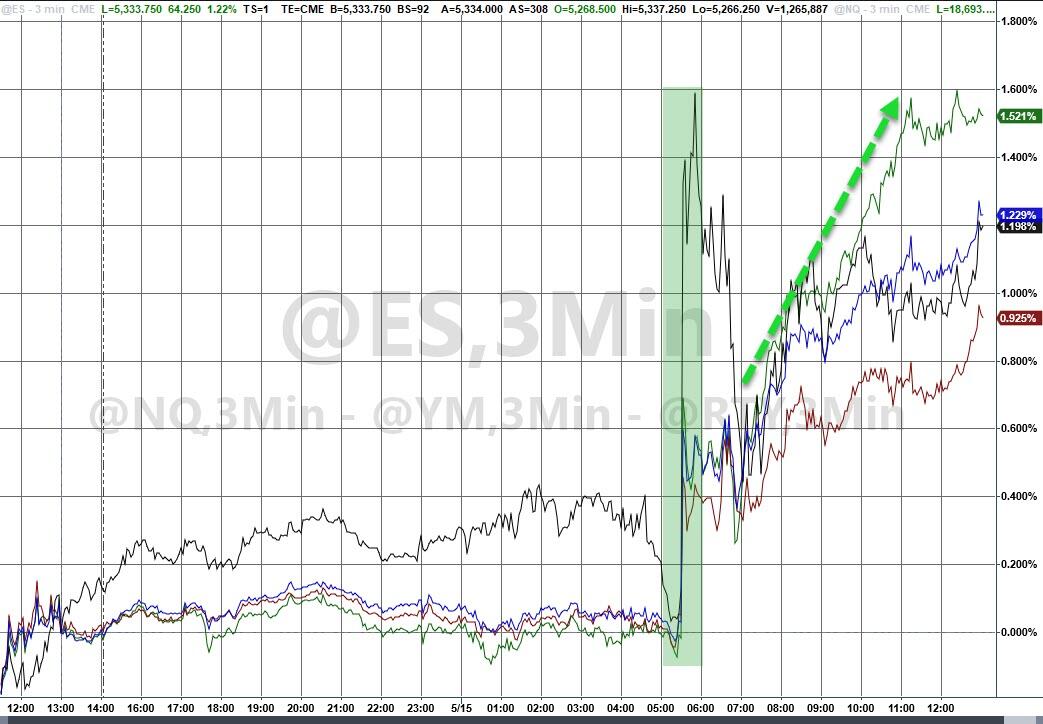
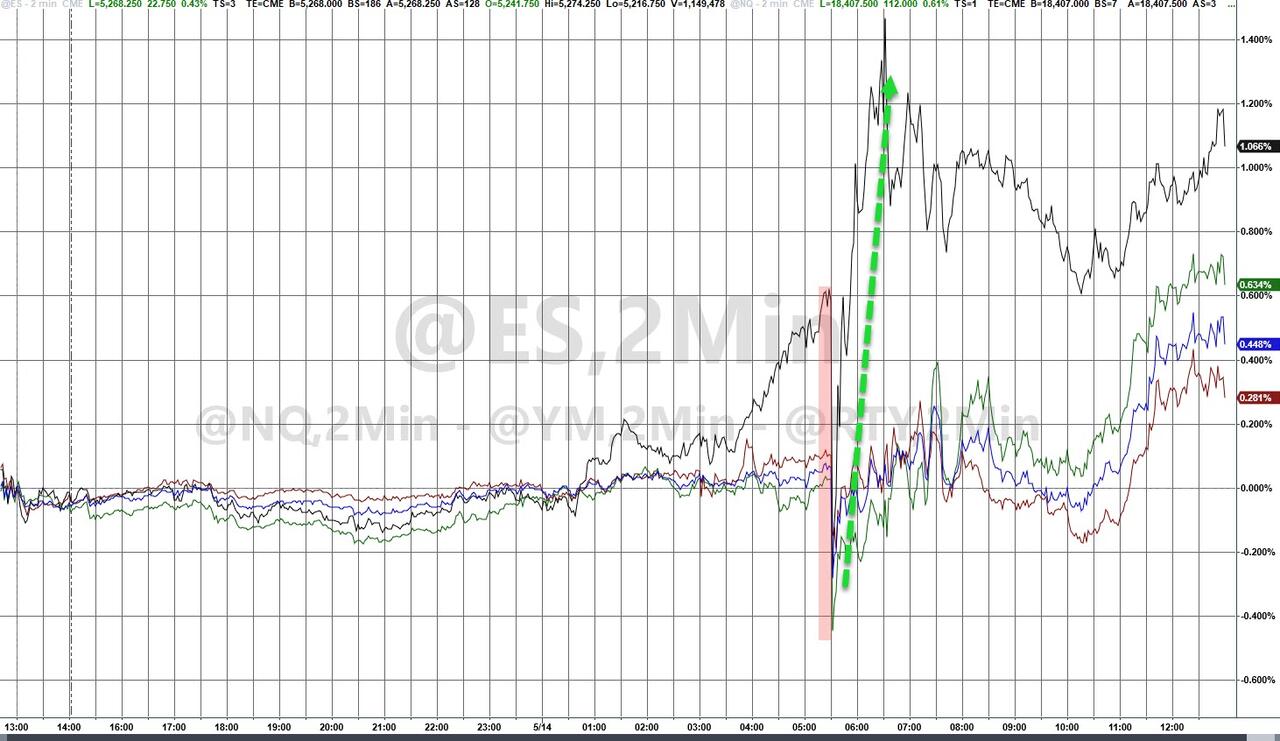
The much-awaited CPI report pushed the S&P 500 and Nasdaq to record highs, as this crucial number turned out to be better than expected.
The index rose 0.3% for the month of April, which was less than the estimate for a 0.4% monthly increase. The indicator changed by +3.4% year over year, in line with expectations. Monthly and yearly numbers for the core CPI, which excludes volatile food and energy prices, were both in line as well.
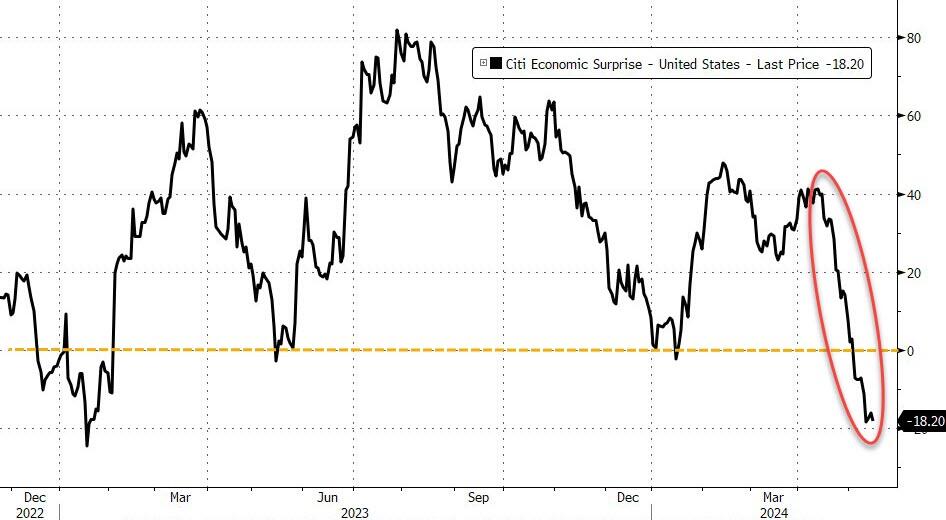
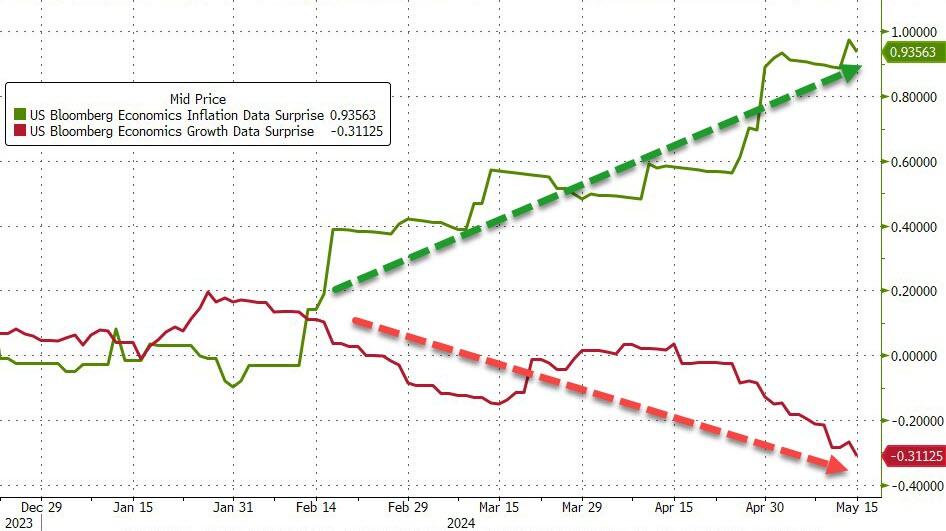
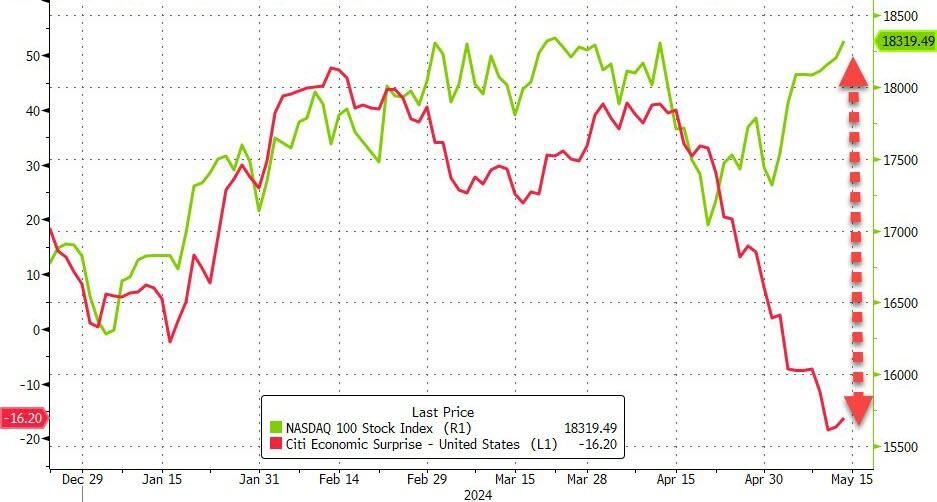
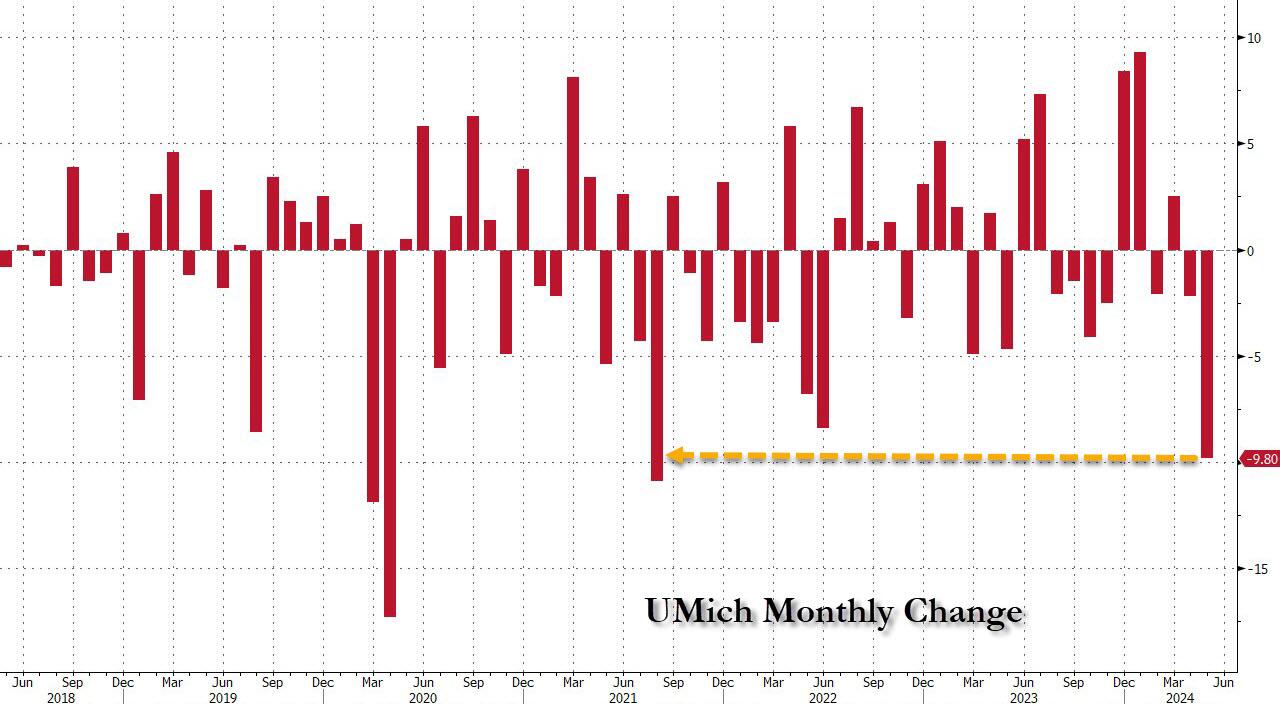
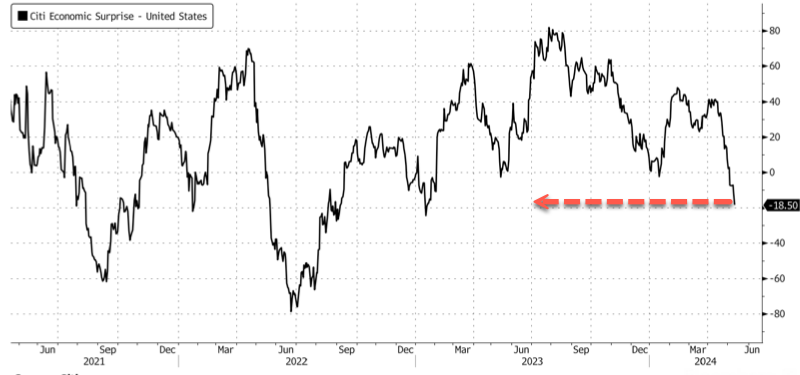
The only fly in the ointment was Retail sales, which remained flat in April. Economists had expected a 0.4% leap, but then again “bad news” is “good news” when it comes to potential rate cuts. The Citi Economic Surprise Index reflects the weaking economy, as the stagflationary threat continues to worsen.
Traders’ expectations for a softening of the Fed’s stance on rate cuts were boosted, as its likelihood of an easing at the September meeting increased to almost 58%. While that is a substantial jump from yesterday’s 45%, we’ve seen this type of relentless hope turn into disappointment before.
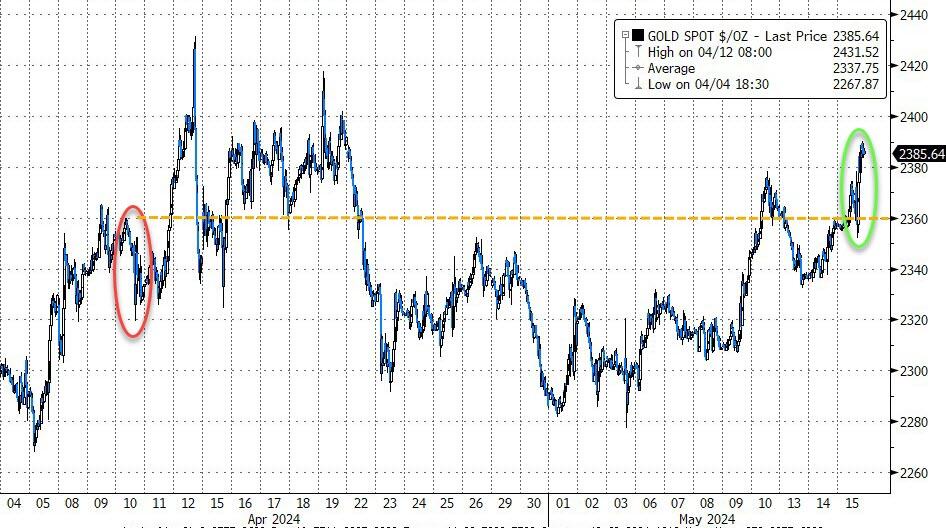
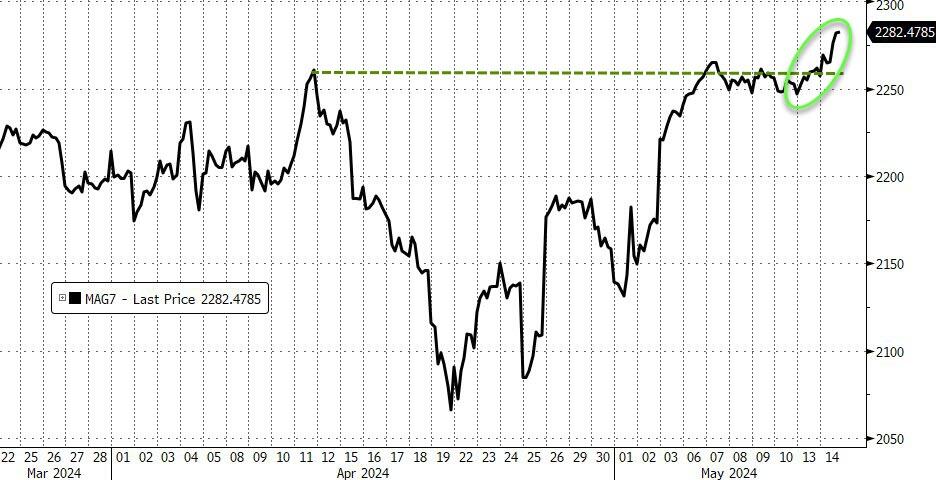
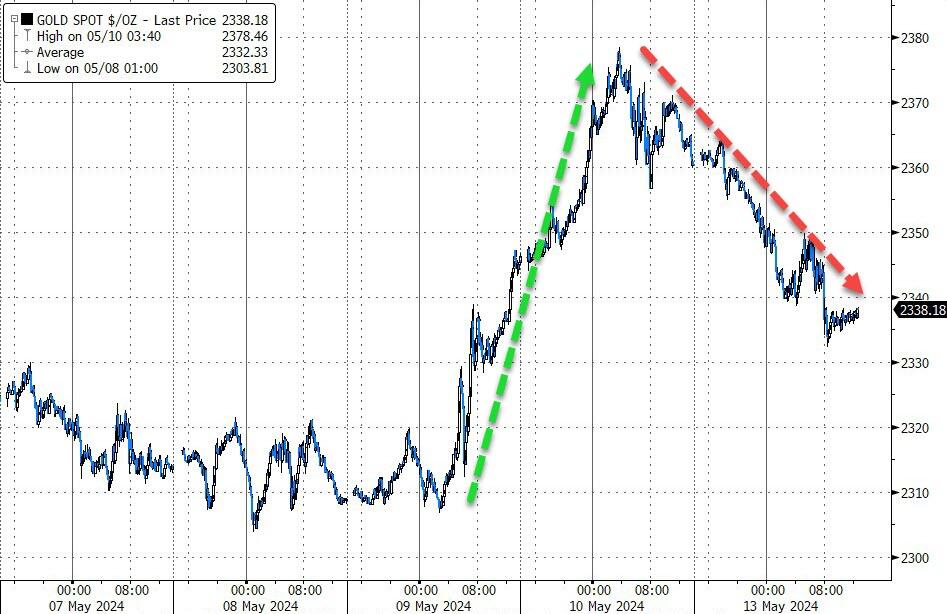
Still, the continuing outlook for lower rates coupled with enthusiasm around AI has lifted traders’ sentiment all year. The S&P is currently up some 11% YTD, but gold still rules the race by being ahead with a gain of over 15%.
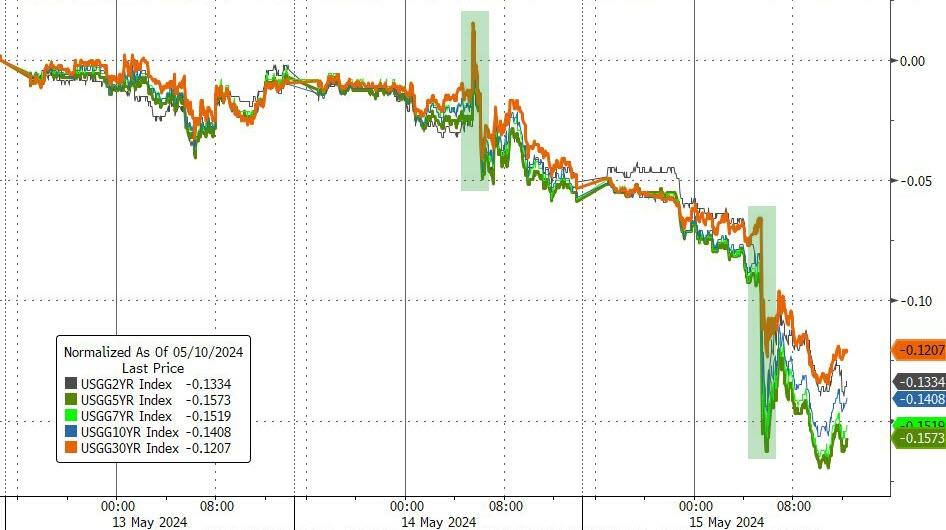
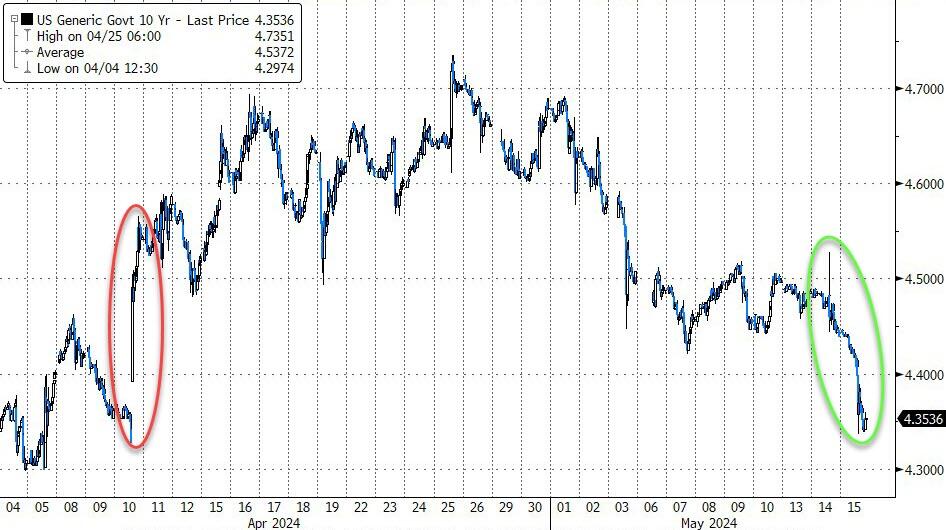
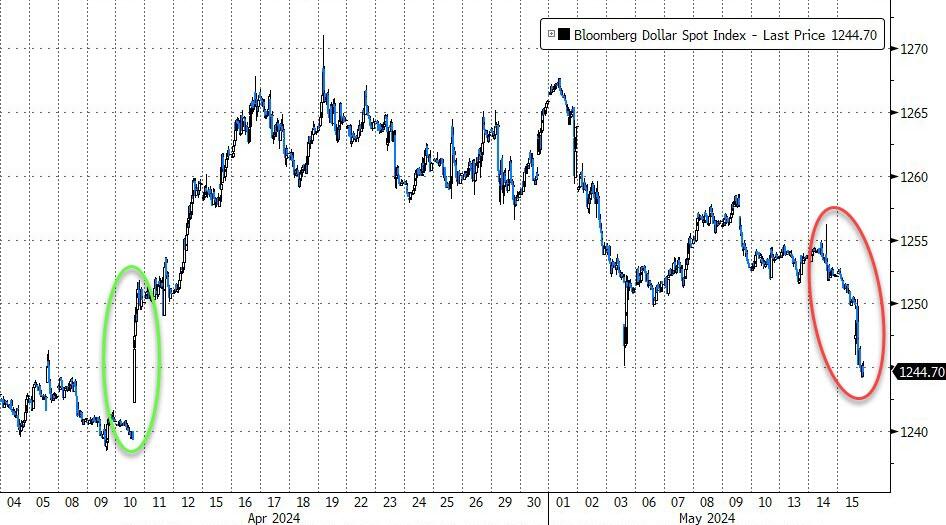
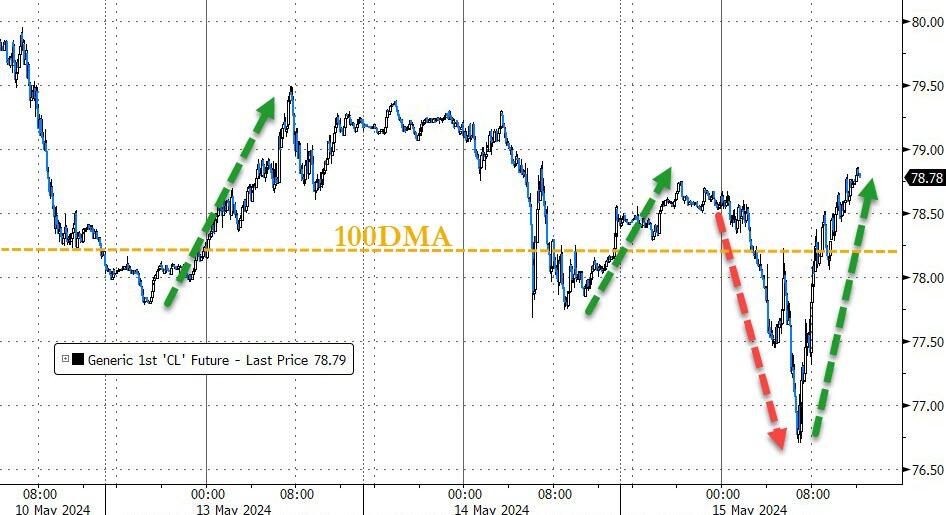
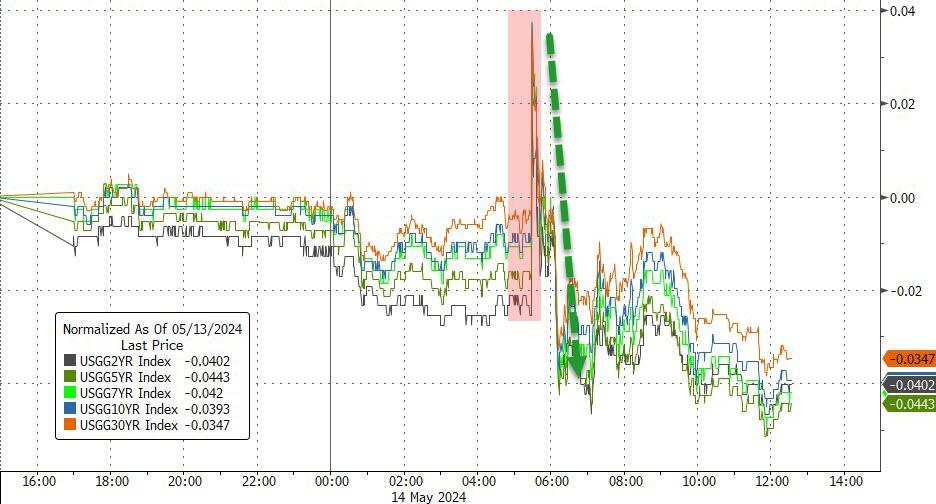
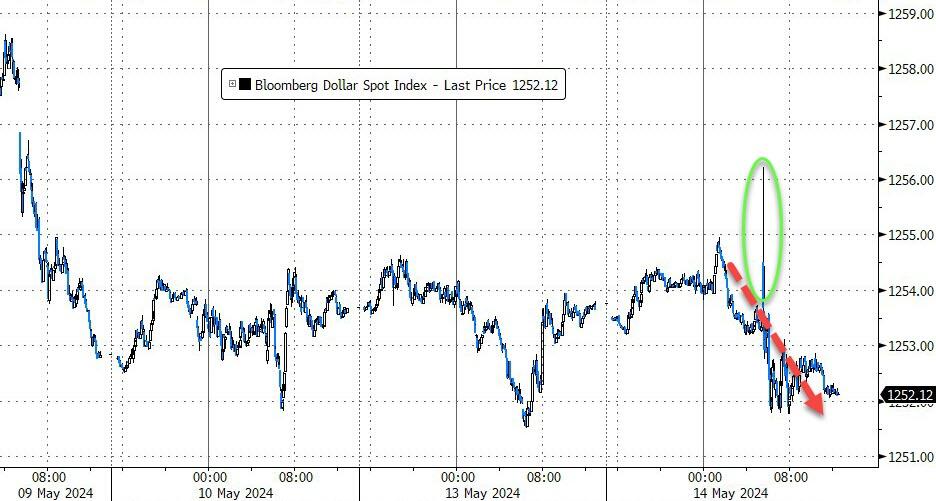
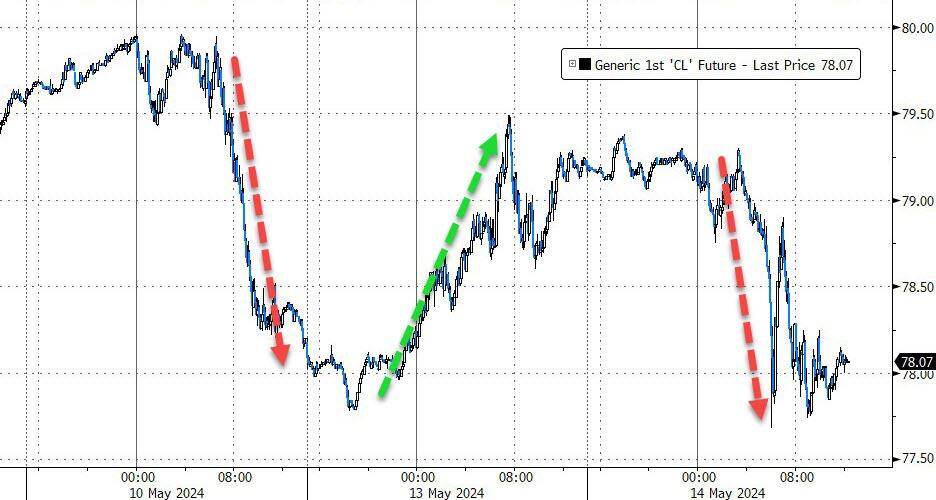
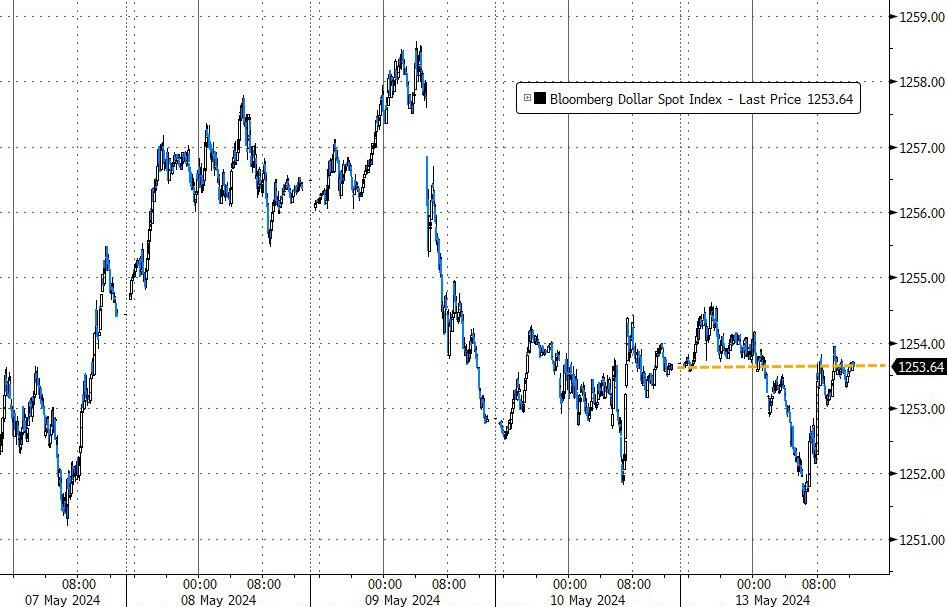
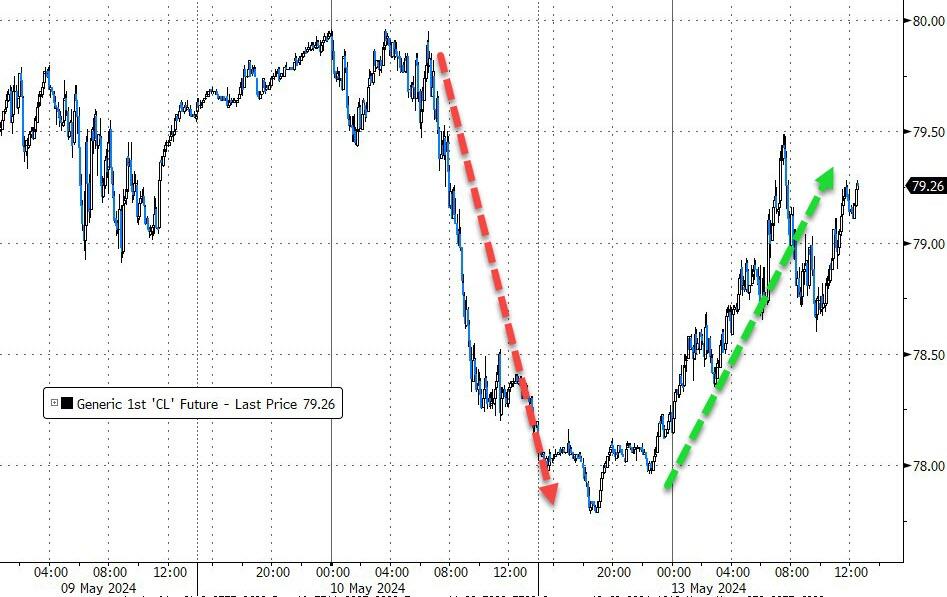
Bond yields slipped, with the 10-year dropping down to towards April lows. The dollar dipped, while oil rode the roller coaster but managed to close in the green. Gold surged towards its record closing high of $2,392 and reached the same level it had before April’s CPI report.
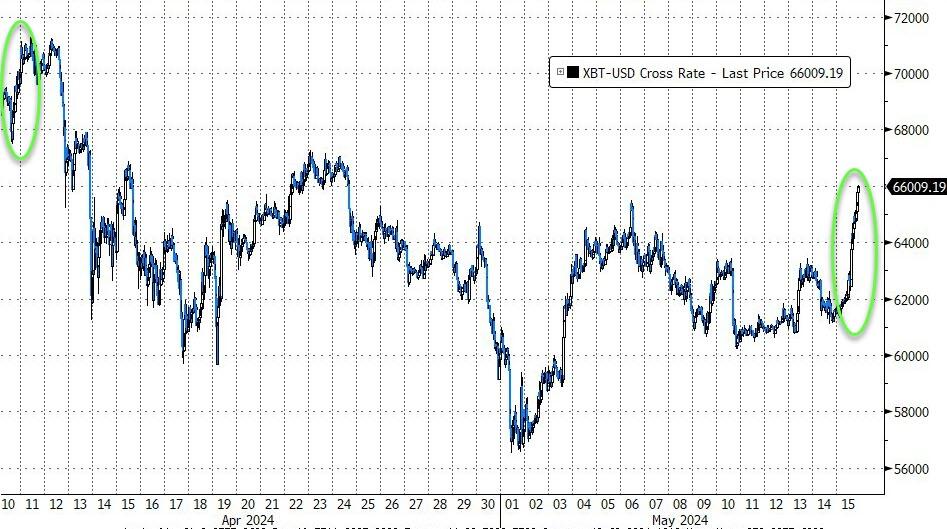
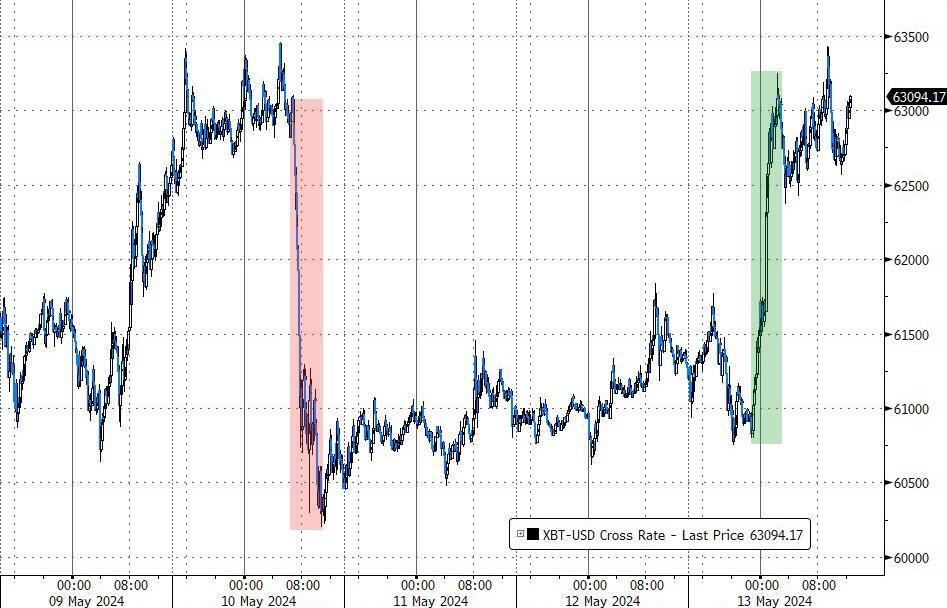
Bitcoin soared some 7% by conquering its $66k level, with the coin having its best day since March 2023. Crude oil recovered from an early drop and eked out a 1% gain.
I don’t think today’s party is justified due to today’s CPI report only playing a small part in the battle to conquer inflation. After all, as long as this country has to borrow $1 trillion every 100 days, the real inflation monster has not been unleashed yet.
Read More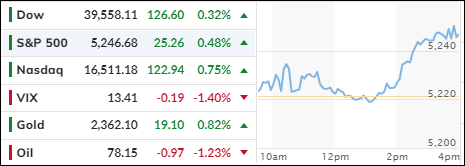
