Hat tip goes to Random Roger for this link to “More Gains in 2011?”
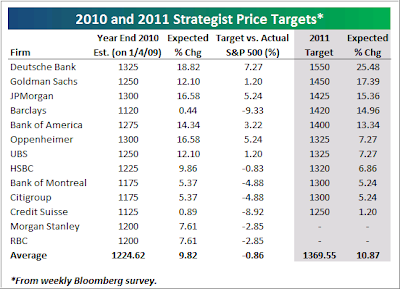
All but two of the major Wall Street firms surveyed by Bloomberg have provided their 2011 S&P; 500 price targets. And so far, every single strategist has provided a year-end (2011) price target that is higher than the S&P; 500’s current level. The consensus year-end estimate currently stands at 1,369.55, which represents a gain of just over 10% from where the S&P; is currently trading.
As shown below, Deutsche Bank has the highest 2011 year-end price target at 1,550. At 1,550, the S&P; would be just 16 points below its all-time high reached in October 2007. A return to new all-time highs by 2011 would be quite the comeback for the market. Goldman Sachs has the second highest price target at 1,450, which is 100 points below Deutsche Bank’s target. A move to 1,450 would be a gain of 17.39% from current levels. JP Morgan, Barclays, and Bank of America all see the S&P; rising to 1,400 or higher next year.
Credit Suisse currently has the lowest 2011 year-end price target at 1,250, which is just 1.20% higher than where the index is trading now. Citigroup and the Bank of Montreal are both at 1,300, HSBC is at 1,320, and UBS and Oppenheimer are both at 1,325.
At the start of 2010, the consensus year-end price target was 1,224.62 for the S&P; 500, which is just 10 points below where the index is currently trading. Barring a big move higher or lower in the last two weeks of the year, the strategists collectively will have been pretty good prognosticators in 2010. Don’t hold your breath for a repeat performance, however.
Since no one has the ability to look into the future, forecasting is simply a hit or miss proposition, although on average, the group above did very well for 2010.
While the average forecast for 2011 of +10.87% for the S&P; 500 is certainly a possibility, much depends on the unknown events that suddenly could have the markets run into a brick wall and reverse their trends.
Domestic events could include continued budget and underfunded pension problems on every level government and subsequent defaults and bankruptcy filings along with massive layoffs.
Globally, real estate/credit bubbles in China, Australia and Canada may finally play themselves out along the lines of what we’ve seen in 2008. Additionally, China’s overheating economy may be forced into slowdown mode to contain inflation, which will affect global trade for sure and will have an impact on the U.S. as well.
Europe will continue to struggle with the debt issues of its Euro zone member countries, and I would not be surprised to see the first default occurring at some point during the next year. That would likely cause a domino effect.
While any of these possibilities could derail the U.S. market, the question remains as to whether the impact will be only a temporary pullback, or a trend reversal back into bear market territory. It all depends on the magnitude of the event or if several of them are occurring simultaneously.
It pays to be prepared for either outcome by focusing on the direction of my Trend Tracking Indexes (TTIs) along with those of the major indexes. Using these in combination with my recommended exit strategy will give you not only piece of mind but also a plan as to how to deal with market adversity.


