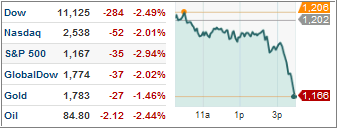
 With yesterday’s sell off, as a result of the Fed’s “stimulus” not being perceived as large and dramatic enough, the S&P 500 has given back -1.85% since last week’s report.
This weakness was immediately reflected in the momentum numbers and affected rankings above and below the cutline. We held steady in terms of positioning, as only 7 ETFs remain above the line and in bullish territory, while all others roam around with the bears below the line.
As I mentioned last week, despite the various rebound attempts, weakness prevails in the equity arena. I still consider the current market environment to be a traders market and not one for long term investors due to its extreme volatile nature. A long term trend in either direction can simply not yet be identified without wild guesswork.
To repeat, the High Volume ETF Cutline report includes all ETFs above and below the cutline (trend line). To clarify, High Volume (HV) ETFs are defined as those with an average daily volume of $10 million or higher.
These ETFs are generated from my selected list of some 90 that I use in my advisor practice. It cuts out the “noise,” which simply means it eliminates those ETFs that I would never buy because of their volume limitations.
Take a look at the most recent ETF Cutline Report: