ETFs Stay Relatively Calm, But That May Change Very Soon

Ulli Market Review Contact

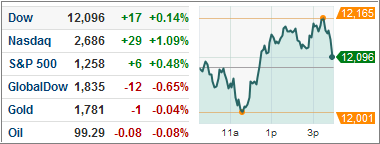
[Chart courtesy of MarketWatch.com]

Markets appeared to be in the gray zone today, finishing modestly on the upside after an initial dip. The S&P 500 went up 0.48% while European indices such as the DAX and CAC 40 hit some road bumps, dropping 0.87% and 1.92%, respectively. Also, Asian equity markets finished on the downside.

Despite recent hyperactivity in the VIX, it remained essentially flat today. While the last two days have been pretty quiet with little volatility, we are still above the 30 level, keeping us in risk on mode. And on the commodities front, oil nearly hit the psychological barrier of $100, ending at $99.36, which was its highest since July.

Investors might be waiting for Italy to complete its transition to the new government headed by Monti, but it doesn’t look too rosy as Monti is experiencing some friction in trying to form a Cabinet.
Read More

Are Eurozone Fears Starting to Become a Reality for ETFs?

Ulli Market Review Contact

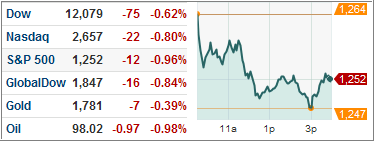
[Chart courtesy of MarketWatch.com]

Markets took a dip today given continued Eurozone uncertainty and less than stellar data. The S&P 500 retreated 0.95% while other major indices across the global echoed a similar negative sentiment.

The dollar appreciated against the Euro to $1.36/Euro while commodities had a mild drop. Volatility slightly edged up 3.63%, but overall market volume was quite low for the day, so we’ll have to see how the risk picture transpires over the course of the week.

Today’s telling figure was a 2% reduction in Eurozone industrial production for the month of September. This was the biggest drop in nearly 2 years ago, an indication that Europe’s real economy outside of debt issues is hitting a major roadblock. The compounding of economic weakness and financial breakdown could accelerate the likelihood of a worldwide recession.

Read More

ETFs On The Cutline – Updated Through 11/11/2011

Ulli ETFs on the Cutline Contact

Below are the latest ETF Cutline reports, which show how far above or below their respective long-term trend lines (39 week SMA) my currently tracked ETFs are positioned.

The first report covers the ETF Master List from Thursday’s StatSheet and includes 397 ETFs, of which currently 101 of them are hovering in bullish territory.

The second report includes only High Volume ETFs. To clarify, High Volume (HV) ETFs are defined as those with an average daily volume of $10 million or higher.

These ETFs are generated from my selected list of some 90 that I use in my advisor practice. It cuts out the “noise,” which simply means it eliminates those ETFs that I would never buy because of their volume limitations.

Take a look at the most recent ETF Cutline Reports:

1. ETF Master Cutline Report

2. ETF High Volume Cutline Report

Last Week In Review: ETF News And Blog Posts To 11/13/2011

Ulli Market Review Contact

In case you missed it, here’s a summary of the ETF topics and market reviews I posted to my blog during the week ending on 11/13/2011.

An almost 4% pullback in equities shook the financial markets last Wednesday, as Italian bond yields rallied above the 7% pain threshold. However, the bulls pulled the major indexes out of the basement during the subsequent 2 trading days, as a new government, along with fresh commitments to austerity measures, gave hope that Italy, at least for the moment, was saved from a debt debacle.

How long that fact resembles any reality remains to be seen, but the major domestic trend is up, and we’ll carefully follow its direction.

This week, we covered the following:

Read More

Closer to Contagion: Is The Day of Reckoning Near?

Ulli Market Commentary Contact

While markets broke to the upside this week, don’t be fooled by the unwarranted optimism. With Greek and Italian PMs out, the heightened political discord is putting the Eurozone at serious financial risk. Seeing as Italy’s debt burden dwarfs Greece’s debt, a financial meltdown in Italy could create larger negative shockwaves extending not only throughout Europe, but into American and Asian markets as well.

An indication of just how intertwined Eurozone members are with either in terms of debt holdings, take a look at this graphic (click on a country to see its net debt obligations to other European countries). The picture is scary for countries such as France, which has $366 billion in exposure to Italian debt as well as significant holdings of Greek, Spanish, and Italian debt. Let’s just say no one’s quarantined from this debt virus.

I don’t have a direct solution to stoke your fears, but I hope the video below stresses the severity of the situation we’re in and how I’ve geared my investment strategy to avoid potentially large losses if widespread European contagion becomes a reality.

http://www.youtube.com/watch?v=NXOsXy8PLWo

ETF Leaders And Laggards – For The Week Ending 11/11/2011

Ulli ETF Leaders & Laggards Contact

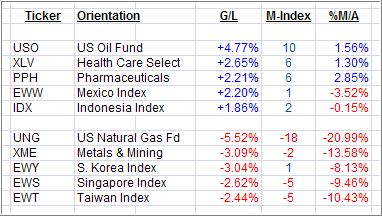
Here is a quick ETF review of the past week’s Leaders and Laggards from my High Volume ETF Master list:

Another roller coaster week shifted things around in the winners and losers columns. It’s interesting to note that, despite the equity ETF comeback of last two trading days, none of them gained enough to make it into the Leaders column.

Sector ETFs were the primary gainers, some of which just crossed their long term trend lines to the upside as the %M/A column shows. Along with positive M-Index rankings, they may be worth your consideration. I will post the corresponding updated High Volume ETF Cutline list on Monday morning, so that you can better evaluate those ETFs that have jumped into bullish territory.

Country ETFs were a mixed bag this week, as two of them made into the Leaders column, while three of them ended up on the losing side. Again, to be certain that upward momentum is rising, you want to enhance your odds of success by making sure that the %M/A column is positive; it shows the percentage an ETF has climbed above its trend line (positive number).

The idea here is not to engage in bottom fishing but to catch ETFs as they come out of the basement and cross the dividing line between bullish and bearish territory to the upside.

Disclosure: No holdings