Worst Decade For Stocks

Ulli Uncategorized Contact

MSN Money reported a couple of days ago that “Stocks ending their worst decade ever:”

Stocks have lost value each year since the end of 1999. Even the lowly savings account performed better.

So long, 2000s. And no need to pass the tissues. We won’t get too weepy about this goodbye.

The past 10 years have been the worst decade ever for stocks, reports The Wall Street Journal. We suffered through two bear markets, and stocks on the New York Stock Exchange lost 0.5% a year, on average, since the end of 1999.

And if that doesn’t hurt enough, try rubbing some inflation on that wound. If you adjust for inflation, the S&P; 500 index has lost 3.3% a year since the 1999, the Journal reports.

No other decade has been this bad. Not the 1970s with its runaway inflation and bear market. Not the 1930s with its Depression years.

How could this happen? The 1990s pushed stock prices too high, and they came into the decade ridiculously overvalued, experts tell the Journal. Stocks in the S&P; 500 started off this decade at about 44 times earnings — and there’s nowhere to go but down in that scenario.

Even now, those stocks are at about 20 times earnings, which is higher than the historical average of 16.

So did anyone come out from this decade a winner? Gold owners, who saw the price of the previous metal spike an average of 15% a year. And bond owners, who earned returns in the 5% to 8% range.

And if this was the worst decade ever for stocks, you can bet that the economy was similarly miserable.

So what can we blame for the horrific numbers? Even the Journal (gasp!) suggests that we can point a finger at American capitalism.

Wall Street, given free rein to build itself into a powerhouse, ended up nearly destroying itself in the process. Americans spent too much and saved too little, thus removing a safety net that could have helped.

Obviously, two bear markets in one decade helped destroy whatever bullish sentiment was present during the remainder of the time. This proves my point that it is far more important to practice bear market avoidance than being worried about missing the bottom of a rebound in the market place.

We’ve seen that very same scenario play out last year and this year. The S&P; 500 lost over 38% in 2008 and, so far, has gained 23% in 2009. Markets go down much faster than they go up, which is why it’s such long and hard road to get back to the breakeven point.

As I have posted about throughout this year, the S&P; 500 still needs to gain another 18% from current levels just to get to the point of our sell signal on 6/23/08. Given how far the market has come off the March lows, along with an unstable economic recovery predominantly fed by stimulus, this last portion may take while to make up.

A lot of investors have been sold a bill of goods that always being in the market is the way to success. 2008 has proven them wrong, so did 2000 and the entire decade. I wonder how many decades it will take before this reality sinks in?

More ETF Resources

Ulli Uncategorized Contact

While my weekly StatSheet tracks the momentum figures for the most useful ETFs in the universe, the list is certainly not all-inclusive. Readers from time to time ask to have a complete listing of ETFs available to do some of their own initial research.

Here’s a site that features “Low Cost ETFs: Complete list of the Cheapest Exchange Traded Funds” with an ETF screener that features over 900 funds as well as a complete list of categories.

Momentum figures are not included, but this site gives a good overview as to what is available at this particular time.

Asleep At The Crossover

Ulli Uncategorized Contact

It struck me as being funny the way reader Jim phrased his question, although this very same thing probably has happened to many investors at one time or another:

If I had been asleep when my ETF crossed above its 39 wk M/A, what would you recommend as a late buy signal?

Actually, this happens in my advisor practice all the time, not on purpose but via the mere fact that new money comes in during the middle of a buy cycle.

As a general rule, I use my incremental buying procedure to ease into the market. I immediately invest 1/3 of available assets and increase that by another 1/3 once the original portion has gained 5%; and so on until I am 100% invested. That decreases my risk sharply of allocating 100% of a portfolio at a potential market top.

If you are not that conservative, use a 50/50% ratio or, if you are aggressive, go all in at once. Remember, if you combine this approach with my recommended 7% sell stop discipline, you already know what your potential risk will be.

Simply assess your risk tolerance and then invest accordingly. If neither of these three suggestions appeal to you, do the next best thing you can do for your emotional well being—stay out of the market.

Sunday Musings: Debt Disasters

Ulli Uncategorized Contact

MarketWatch featured an interesting story titled “Debt disaster fears rumble from Athens to London.” Here are a few highlights:

Rumors of a debt disaster are swirling around Europe, from Athens to Madrid and all the way to London.

Investors have rushed to sell Greek bonds since the newly elected government of George Papandreou made a startling revelation: the deficit will soar to over 12% of gross domestic product this year, well above previous official projections.

Greece’s predicament has escalated concerns about contagion in other European countries whose finances are in poor shape. Just this month, the ratings of Greece have been cut both by Fitch Ratings, and, late Wednesday, by Standard & Poor’s, and major agencies have warned Spain and Portugal of possible cuts.

The market reaction has been swift, and brutal. The euro has dropped below the key $1.50 level. Credit-default swaps on Greek government debt — essentially, bets that Greece will default — have ballooned.

Irish and Spanish institutions also have seen extreme bouts of turbulence of late.

The most vulnerable countries like Greece and Spain indeed confront a mounting debt burden, which will likely lead to more ratings downgrades and more market sell-offs. The path to fiscal health will require painful, unpopular reforms.

But, most analysts agree that the European Union will, if necessary, bail out its members and never let a country’s fiscal situation deteriorate to the point of sovereign default. Those rescue expectations continue even as terms of euro entry explicitly forbids such moves.

Despite all good intentions of the EU to “assist” its members, the money has to come from somewhere. It’s not that alleged “strong” members of the Union are flush with cash and operating on the plus side of their balance sheets. Others are having their own financial issues as well with more money going out than coming in.

Even if financial support in some form is rendered, and I am sure it will be, it will nevertheless rattle world markets. That’s what I meant when I previously referred to an outside event that can at least temporally pull the markets off their highs.

If Greece or any other country defaults on their obligations, or at least the potential exists, the whipping boy of the past (the U.S dollar) all of a sudden becomes the darling of the world again that everyone wants to own. Recent events have supported that view as the bullish dollar chart (UUP) shows:


A bottom seems to have formed, but it will still take more upward momentum before the long-term trend line is crossed to the upside. Extreme bearishness on any asset will very often lead to opposite moves; and the dollar maybe no exception.

I currently have no positions in UUP but will consider it once the break of the trend line gives me the go ahead.

What Do You know About The ITCS Principle?

Ulli Uncategorized Contact

Forbes featured an interesting piece with the title “Brokers Behaving Badly.” Here are a few snips:

Brokers deserve to be compensated, but the ways they are compensated deserve very close scrutiny.

There are two predominant methods of compensation. The first is commissions; the second is the so-called “fee based” account. In the old days, brokers charged commissions and advisers charged fees, but today, with the line between these two roles having been blurred, the matter is not so simple.

Commissions-based accounts are transaction-driven. Money is earned by the broker based on the size and quantity of investments sold to the client. Of course, the client will be more concerned with the quality of the investments, and that is where the client’s interest and the broker’s interest sometimes diverge.

Commissions can quickly add up to big money. Excessive trading of an account is called churning, and it is a fraudulent practice (see “Suitability Claims”). Usually, churning manifests itself in high turnover of the account’s assets, but, in fact, it’s the cost of the transactions, not the turnover that’s the evil. High costs diminish the likelihood that an investor will profit from investments being made.

Commissions on securities transactions are sometimes referred to as “markups” on purchases or “markdowns” on sales. When it comes to stock transactions, the law requires brokers to disclose the amount of any markup or markdown. But sadly, that is not the case for bonds; the law does not require bond brokers to disclose these things, as incredible as that sounds.

The rule allowing bond brokers to hide their fees can lead to abuse. I have recently been involved in several cases where the markups and markdowns were greater than the interest the investor earned from the bonds. The investor had no way of knowing that, however, because the markups and markdowns were not disclosed. When a broker recommends selling one bond to buy another, the ITCS principle is often at work.

Investment advisers, who are distinct from brokers, charge fees based on a percentage of the money in the account–the amount “under management.” An annual fee of 1% to 2% seems modest, but even that amount–paid year-in and year-out–is a drag on performance. Whether the management fee is a good deal depends on the quality of the services being provided. A manager whose responsibility is to watch and manage an account every day deserves compensation for sleepless nights. But it should not go unnoticed that the manager gets paid regardless of whether the account was profitable.

In the 1990s, the brokerage firms, under regulatory scrutiny for excessive commission-based sales, developed the so-called fee-based brokerage account. In a fee-based brokerage account, the broker earns a percentage of the money in the account, the same way an investment adviser is compensated. But a fee-based brokerage account, despite appearances, is not a managed account. If something goes wrong, the brokerage firm will not claim any responsibility for managing the account.

[My Emphasis]

While individual bonds may be the right investment for you, you can’t be sure what the markups are. As the article stated, sometimes they are higher than the interest earned. If you are holding a bond to maturity, it may not matter much to you, but if you suddenly need to liquidate a position, you may receive less than what you had anticipated.

The last paragraph emphasizes the difference between a fee-based brokerage account and a fee-only adviser managed account. I have talked to my share of investors in the past who did not know the difference.

To pay any kind of “management” fee to a broker, who puts your account in a canned asset allocation scheme with no exit strategy in case the markets head south, simply does not add value to justify that type of compensation. With no fiduciary relationship nor any responsibility, it does nothing but support the ITCS principle.

What is ITCS?

It’s The Commission, Stupid.

No Load Fund/ETF Tracker updated through 12/17/2009

Ulli Uncategorized Contact

My latest No Load Fund/ETF Tracker has been posted at:

http://www.successful-investment.com/newsletter-archive.php

More of the same from last week, with the major indexes not making any headway. The Nasdaq bucked the trend and gained 1%.

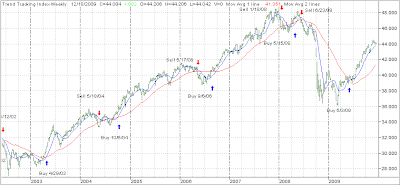
Our Trend Tracking Index (TTI) for domestic funds/ETFs has now crossed its trend line (red) to the upside by +6.61% keeping the current buy signal intact. The effective date was June 3, 2009.


The international index has now broken above its long-term trend line by +8.89%. A Buy signal was triggered effective May 11, 2009. We are holding our positions subject to a trailing stop loss.

[Click on charts to enlarge]
For more details, and the latest market commentary, as well as the updated No load Fund/ETF StatSheet, please see the above link.