Protection Against Rising Interest Rates

Ulli Uncategorized Contact

Lately, dealing with the specter of potentially rising interest rates has been a frequent question. In “Three ETFs For Rising Interest Rates,” several possibilities are discussed:

We’ve been enjoying historically low interest rates for the last decade … even more so in the last two years. You know the party is going to end at some point. And I’m beginning to suspect the end will come sooner rather than later.

Whenever rates move back up, you won’t have to just sit still and accept it. Exchange-traded funds (ETFs) give you many ways to protect your principal and profit from rising rates. Today I’ll tell you about three of them …

Rising Rate Protection ETF #1:
iShares 1-3 Year Treasury ETF (SHY)

A cardinal rule of debt is that overstretched, low-income borrowers pay higher interest rates. And right now no one is more burdened with debt than the U.S. government.

When rates do go up, the first domino to fall will be long-term bonds: Treasury debt maturing in ten years or more. This means you can expect a stampede into the short end of the maturity scale. Then the shortest-term Treasury paper will go up in value simply because so many people will want to own it.

SHY is an ETF tailor-made for this scenario. It holds Treasury debt that matures in the 1-3 year range. This is a “sweet spot” for investors: Long enough to give you some time, but short enough to avoid long-term forecasting errors.

Could SHY get hurt if short-term rates go up? Absolutely. However, I still think this ETF will outperform long-term bonds over the next few years, all things considered. So take a look at SHY for money that you need to keep safe.

Rising Rate Protection ETF #2:
ProShares UltraShort 7-10 Year Treasury (PST)

When interest rates go up, bond prices go down. That’s because newly-issued bonds will pay higher rates than older ones, which makes the old ones worth less.

The longer the maturity, the more the price is affected by rising rates. And the change can be significant for bonds in the 7-10 year range. That’s where an inverse ETF like PST can help. PST could rise as much as 10 percent for each 1 percent jump in the 10-year Treasury rate.

PST does this by shorting Treasury bonds. And while that can work for short-term trades, it’s not a very good long-term strategy …

Moreover, PST employs 2x leverage, so you are effectively paying interest twice.

The best opportunity for making money with PST is to own it for no more than a few weeks when 10-year interest rates are going up. If you hang on after rates level off, you could actually lose ground and your profits will eventually disappear because of the interest payments.

Rising Rate Protection ETF #3:
Direxion Daily 30-Year Treasury Bear 3x Shares (TMV)

If you believe long-term rates are headed up, and soon, TMV could be your ticket to major profits. It’s an inverse ETF that tracks 30-year bond prices with 3x leverage.

Suppose, for instance, interest rates spike higher and the 30-year bond price index falls 5 percent in a day … you can expect TMV to rise 15 percent on that same day. Yowza!

This leverage could also be a ticket to major losses. For example, if your timing is off, even by a few days, you could get your head handed to you. That’s why leveraged ETFs are intended only for the most aggressive investors.

Another thing to consider is the “Daily” part of the name. Leverage in TMV and similar ETFs is reset every day. Over time, this means the leverage factor on your shares could be much more than 300 percent — or much less.

These are certainly 3 alternatives on how to profit in a rising interest rate environment. The last two are clearly designed for aggressive investors only using these ETFs on a short-term trading basis and not as a long-term holding.

These are only some of the possibilities when interest rates are starting to move higher. As trend followers, we have some other options, but they are not apparent at this point.

For example, I could imagine that some currencies (like the dollar) or other asset classes would make a move as well. It’s not that difficult to track if you use my weekly StatSheet as a guide and focus on the %M/A column in the ETF Master List.

The %M/A column shows how far above or below a fund/ETF is currently positioned relative to its own long term trend line (39 week SMA). What you want to look for is an ETF that is currently in negative territory and moving up.

Once the price breaks through its trend line to the upside, which is identified by a positive %M/A number, it indicates a trend change and you could consider taking a position subject to our trailing stop loss rules.

While every investor wants to know in advance what to buy when interest rates head higher, this is not always possible. Let the trends be your guide in filtering out the daily market noise and wait until a clear signal has emerged before taking action.

Disclosure: I have no holdings in the ETFS discussed

All Emerging Market ETFs Are Not The Same

Ulli Uncategorized Contact


Two of the most well known emerging market ETFs are EEM and VWO. If you chart them side by side, they appear almost identical, but are they?

Actually, there are tracking differences more closely described in “Vanguard Sector Funds Get Facelift:”

At the close of February, Vanguard altered the benchmarks on its family of index-backed sector exchange-traded funds and mutual funds.

Vanguard made these changes to make the funds more tax friendly and to make them more closely track their respective indices. Before the switch, Vanguard’s sector ETFs and mutual funds tracked traditional MSCI sector indices, which weigh individual companies from their respective sectors based purely on stock market values.

Although this is the most efficient way to ensure that the indices provide the most realistic view of the actual makeup of the market, using them to create ETFs raises red flags with the IRS.

To prevent a fund from becoming too heavily weighted in a small number of holdings, the IRS has implemented a number of diversification rules that ETF and mutual fund providers must comply with in order to qualify for favorable tax treatment. Failure to meet these requirements results in double taxation.

The importance of keeping tracking error to the minimum is highlighted by Vanguard’s success with its emerging-market ETF.

Over the past few months, investors have been fleeing from the iShares MSCI Emerging Markets Index Fund (EEM) and pouring into the Vanguard Emerging Markets ETF (VWO). These two instruments track the same index: the MSCI Emerging Market Index. At first, one would assume that comparing these funds would be akin to comparing apples to apples. However, if one delves deeper into the inner workings of the two funds, it becomes apparent why investors choose one over the other.

Although each of these funds seeks to track the performance of the same index, each does so differently. The EEM uses a sampling process, leading to the construction of a fund consisting of 439 of the more than 700 constituents in the MSCI Emerging Market Index.

VWO, on the other hand, tracks more than 800 positions, making it even more diverse than the index. By tracking a sampled version of the index, EEM’s performance at times will not always mimic the index.

Year to date through March 3, VWO’s more comprehensive approach to tracking its index has paid off. Not only has the fund seen massive investor inflows, but it has managed to outperform EEM, which is down -2.1% compared with EEM’s 3.3% drop. The MSCI Emerging Market Index is down 2.3% over the same period.

Seeing the success of VWO, it’s no wonder that Vanguard has taken an important step to fix the tracking error issues facing its sector focused instruments while meeting the requirements of the IRS. The funds now track brand new underlying indices.

Rather than tracking the traditional versions of the MSCI indices, Vanguard’s sector funds now track MSCI 25/50 indices, which meet the IRS requirements.

The 3-months chart above shows a slight edge in favor of VWO, although I can’t be sure that this is due to the above mentioned tracking changes.

Tracking underlying indexes is a complex process, and adding a layer of IRS requirements certainly does not make things easier. Whether over the long term the performance will be affected to such a degree that VWO turns out to be a much better choice than EEM still remains to be seen.

Looking at my data base, I find that that VWO indeed shows slightly better momentum numbers than EEM:

VWO:

M-Index: -1
DD%: -6.8%
MaxDD%: -13.90

EEM:

M-Index: -2
DD%: -7.66%
MaxDD%: -14.78%

The bottom line is that both are good funds to be used with our trend tracking rules, with VWO being a little less volatile.

Disclosure: We currently have positions in one of the funds mentioned above.

Traveling

Ulli Uncategorized Contact

Since I’ll be traveling most of this weekend, I won’t be able to post this Sunday. Regular posting will resume on Monday when I return to the office.

Wealth Destroyers

Ulli Uncategorized Contact

MarketWatch had this to say in “Wealth creators vs. wealth destroyers:”

To learn that your mutual-fund firm’s lineup posted negative returns over a decade is one thing; to realize that almost $60 billion of investors’ wealth was wiped out is another matter entirely.

That’s what happened at Janus Capital Group Inc. from 2000 through 2009. The fund giant’s offerings collectively saw 10-year asset weighted total return of minus 1% a year, which translates into $58.4 billion of investment losses.

Janus was the worst “wealth destroyer” in a study released this week from investment researcher Morningstar Inc. Results were not much better at Putnam Investments, which shredded $46.4 billion of shareholder wealth in the period, while mutual funds at AllianceBernstein Holdings and Invesco Aim, a unit of Invesco Ltd. lost shareholders $11.4 billion and $10.1 billion, respectively.

The figures show that fund investors risk not only picking the wrong type of investment, but also choosing the wrong firm for the job. All five of these fund families were heavily invested in technology and growth stocks — the decade’s biggest wealth-destroying fund categories. Large-cap growth funds lost $107.6 billion for investors while tech funds erased $62.8 billion of their money in the period.

“Results were really influenced by what happened at the start of the decade, when investors rushed to tech and growth and then they crashed,” said Sonya Morris, editorial director at Morningstar.

I continue to be amazed that, even with the benefit of hindsight, the blame is being put on mutual fund companies and not where it really belongs. While I am not a friend of some of the companies mentioned in this article, fund firms are simply following the rules their charter, which dictates that they are to be invested in their area of expertise (large growth, mid-cap, etc.) at all times, so that the public has the opportunity to buy and sell their funds.

In other words, all offered equity funds will always be long in the market, no matter what. While this works well during bullish periods, it will turn into disaster whenever a bear market strikes, especially if it happens twice in a decade. Sure, depending on their stated objectives, some equity funds lost less than others, but they still lost.

Given this known set up, mutual funds are not the wealth destroyer as they were made out to be in this story. The real culprit and destroyer of wealth was the investment approach, if you can call it that, of mindless buying and holding.

All of the above mentioned funds did well in the past decade during times of bullishness. It’s a matter of fact, I owned many of them but only as long as they were trending upwards.

The bottom line is that it’s not always the investment that should be blamed for poor performance; it’s what you do with it that matters.

The lesson learned from the past decade should be that the blame lies with the investment approach and not necessarily with the investment as I pointed out in “Saving A “Good” Mutual Fund From A Bad Ride.”

No Load Fund/ETF Tracker updated through 3/4/2010

Ulli Uncategorized Contact

My latest No Load Fund/ETF Tracker has been posted at:

http://www.successful-investment.com/newsletter-archive.php

A better than expected unemployment report pushed the major indexes higher with the S&P; 500 gaining 3% for the week.

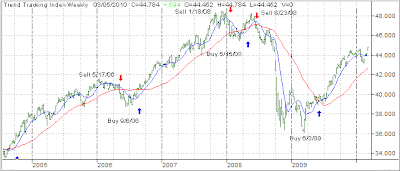
Our Trend Tracking Index (TTI) for domestic funds/ETFs has now crossed its trend line (red) to the upside by +4.91% keeping the current buy signal intact. The effective date was June 3, 2009.


The international index has now broken above its long-term trend line by +5.67%. A Buy signal was triggered effective May 11, 2009. We are holding our positions subject to a trailing stop loss.


[Click on charts to enlarge]

For more details, and the latest market commentary, as well as the updated No load Fund/ETF StatSheet, please see the above link.

Running Out Of Steam

Ulli Uncategorized Contact


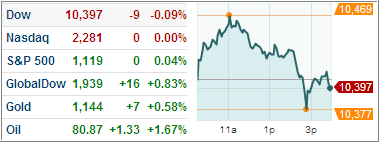
In an almost identical performance from the prior trading day, the early rally attempt on Wednesday was rebuffed, and the major indexes ended up essentially unchanged.

For the time being, it seems that selling sets in when the S&P; 500 moves to its resistance level in the 1,125 area. Even decent economic news could not prevent the slide.

Maybe it’s the calm before the storm on Friday when the Labor Department issues its nonfarm payroll report. Economists predict a loss of 75,000 jobs in February in part due to the winter storms.

If this number comes in much better, we might see another attempt to break through the S&P;’s resistance level. If it comes in much worse, we could see more acceleration to the downside. Again, there is no reason to make quick, irrational decisions; let the market come to you and execute your sell stops if/when necessary.