
[Chart courtesy of MarketWatch.com]
- Moving the market
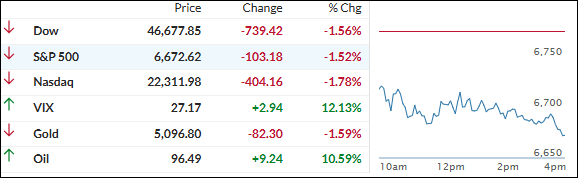
The major indexes opened under pressure and stayed there for most of the day, as oil prices kept surging on supply disruption fears from the ongoing U.S.-Iran war.
West Texas Intermediate crude jumped 9% to around $95 a barrel, while Brent climbed 8% to roughly $100.
Iran’s new Supreme Leader Mojtaba Khamenei (appointed March 9) doubled down, saying the Strait of Hormuz should stay closed as a “tool to pressure the enemy.”
Energy Secretary Chris Wright added that the U.S. Navy isn’t ready yet to escort tankers through the Strait but should be by month’s end. Overnight, three more foreign vessels were hit in the Persian Gulf—traffic there is basically at a standstill.
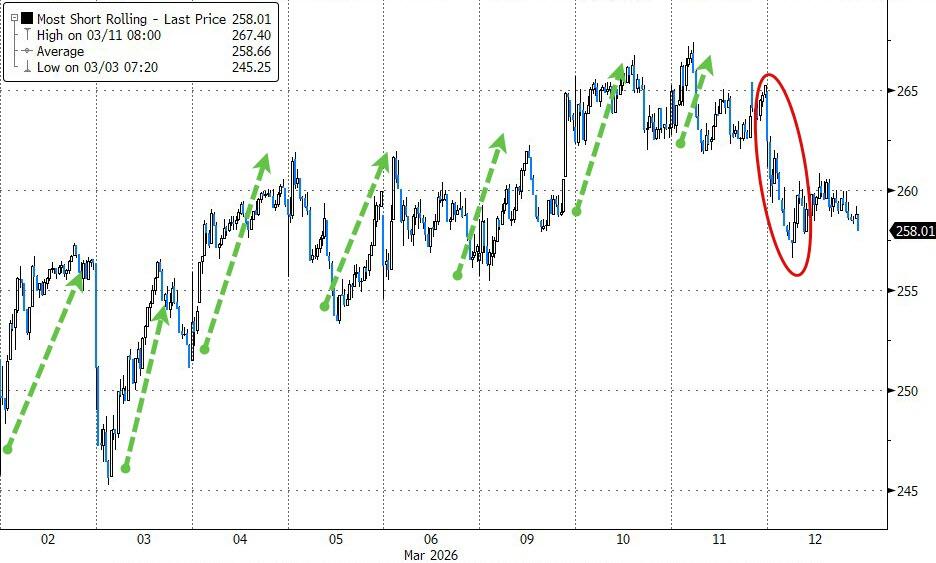
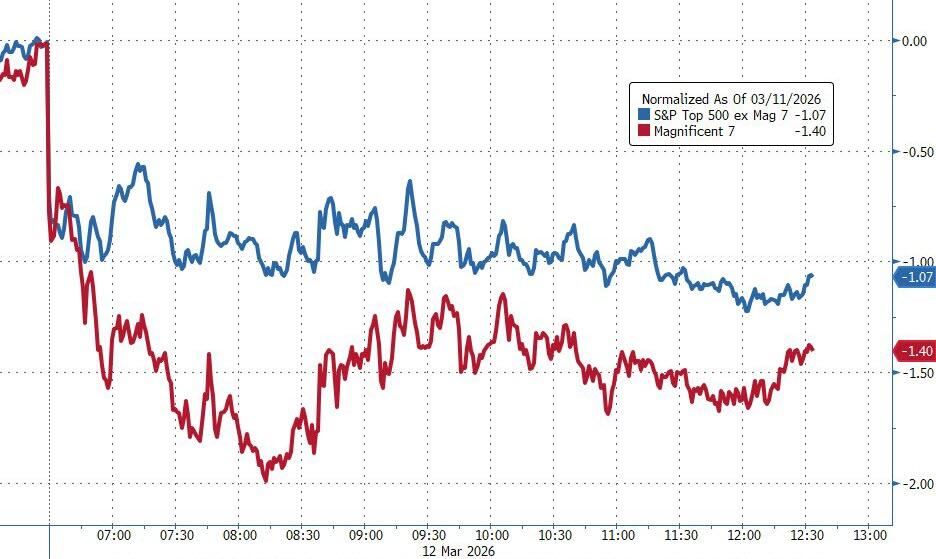
That oil spike fueled inflation worries and kept risk-off sentiment in charge. The S&P 500 and Dow closed sharply lower, with the Nasdaq also in the red. Small Caps were the day’s biggest loser (no short squeeze help), and the Mag 7 underperformed the rest of the S&P.
On the macro side, things were actually upbeat: January trade deficit narrowed, housing starts rose 7.2% (beating expectations), initial jobless claims edged down, and GDP tracking now sits at 3.3% annualized. But the oil and war headlines drowned it all out.
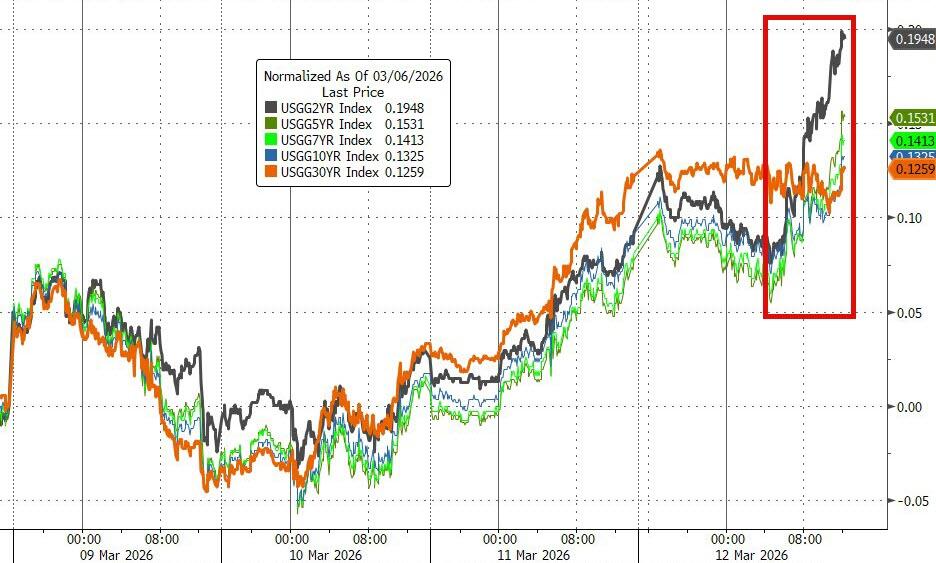
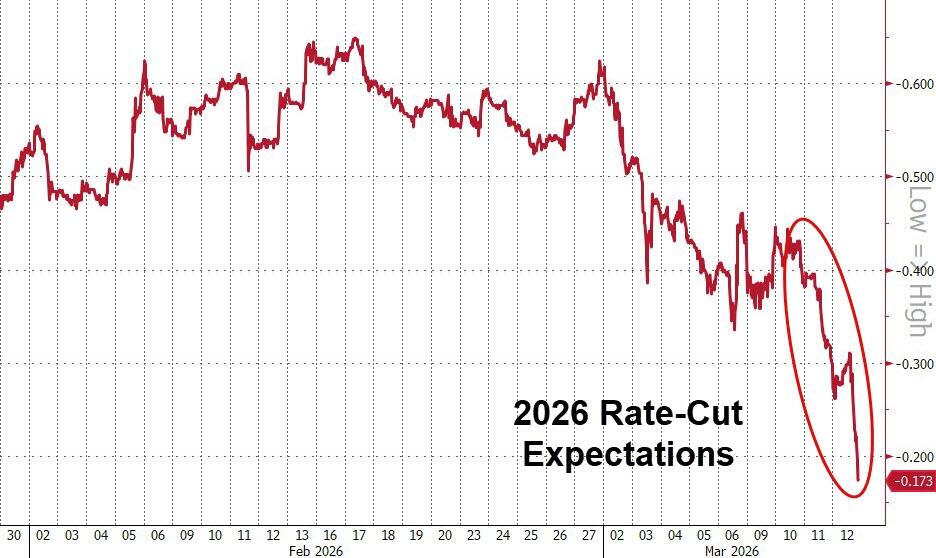
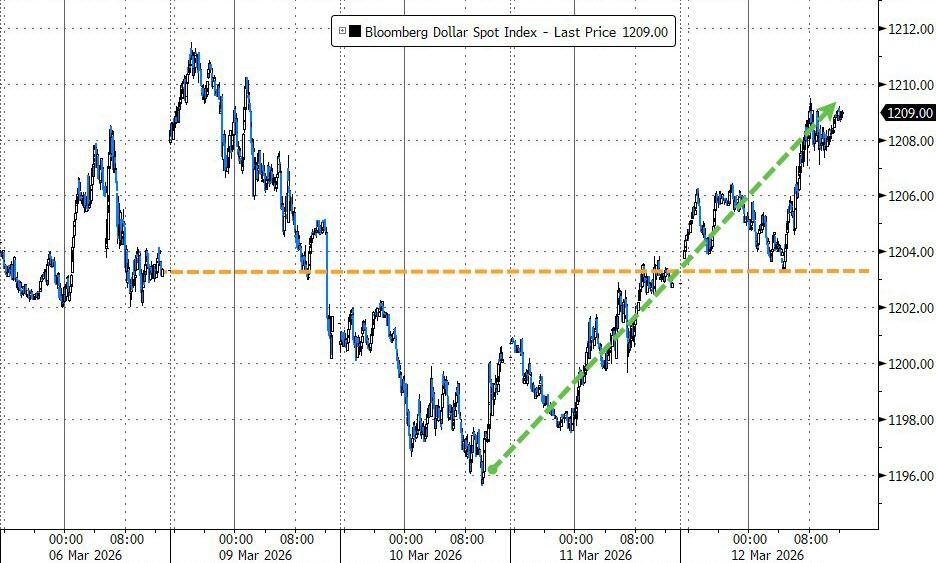
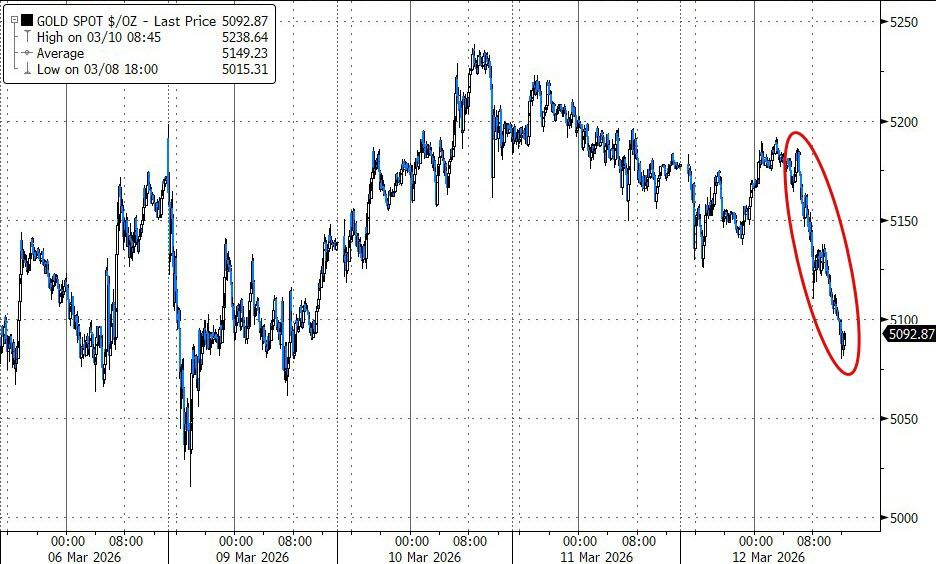
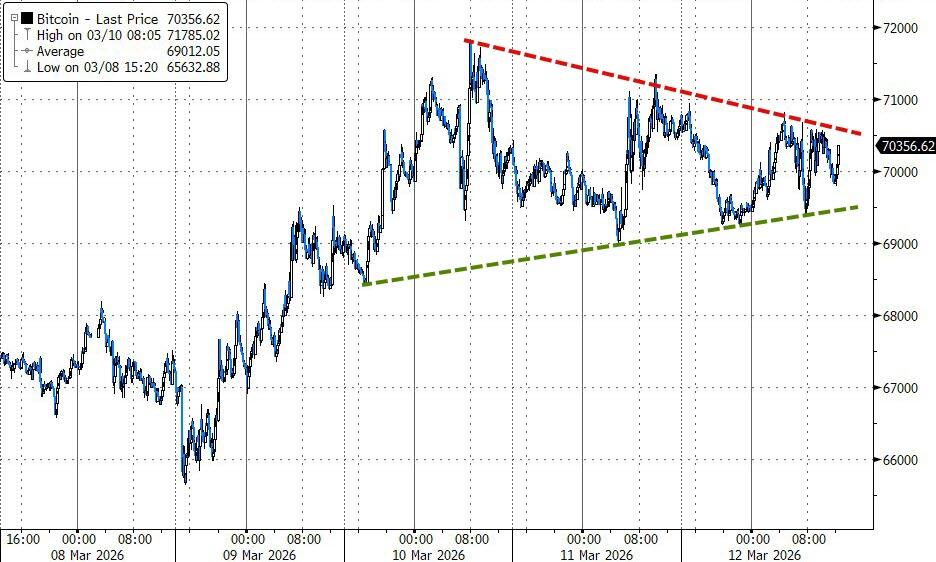
Bond yields rose across the board (rate-cut expectations collapsed), the dollar rallied for the second day in a row, gold broke back below $5,100, and Bitcoin stayed coiled in a tight range around $70,000—breakout coming, but direction unclear.
2. Current domestic “Buy” Cycle (effective 5/20/2025); International “Buy” Cycle (effective 5/8/25)
Our domestic bullish cycle that began on November 21, 2023, concluded on April 3, 2025, following a market downturn triggered by President Trump’s tariff policy announcement.
This development caused significant declines across major indexes and broader market indices. However, markets subsequently rebounded, culminating in a new domestic “Buy” signal taking effect May 20, 2025.
Concurrently, our International Trend Tracking Index (TTI) experienced parallel volatility. On April 4, 2025, it breached critical thresholds, prompting a “Sell” recommendation. This position reversed as global markets recovered, with the International TTI regaining sufficient momentum to issue a new “Buy” signal effective May 8, 2025.
3. Trend Tracking Indexes (TTIs)
After yesterday’s nice comeback, the major indexes hit the skids right out of the gate and never really recovered.
Everything closed deep in the red—broad selling pressure across the board, with no real safe spots except bitcoin, which held up fairly well and didn’t get dragged down as hard.
Our TTIs followed the same southerly trend and pulled back too. Both reduced their cushion above their long-term trend lines a bit, but they’re still sitting in bullish territory—no trend reversal here.
This is how we closed 03/12/2026:
Domestic TTI: +2.08% above its M/A (prior close +3.69%)—Buy signal effective 5/20/25.
International TTI: +5.64% above its M/A (prior close +7.05%)—Buy signal effective 5/8/25.
All linked charts above are courtesy of Bloomberg via ZeroHedge.
———————————————————-
WOULD YOU LIKE TO HAVE YOUR INVESTMENTS PROFESSIONALLY MANAGED?
Do you have the time to follow our investment plans yourself? If you are a busy professional who would like to have his portfolio managed using our methodology, please contact me directly to get more details.
Contact Ulli