
[Chart courtesy of MarketWatch.com]
- Moving the market
The major indexes opened lower as traders kept one eye on the ongoing U.S.-Iran conflict and oil prices, which spiked early on worries about supply disruptions.
The Dow was the biggest laggard, but the broader market got a lift later when the International Energy Agency announced it would release 400 million barrels from its reserves—the largest-ever drawdown—to help offset the war-related supply squeeze.
Overnight reports added to the tension: U.S. forces reportedly sank several Iranian ships (including 16 minelayers) near the Strait of Hormuz, where Tehran had been trying to mine the route.
But President Trump had said earlier this week that the war would end “very soon,” which reinforced hopes for a quick de-escalation and helped calm nerves.
The February CPI came in at 2.4% year-over-year, right in line with expectations, following recent signs of a softening labor market. That gave the Fed a little breathing room but didn’t spark any fireworks.
Oracle was the day’s standout, jumping 10% after beating Q3 earnings and revenue and raising its fiscal 2027 forecast.
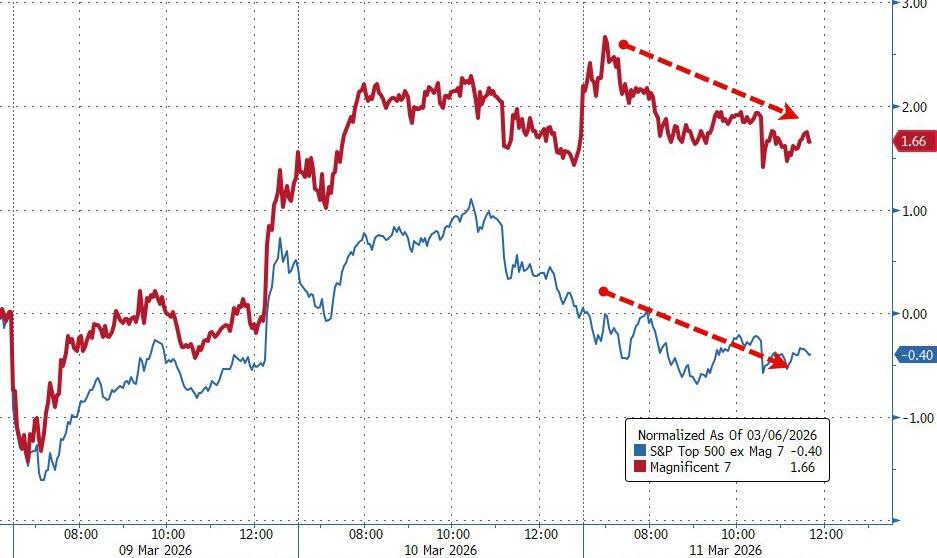
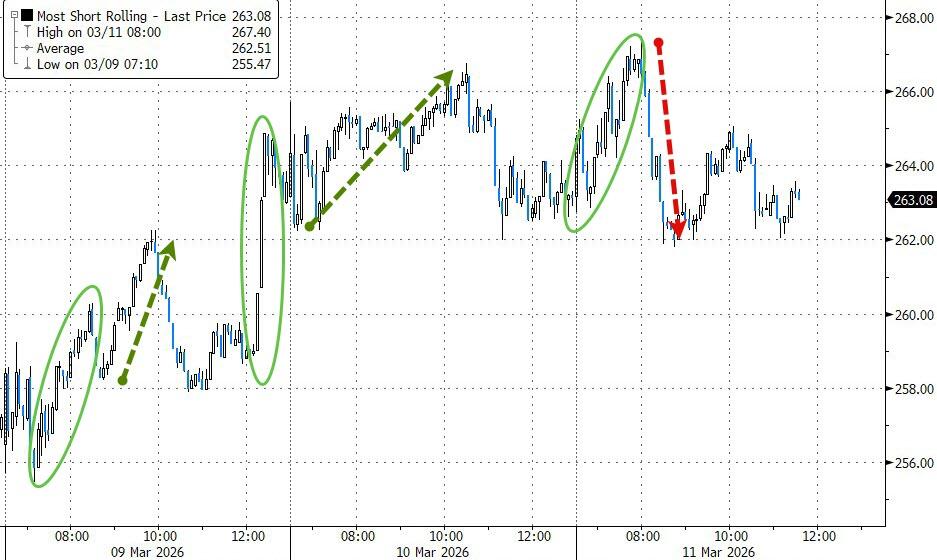
The Mag 7 managed to outperform the rest of the S&P 493 despite some afternoon fading, while an early short squeeze in small caps lost steam.
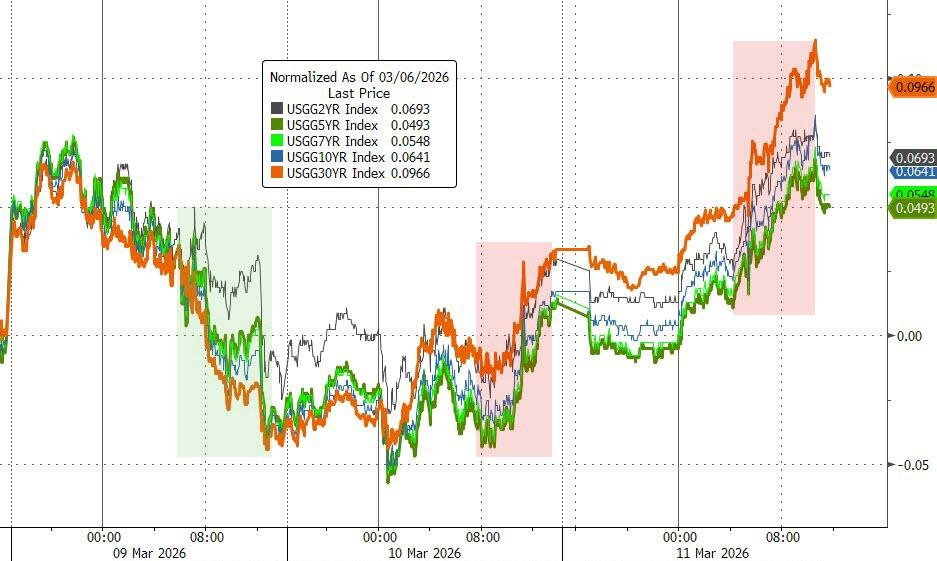
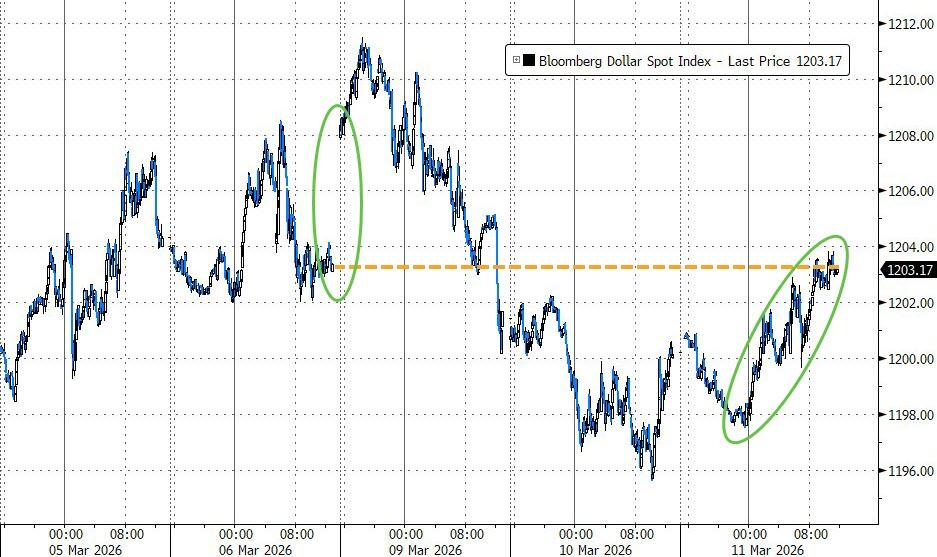
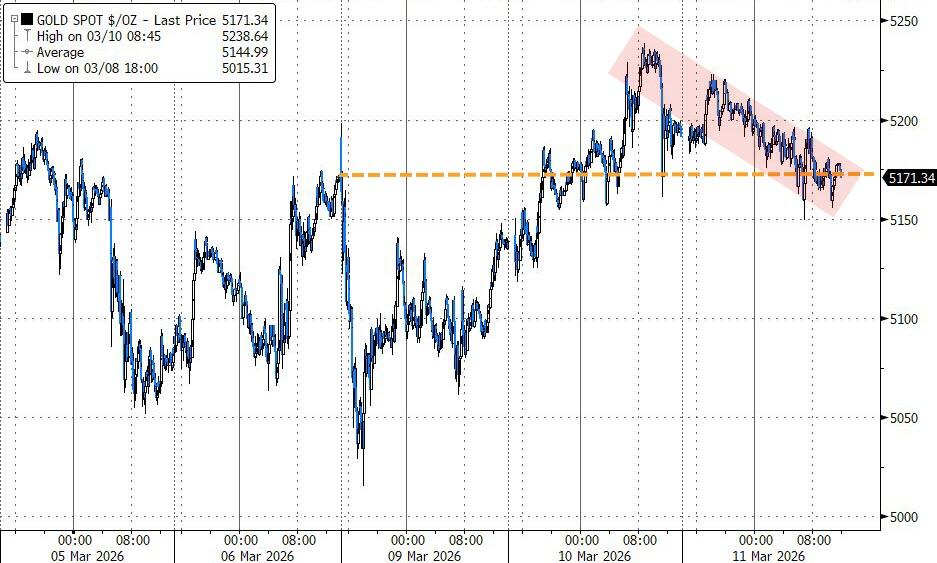
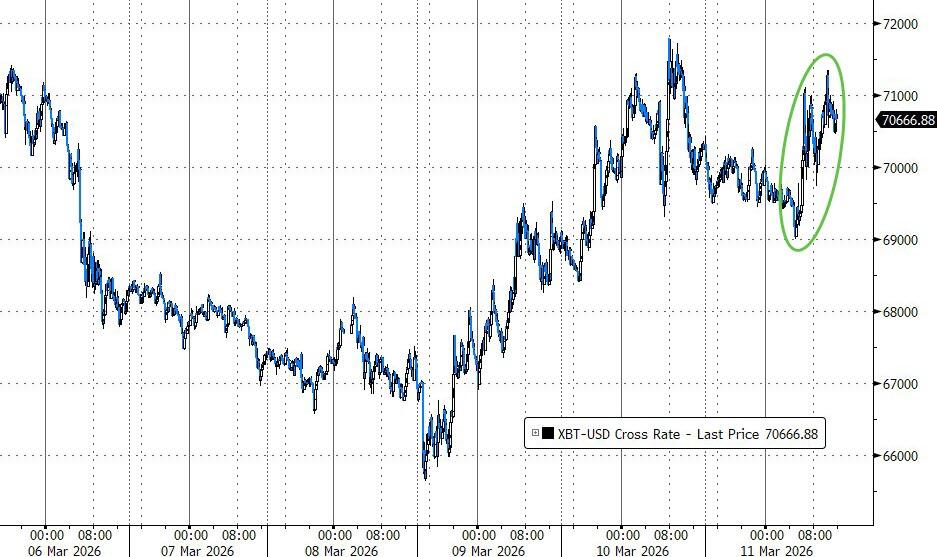
Bond yields rose sharply (taking some wind out of equities), the dollar gained, gold lost its $5,200 handle again, and Bitcoin dipped mid-session but rallied briefly above $71K before settling with a small gain.
As we’ve seen all week, this market can swing violently in both directions on headline ping-pong—today was no exception.
2. Current domestic “Buy” Cycle (effective 5/20/2025); International “Buy” Cycle (effective 5/8/25)
Our domestic bullish cycle that began on November 21, 2023, concluded on April 3, 2025, following a market downturn triggered by President Trump’s tariff policy announcement.
This development caused significant declines across major indexes and broader market indices. However, markets subsequently rebounded, culminating in a new domestic “Buy” signal taking effect May 20, 2025.
Concurrently, our International Trend Tracking Index (TTI) experienced parallel volatility. On April 4, 2025, it breached critical thresholds, prompting a “Sell” recommendation. This position reversed as global markets recovered, with the International TTI regaining sufficient momentum to issue a new “Buy” signal effective May 8, 2025.
3. Trend Tracking Indexes (TTIs)
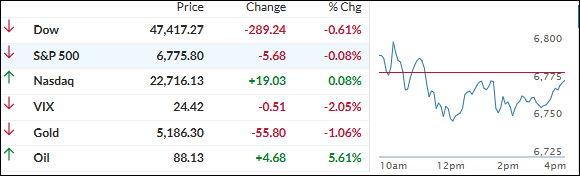
The major indexes spent the whole session wandering around without any real conviction or direction—up a little, down a little, mostly just drifting.
The Dow ended up closing in the red, while the S&P 500 and Nasdaq barely hung on to finish right around unchanged.
The metals pretty much went nowhere, just treading water, but bitcoin held steady and didn’t budge much either.
Our TTIs pulled back a moderate amount along with the broader market, but both are still sitting comfortably above their long-term trend lines, so the overall bullish picture hasn’t changed.
This is how we closed 03/11/2026:
Domestic TTI: +3.69% above its M/A (prior close +4.03%)—Buy signal effective 5/20/25.
International TTI: +7.05% above its M/A (prior close +7.21%)—Buy signal effective 5/8/25.
All linked charts above are courtesy of Bloomberg via ZeroHedge.
———————————————————-
WOULD YOU LIKE TO HAVE YOUR INVESTMENTS PROFESSIONALLY MANAGED?
Do you have the time to follow our investment plans yourself? If you are a busy professional who would like to have his portfolio managed using our methodology, please contact me directly to get more details.
Contact Ulli