
ETF Tracker StatSheet
You can view the latest version here.
BITCOIN BOUNCES, GOLD RECOVERS—BUT STOCKS STAY IN THE RED
- Moving the market
Stocks stumbled out of the gate this week, with tech once again leading the decline. Big names in artificial intelligence took a hit, dragging the major indexes into the red.
Nvidia dropped another 3% Thursday, bringing its weekly slide to 10%. Oracle matched that loss, while Palantir sank 14% and Broadcom slipped 6%. Even Microsoft, Tesla, and AMD joined the selloff, weighing heavily on the broader market.
Adding fuel to the fire, October job cut data came in hot — marking the worst layoff numbers for that month in over 20 years. That makes 2025 the roughest year for job losses since the 2009 recession.
All three major indexes are down for the week, with the Nasdaq taking the biggest hit. Despite a late-week bounce, this was still its worst performance since the post–Liberation Day drop in April. Investors are growing wary of sky-high tech valuations and the increasingly narrow leadership in the market.
Still, there’s a glimmer of hope. A year-end rally could be on the table if the government shutdown wraps up and tariff tensions ease. Nvidia’s earnings report in two weeks might reignite the AI story — and if the Fed throws in a December rate cut, we could end 2025 on a high note.
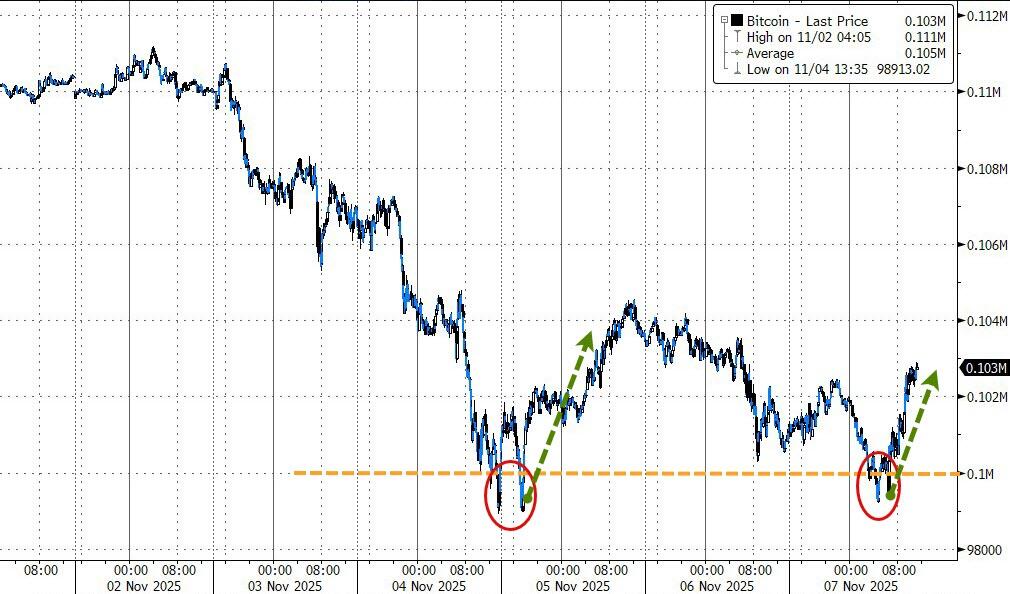
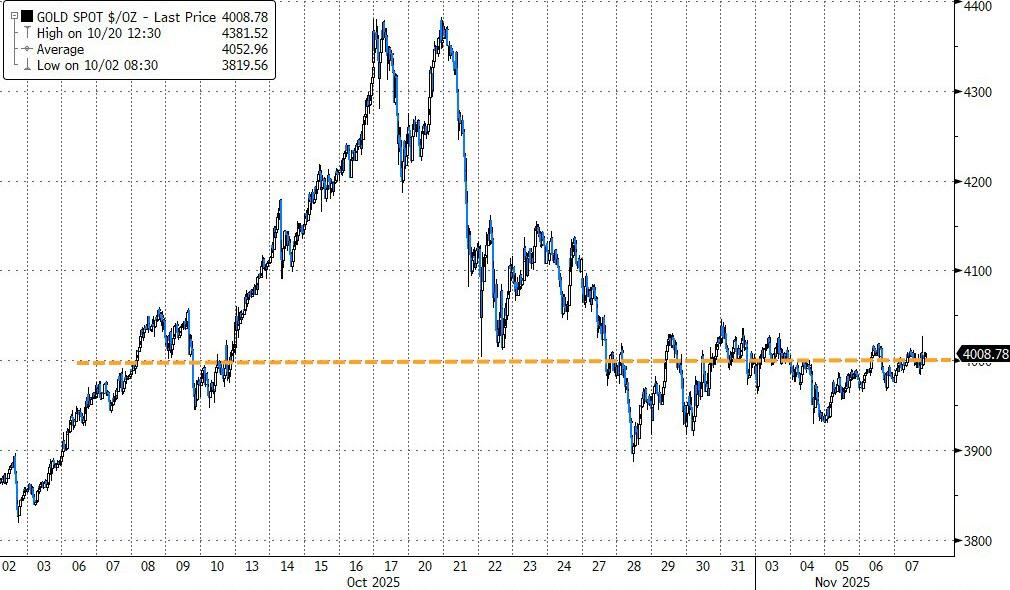
Meanwhile, bond yields dipped, the dollar paused, and bitcoin flirted with the $100k level before bouncing back above $103k. Gold, after two rough weeks, clawed its way back above $4,000.
So, with the week ending in the red, the big question is: Will next week’s economic data bring a turnaround—or are we in for more sideways action as the year winds down?
2. Current domestic “Buy” Cycle (effective 5/20/2025); International “Buy” Cycle (effective 5/8/25)
Our domestic bullish cycle that began on November 21, 2023, concluded on April 3, 2025, following a market downturn triggered by President Trump’s tariff policy announcement.
This development caused significant declines across major indexes and broader market indices. However, markets subsequently rebounded, culminating in a new domestic “Buy” signal taking effect May 20, 2025.
Concurrently, our International Trend Tracking Index (TTI) experienced parallel volatility. On April 4, 2025, it breached critical thresholds, prompting a “Sell” recommendation. This position reversed as global markets recovered, with the International TTI regaining sufficient momentum to issue a new “Buy” signal effective May 8, 2025.
3. Trend Tracking Indexes (TTIs)
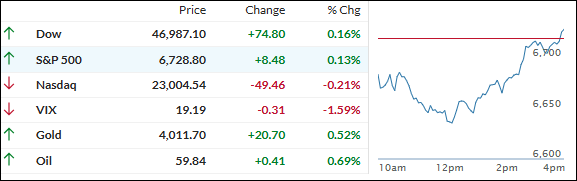
Stocks kicked off the session in the red again but managed to recover by the close, with the Dow and S&P 500 both ending the day modestly higher, even though all the major averages posted losses for the week.
The Nasdaq continued to feel pressure from weakness in tech and artificial intelligence shares, highlighting persistent concerns about lofty valuations.
Our TTIs told a mixed story: the Domestic TTI bounced back with a slight gain, while the International TTI held steady but couldn’t build momentum.
Breadth was still narrow, with leadership concentrated in select sectors while many stocks lagged.
This is how we closed 11/07/2025:
Domestic TTI: +4.67% above its M/A (prior close +3.95%)—Buy signal effective 5/20/25.
International TTI: +9.09% above its M/A (prior close +9.49%)—Buy signal effective 5/8/25.
All linked charts above are courtesy of Bloomberg via ZeroHedge.
———————————————————-
WOULD YOU LIKE TO HAVE YOUR INVESTMENTS PROFESSIONALLY MANAGED?
Do you have the time to follow our investment plans yourself? If you are a busy professional who would like to have his portfolio managed using our methodology, please contact me directly to get more details.
Contact Ulli