
ETF Tracker StatSheet
You can view the latest version here.
MARKETS PAUSE AS FED RATE CUT LOOMS
[Chart courtesy of MarketWatch.com]
- Moving the market
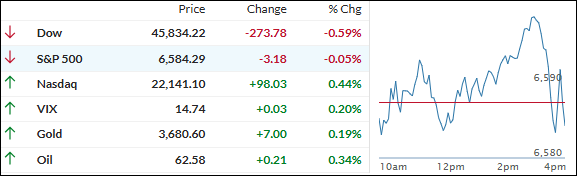
After surging to fresh record highs, the market cooled off in early Friday trading as traders paused to digest a week filled with soft jobs data and surprisingly tame inflation numbers.
Yesterday, all three major indexes closed at new highs—with the Dow finishing above 46,000 for the first time ever—so today’s lackluster start felt like a breather.
Weekly jobless claims jumped to their highest since October 2021, shifting attention away from yesterday’s inflation print, which was a bit hot on the month but right in line on an annual basis.
For now, the signs point to the Fed cutting rates next week, with futures markets all but guaranteeing a quarter-point cut—and growing chatter about a possible bigger move.
Consumer Sentiment also fell short in September, dropping to its lowest level since May. At 55.4, it missed both the forecast and the previous month’s reading, adding some extra gloom to the labor data.
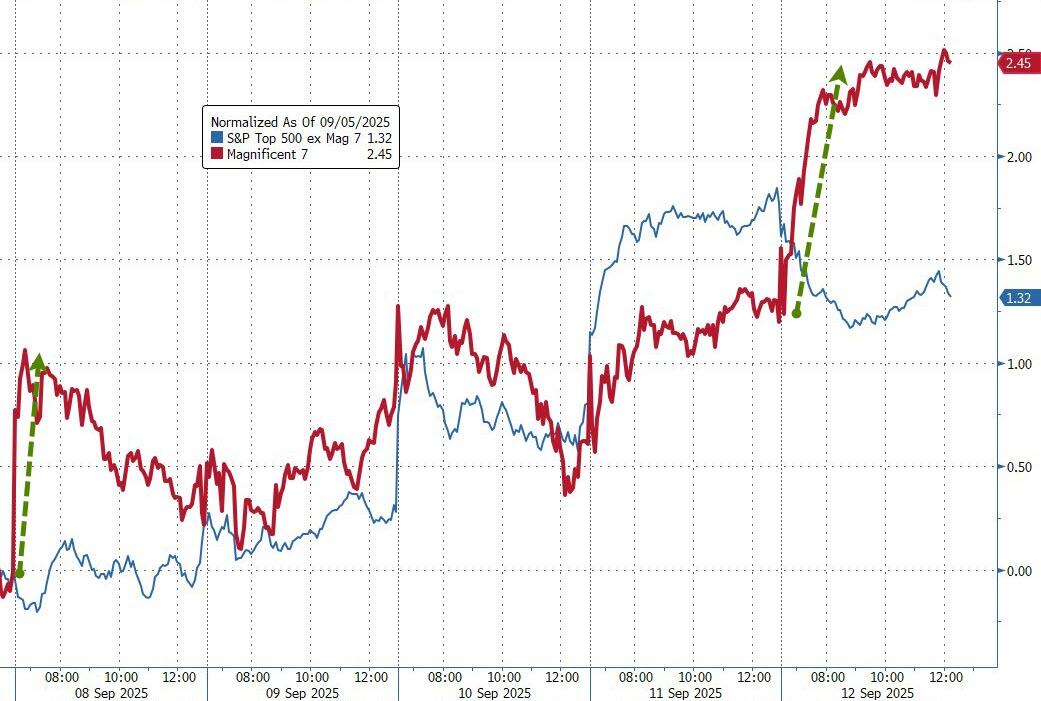
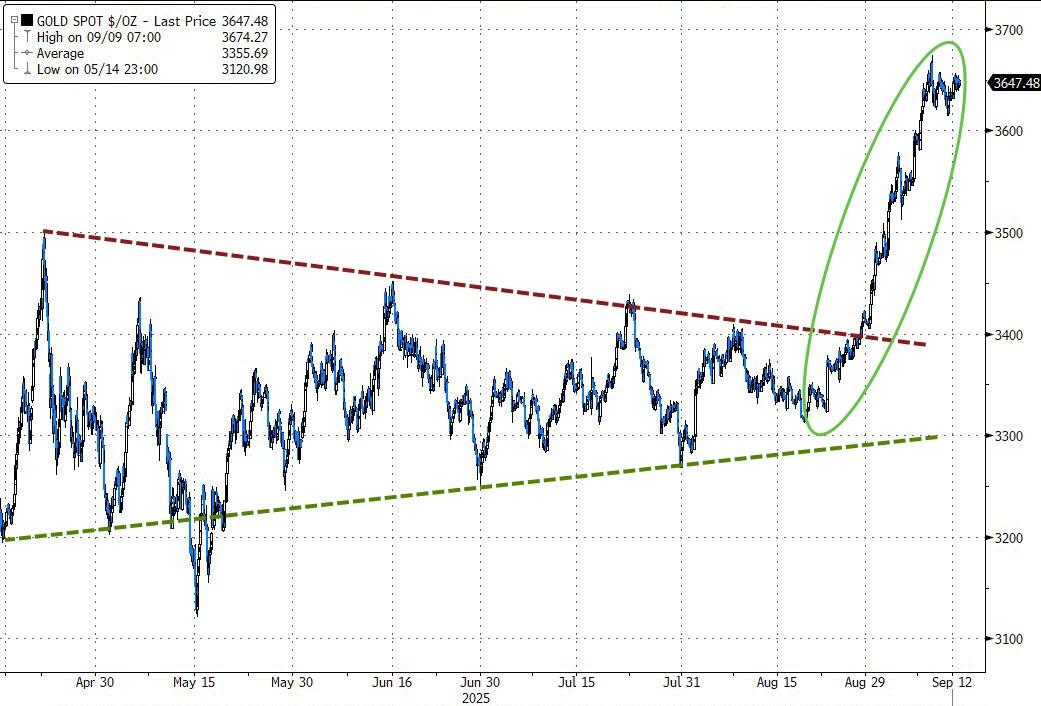
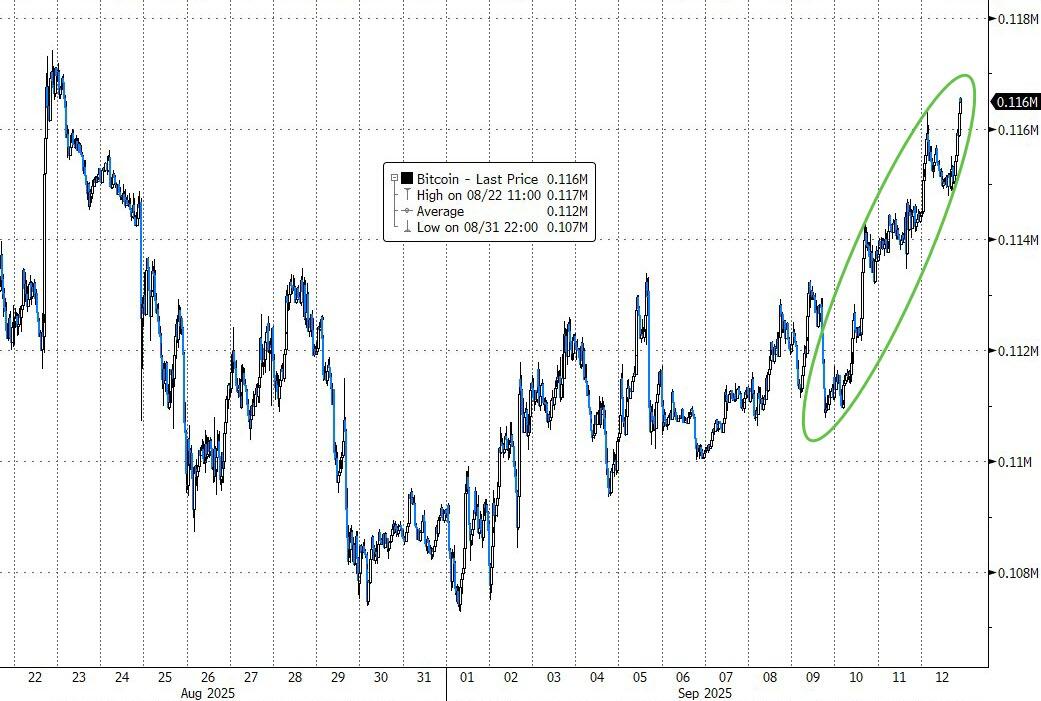
On the bright side, the Mag 7 stocks outperformed again, gold kept its winning streak alive with a fourth consecutive weekly high, and bitcoin powered back above $116k.
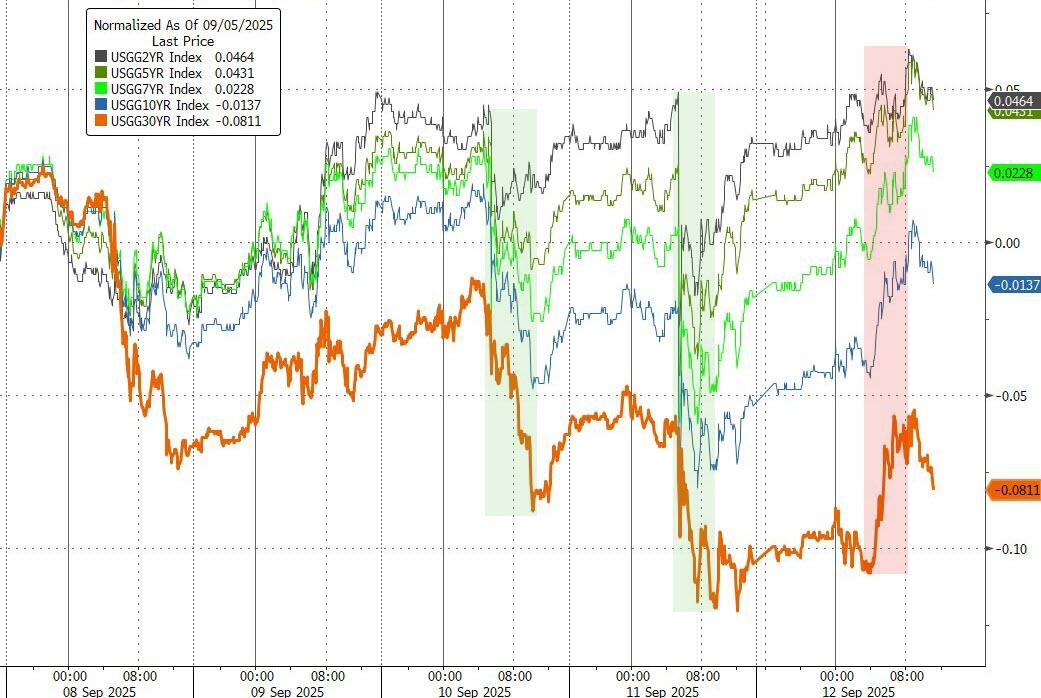
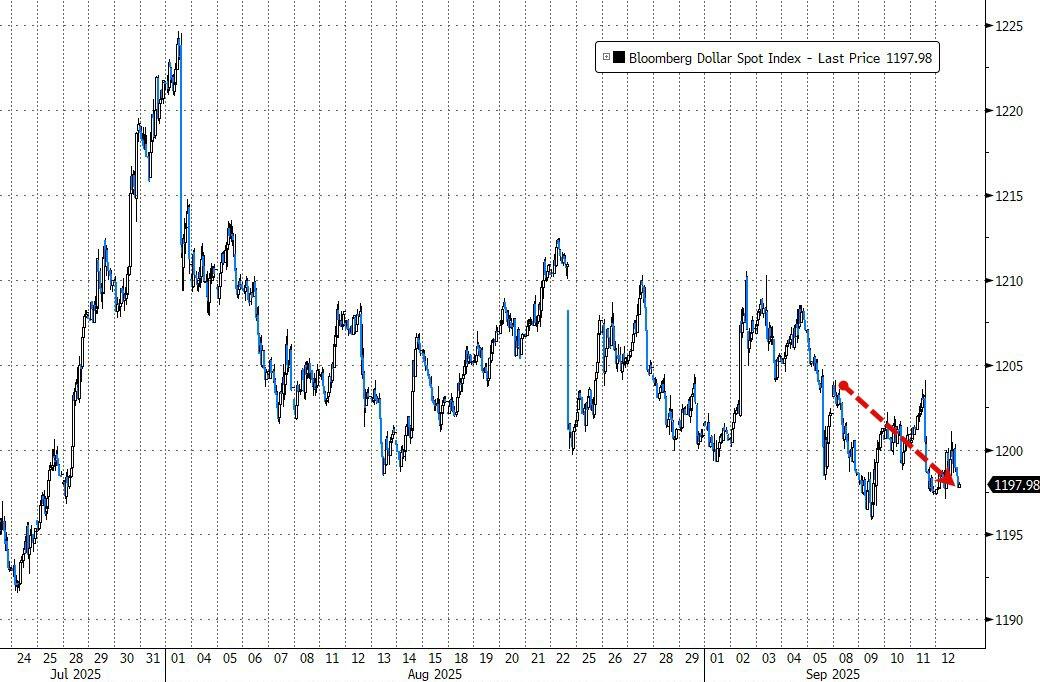
Bond yields were mixed, and the dollar recorded its fifth weekly drop out of the last six.
As one trader pointed out, history favors stocks when the Fed cuts rates in a growing economy, but what happens if recession risks, and stagflation swing back into play?
Wall Street’s got a big wall of worry to climb—will bulls keep running, or will those clouds finally catch up?
2. Current domestic “Buy” Cycle (effective 5/20/2025); International “Buy” Cycle (effective 5/8/25)
Our domestic bullish cycle that began on November 21, 2023, concluded on April 3, 2025, following a market downturn triggered by President Trump’s tariff policy announcement.
This development caused significant declines across major indexes and broader market indices. However, markets subsequently rebounded, culminating in a new domestic “Buy” signal taking effect May 20, 2025.
Concurrently, our International Trend Tracking Index (TTI) experienced parallel volatility. On April 4, 2025, it breached critical thresholds, prompting a “Sell” recommendation. This position reversed as global markets recovered, with the International TTI regaining sufficient momentum to issue a new “Buy” signal effective May 8, 2025.
3. Trend Tracking Indexes (TTIs)
A strong week for stocks faded a bit at the finish line, with today’s weakness clipping some of the shine off a run that saw both the Nasdaq and S&P 500 notch solid gains earlier in the week.
Still, big picture, it was a great stretch for equities and sentiment stayed upbeat.
Our TTIs slipped today but remain comfortably higher than last Friday, and to me, that’s a sign that bullish momentum is very much intact—at least for now.
This is how we closed 09/12/2025:
Domestic TTI: +6.53% above its M/A (prior close +7.45%)—Buy signal effective 5/20/25.
International TTI: +10.91% above its M/A (prior close +11.57%)—Buy signal effective 5/8/25.
All linked charts above are courtesy of Bloomberg via ZeroHedge.
———————————————————-
WOULD YOU LIKE TO HAVE YOUR INVESTMENTS PROFESSIONALLY MANAGED?
Do you have the time to follow our investment plans yourself? If you are a busy professional who would like to have his portfolio managed using our methodology, please contact me directly to get more details.
Contact Ulli