
ETF Tracker StatSheet
You can view the latest version here.
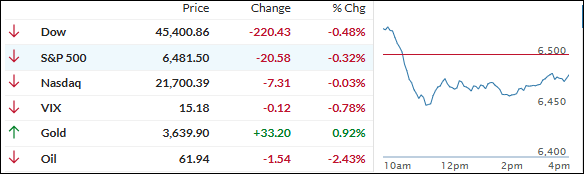
JOBS DATA DISAPPOINTS, SENDING STOCKS LOWER AND GOLD TO RECORD HIGHS
- Moving the market
The market looked strong out of the gate, but that early rally quickly fizzled as a much weaker than expected August jobs report reminded everyone just how fragile the economy is feeling right now.
All three major indexes hit fresh record intraday highs before the mood flipped and selling took over, leaving stocks in the red by the close.
The jobs data was a letdown: just 22,000 new jobs last month—way below the 75,000 expected—and the unemployment rate crept up to 4.3%, right in line with forecasts.
Traders now seem all but convinced the Fed will move forward on that long-awaited rate cut at the September 17 meeting, with markets even pricing in a possible half-point move if the economic pressure keeps building.
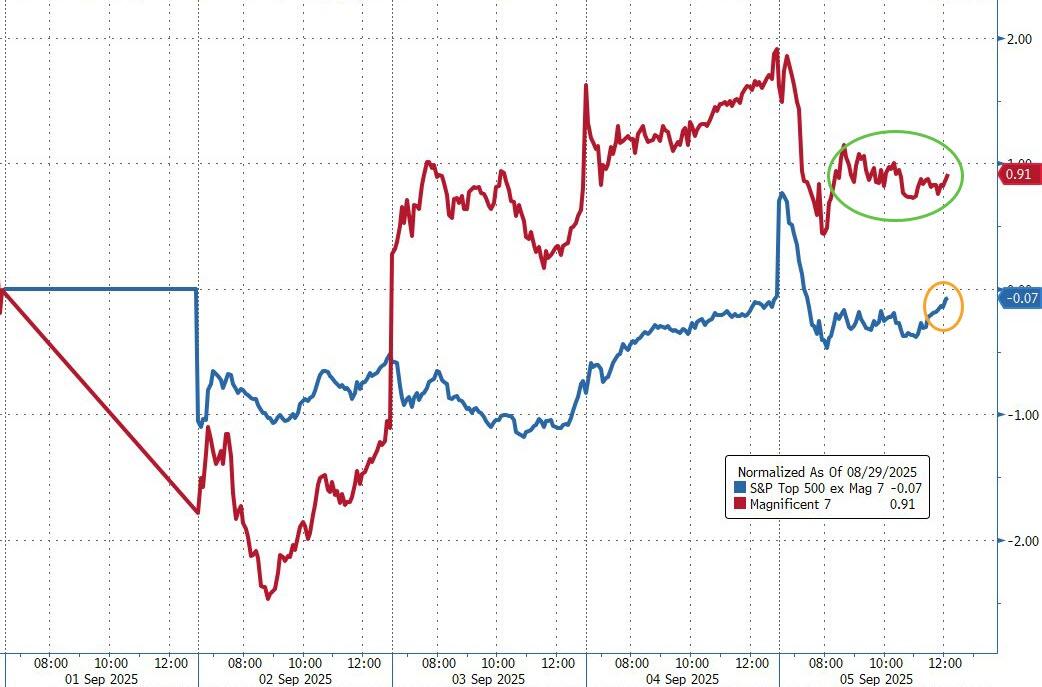
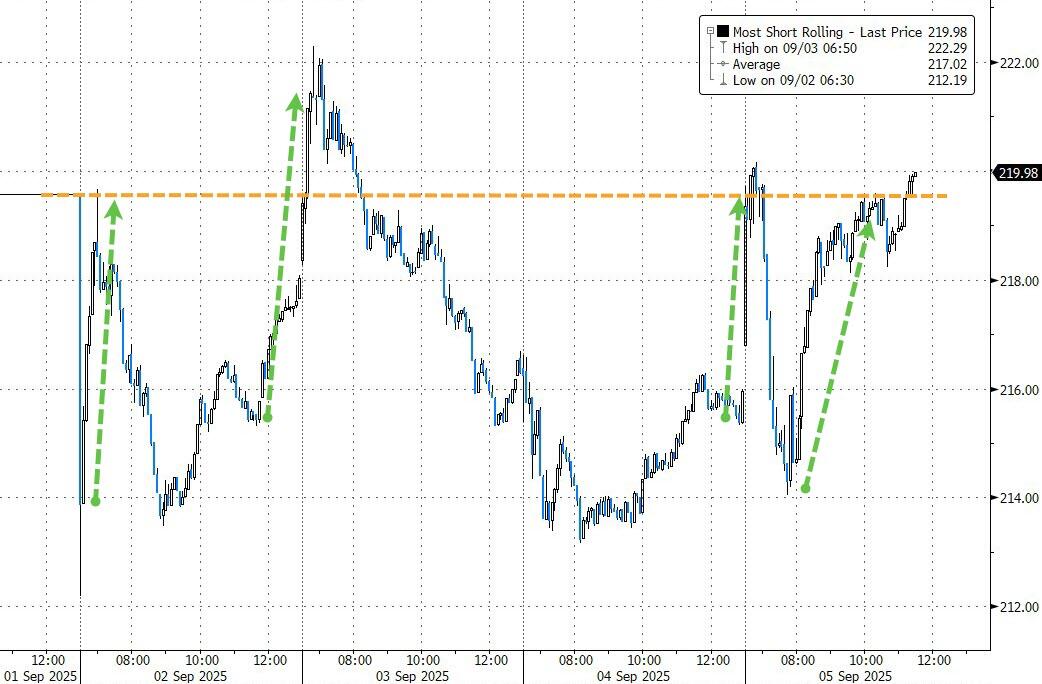
On the week, the Mag 7 mega-cap stocks outperformed, while the rest of the S&P saw red. The most shorted names managed a wild ride back to the flatline by the end of the week.
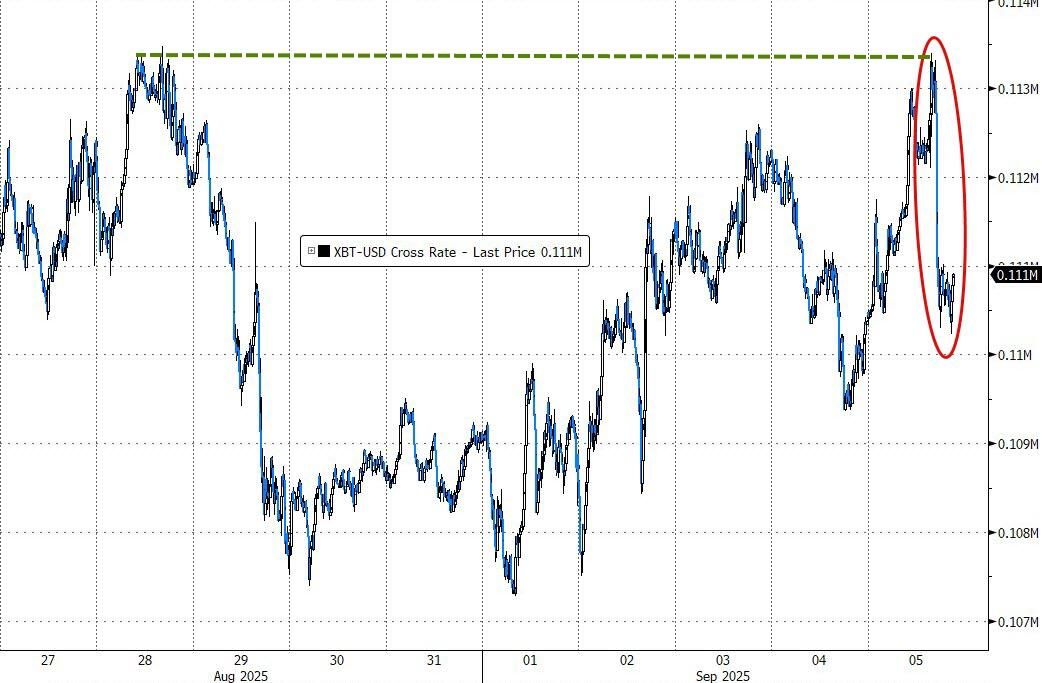
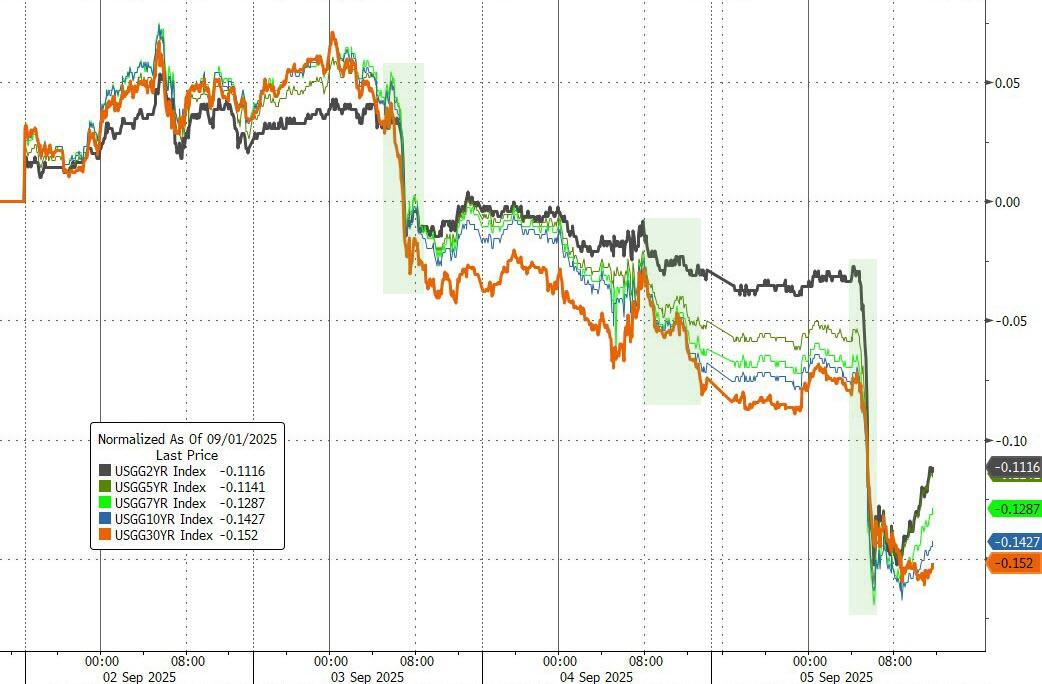
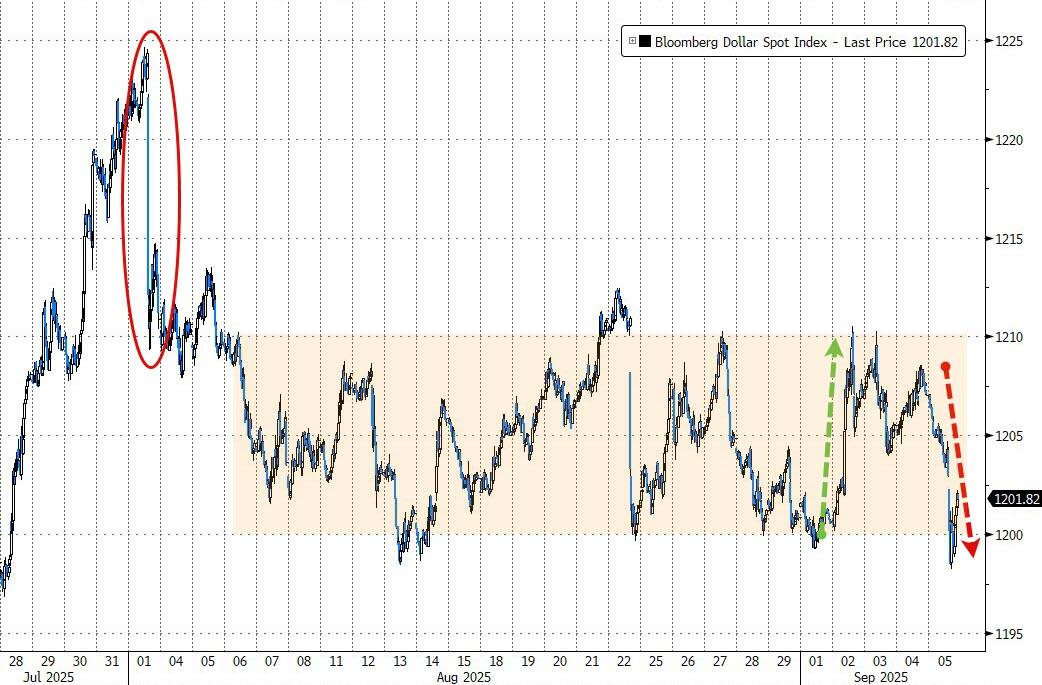
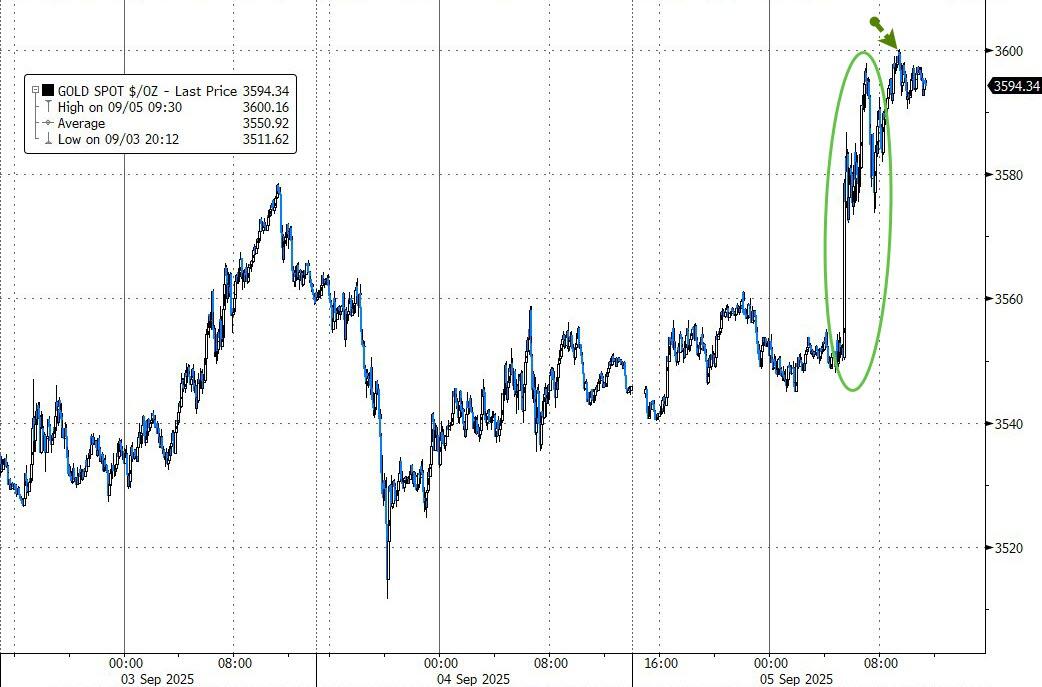
Bitcoin had a great run but lost a little steam today, as bond yields fell and the dollar ended almost unchanged after some choppy action. Gold stole the spotlight—surging to new highs over $3,600—while oil prices dumped amid renewed recession talk.
The way I see it, markets are now caught in a tug-of-war: will mounting recession signals outweigh the boost from expected rate cuts, or can the Fed thread this needle and keep equities afloat longer term?
2. Current domestic “Buy” Cycle (effective 5/20/2025); International “Buy” Cycle (effective 5/8/25)
Our domestic bullish cycle that began on November 21, 2023, concluded on April 3, 2025, following a market downturn triggered by President Trump’s tariff policy announcement.
This development caused significant declines across major indexes and broader market indices. However, markets subsequently rebounded, culminating in a new domestic “Buy” signal taking effect May 20, 2025.
Concurrently, our International Trend Tracking Index (TTI) experienced parallel volatility. On April 4, 2025, it breached critical thresholds, prompting a “Sell” recommendation. This position reversed as global markets recovered, with the International TTI regaining sufficient momentum to issue a new “Buy” signal effective May 8, 2025.
3. Trend Tracking Indexes (TTIs)
Stocks tried to rally early in the session, but the enthusiasm fizzled fast once a disappointing jobs report hit the wires.
That sent the bulls heading for the exits and handed bears a rare win. I think, traders are torn—hoping weak jobs numbers will force the Fed to cut rates, but also worried about what soft data means for the bigger economic picture.
Despite the bumpiness, the S&P 500 eked out a tiny gain for this holiday-shortened week, while our TTIs barely budged and continue to hang out on the bullish side of their trend lines.
This is how we closed 09/05/2025:
Domestic TTI: +6.38% above its M/A (prior close +6.34%)—Buy signal effective 5/20/25.
International TTI: +9.52% above its M/A (prior close +9.65%)—Buy signal effective 5/8/25.
All linked charts above are courtesy of Bloomberg via ZeroHedge.
———————————————————-
WOULD YOU LIKE TO HAVE YOUR INVESTMENTS PROFESSIONALLY MANAGED?
Do you have the time to follow our investment plans yourself? If you are a busy professional who would like to have his portfolio managed using our methodology, please contact me directly to get more details.
Contact Ulli