
- Moving the market
U.S. stocks barely budged today, with the major indexes hovering near record territory as traders gear up for an eventful week of inflation reports.
After the Nasdaq hit new highs and the S&P 500 flirted with another milestone last week, investors are in a holding pattern—breathing a little easier thanks to the bounce-back from the previous week’s jobs-related selloff.
A growing chorus believes the Fed might pivot to more aggressive rate cuts as the year goes on, fueling some optimism.
But beneath the surface, there’s plenty of handwringing about stretched valuations, a weakening economic outlook, lingering tariff drama, and the usual August market doldrums. Honestly, a touch of sideways action here wouldn’t be the worst thing.
All eyes are locked on the upcoming CPI and PPI numbers, since hotter-than-expected inflation could really shake up the Fed’s plans—and the CPI report will be the one to watch for big policy clues.
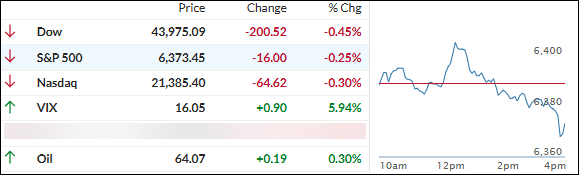
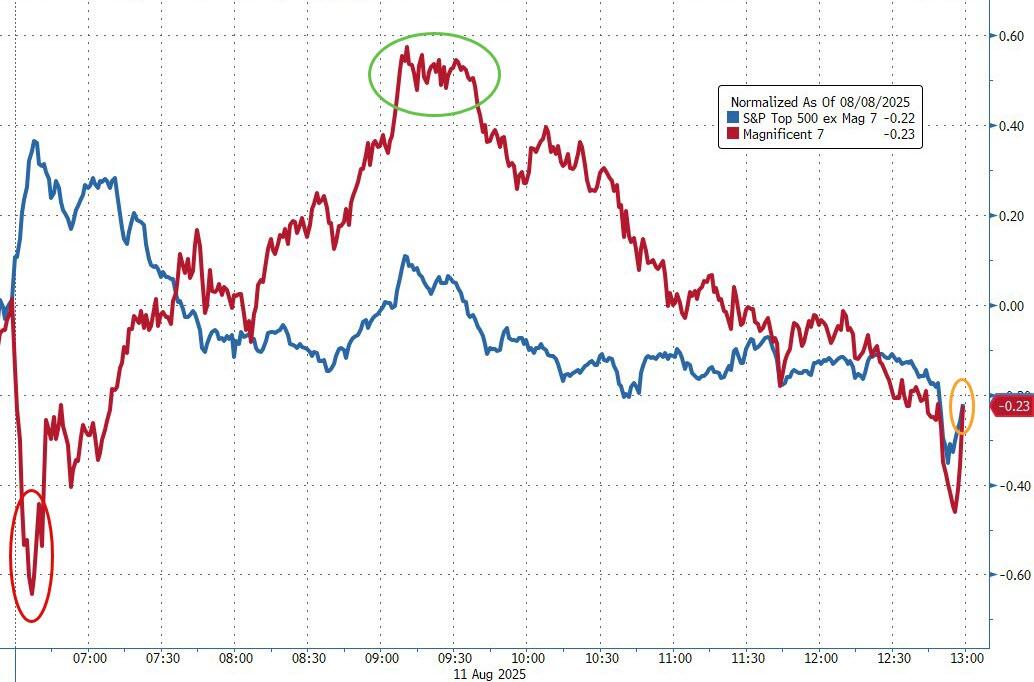
For now, the market finished up a tame, directionless session with a modest dip into the red, while the Mag7 stocks swung harder than most.
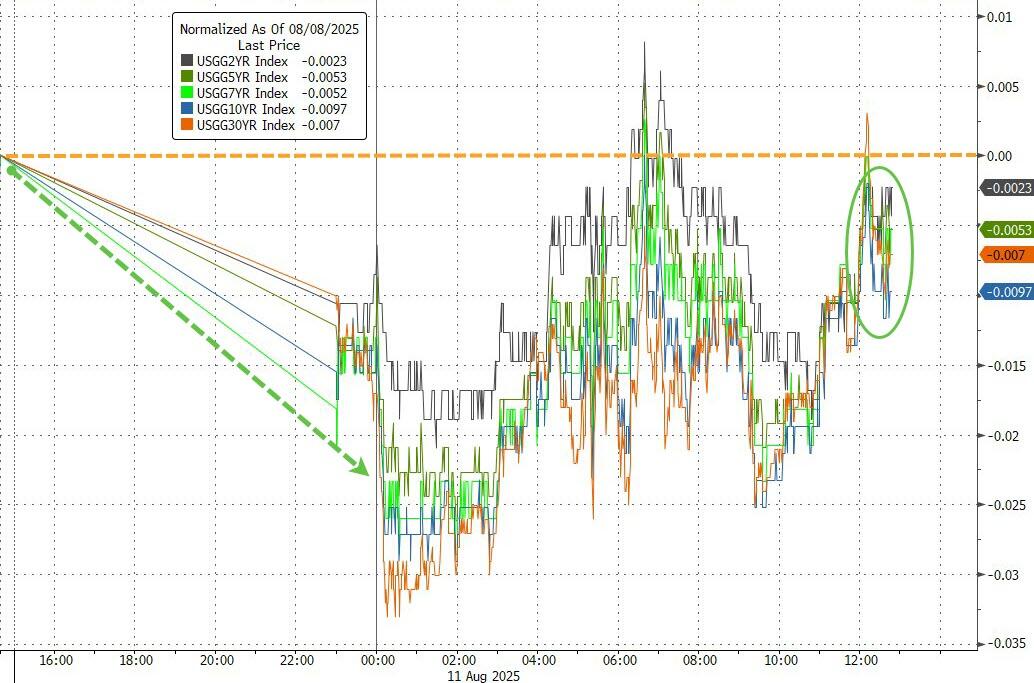
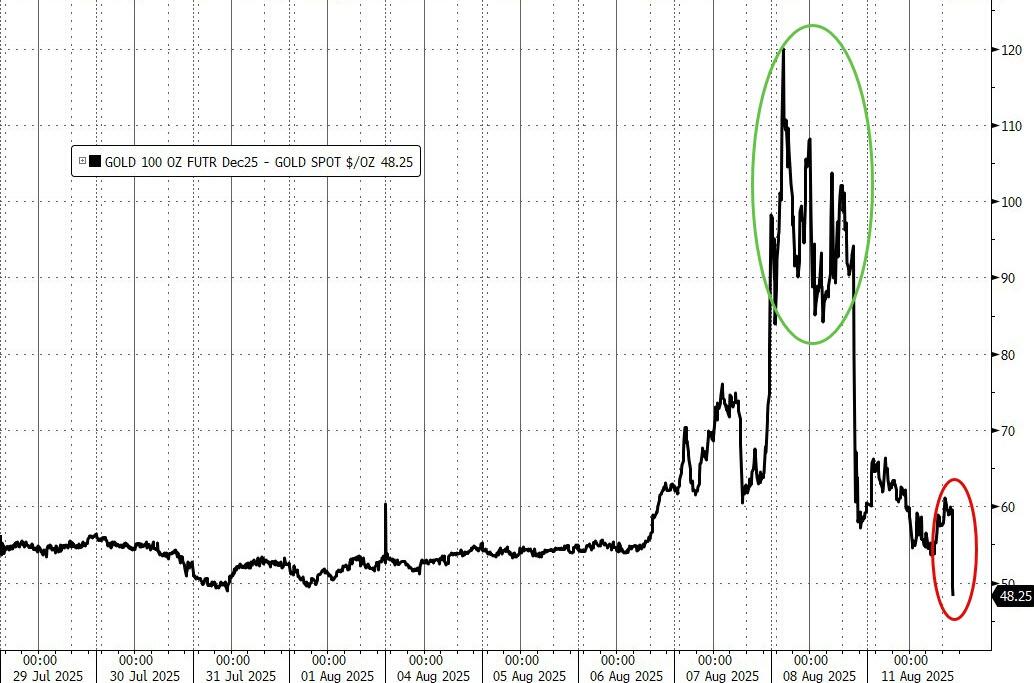
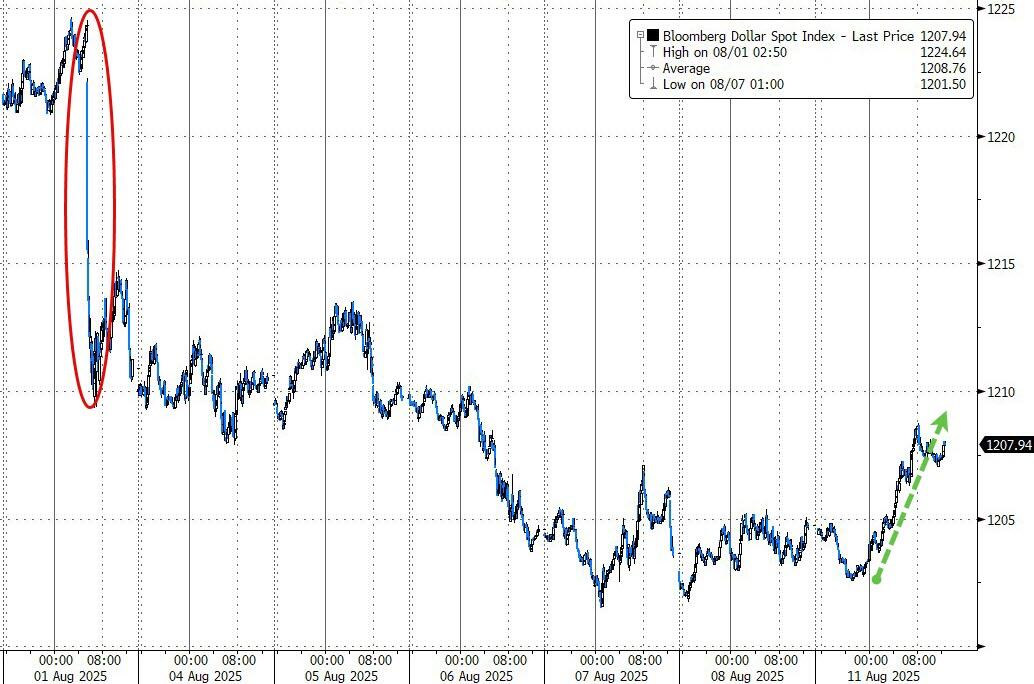
Bond yields barely moved, spot gold slipped after Trump clarified there’ll be no tariffs on the metal, and the dollar perked up but remains mired in a bear stretch.
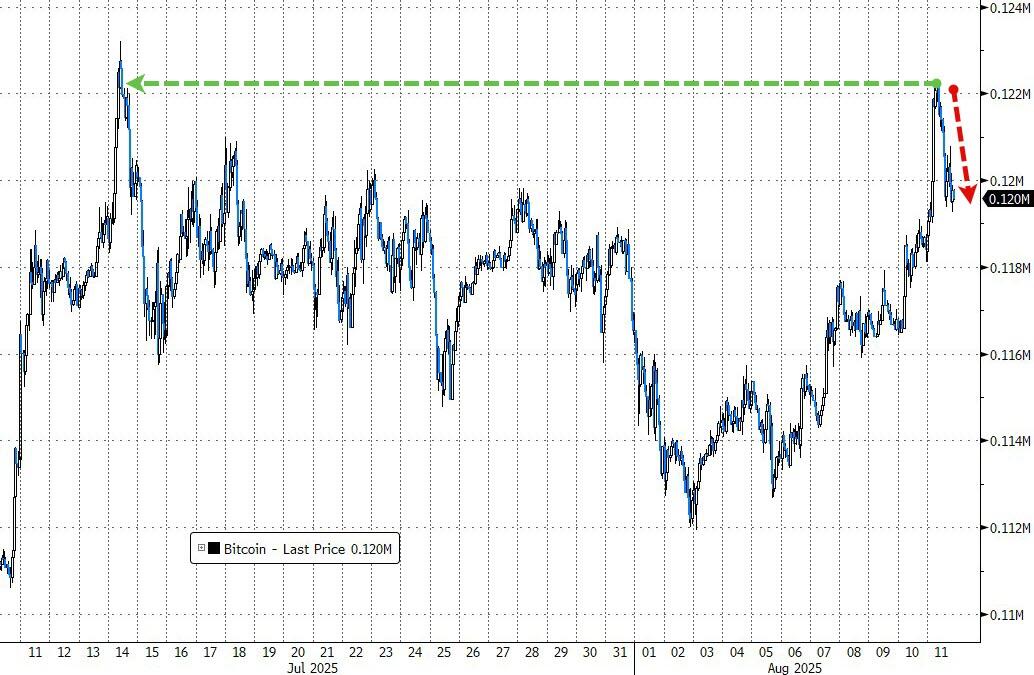
Bitcoin had a brief spurt above $122,000 overnight before settling back toward $120,000 as the session wrapped up.
With everyone playing the waiting game ahead of these key inflation numbers—the question is are we on the verge of a breakout, or should we buckle up for more choppy trading ahead?
2. Current domestic “Buy” Cycle (effective 5/20/2025); International “Buy” Cycle (effective 5/8/25)
Our domestic bullish cycle that began on November 21, 2023, concluded on April 3, 2025, following a market downturn triggered by President Trump’s tariff policy announcement.
This development caused significant declines across major indexes and broader market indices. However, markets subsequently rebounded, culminating in a new domestic “Buy” signal taking effect May 20, 2025.
Concurrently, our International Trend Tracking Index (TTI) experienced parallel volatility. On April 4, 2025, it breached critical thresholds, prompting a “Sell” recommendation. This position reversed as global markets recovered, with the International TTI regaining sufficient momentum to issue a new “Buy” signal effective May 8, 2025.
3. Trend Tracking Indexes (TTIs)
It was one of those drifting days on Wall Street, where a lack of clear direction kept traders on edge.
With no obvious catalyst, the market took the path of least resistance—down. Not exactly a shocker, given that we’ve got some potentially market-moving economic reports coming up later this week.
Our TTIs echoed the market’s indecision, moving slightly but not enough to change the bigger picture.
This is how we closed 08/11/2025:
Domestic TTI: +3.40% above its M/A (prior close +3.69%)—Buy signal effective 5/20/25.
International TTI: +8.47% above its M/A (prior close +8.05%)—Buy signal effective 5/8/25.
All linked charts above are courtesy of Bloomberg via ZeroHedge.
———————————————————-
WOULD YOU LIKE TO HAVE YOUR INVESTMENTS PROFESSIONALLY MANAGED?
Do you have the time to follow our investment plans yourself? If you are a busy professional who would like to have his portfolio managed using our methodology, please contact me directly to get more details.
Contact Ulli