
ETF Tracker StatSheet
You can view the latest version here.
MARKETS CLIMB THE WALL OF WORRY—BUT FOR HOW LONG?
- Moving the market
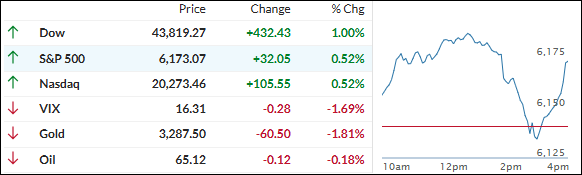
The markets kicked off the day riding yesterday’s momentum, with the S&P 500 reclaiming its February record.
Optimism was fueled by hopes of progress on trade deals—especially after Commerce Secretary Lutnick confirmed a finalized trade framework with China, which Beijing backed up. The administration also hinted that agreements with 10 other major partners are just around the corner.
Adding fuel to the rally were gains in AI heavyweights like Microsoft and Nvidia. Microsoft even hit a new all-time high before settling near flat. Despite a backdrop of shaky economic data, rising debt, and ongoing global tensions, investors seem to be climbing the proverbial “wall of worry.”
But the ride wasn’t all smooth. Around midday, markets took a sharp dive after Trump abruptly ended trade talks with Canada over their new Digital Services Tax targeting U.S. tech firms.
That rattled sentiment—briefly. Dip buyers swooped in during the final hour, lifting the indexes back into the green. By the close, all major indexes were up for the week, with the Nasdaq leading the charge.
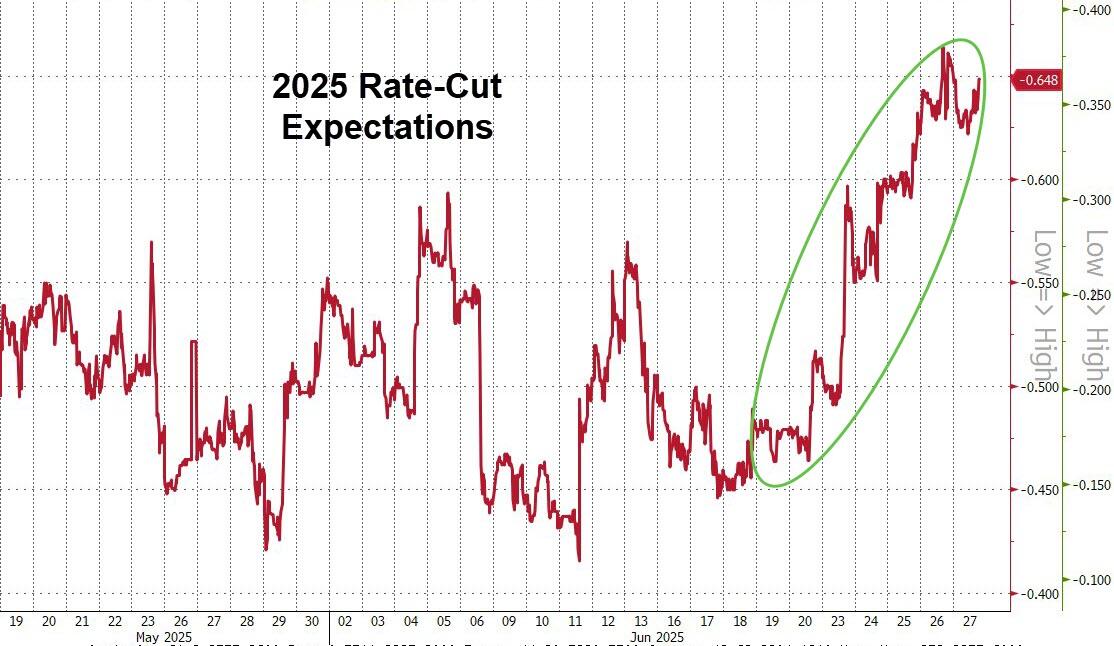
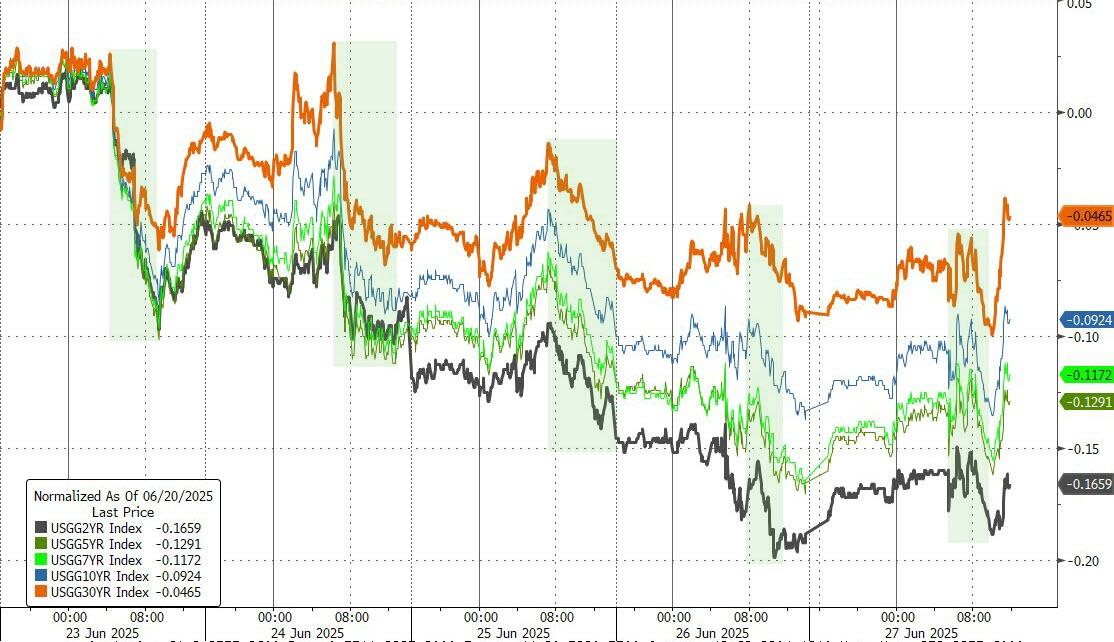
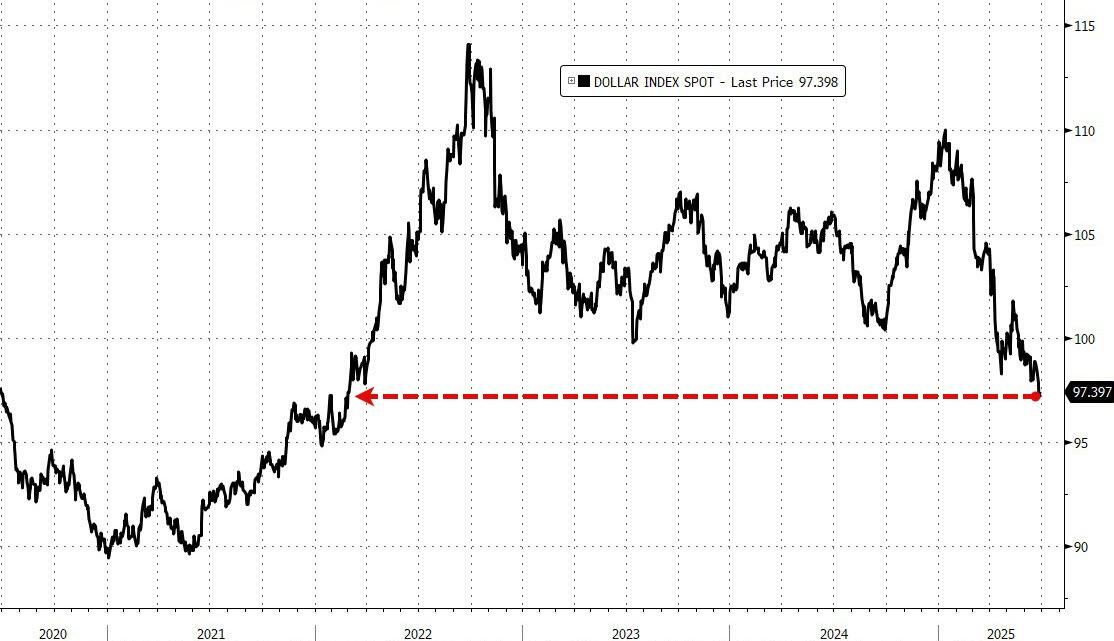
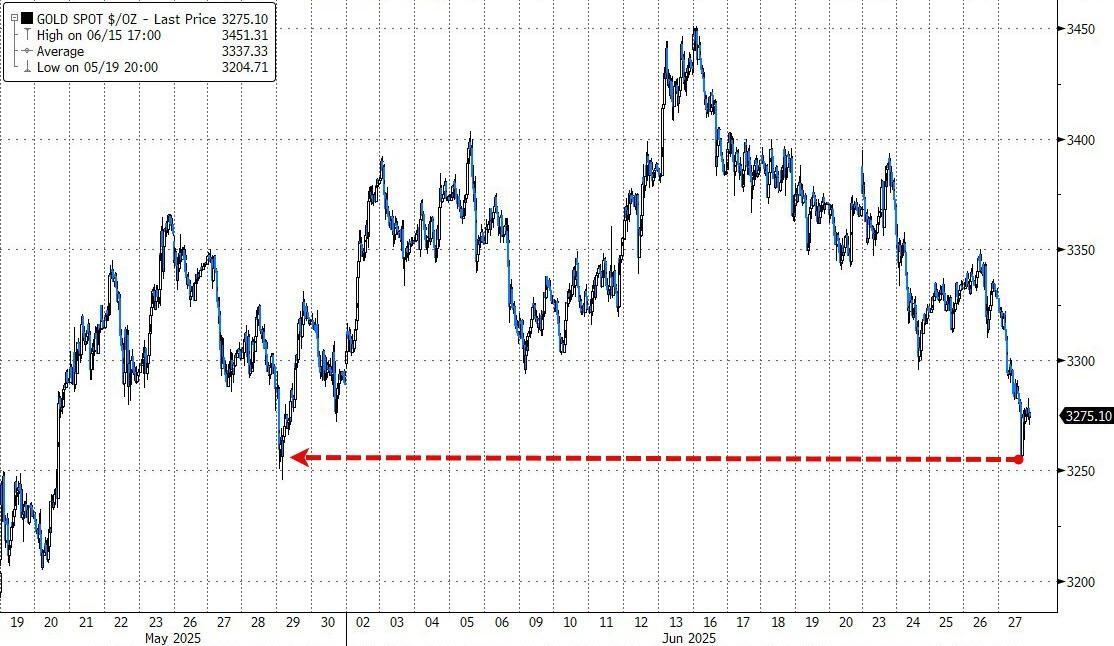
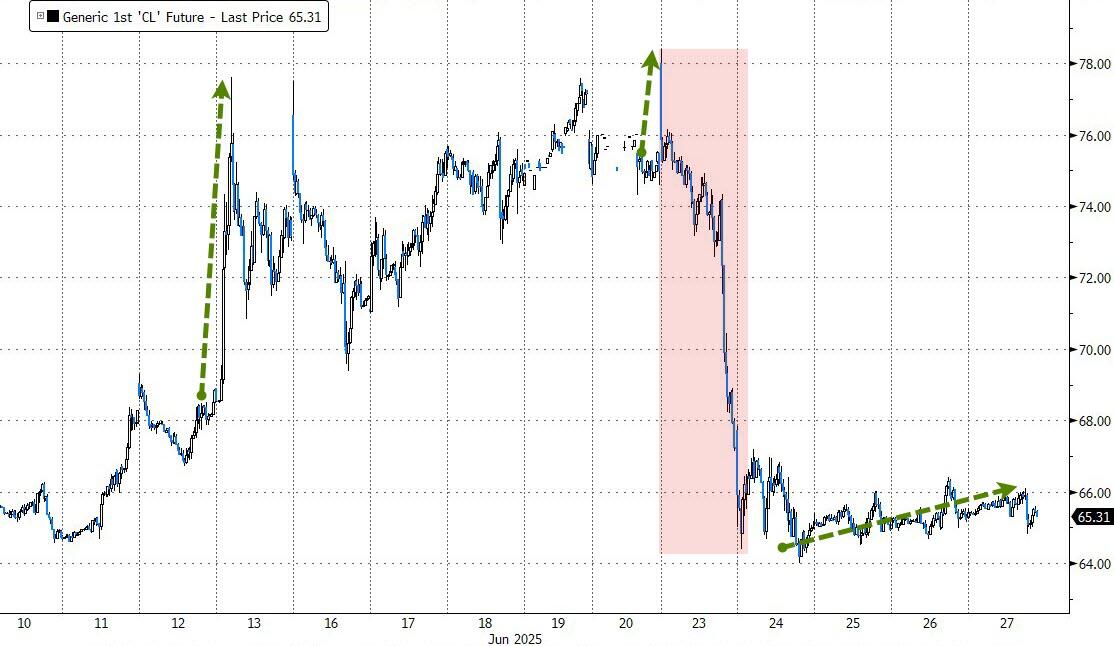
Interestingly, weak macro data (housing, income, spending, and inflation) actually helped, as it boosted hopes for rate cuts in 2025. Bond yields fell, the dollar slipped, and gold dropped for the second week in a row. Crude oil also plunged following the official end of the Israel-Iran war.
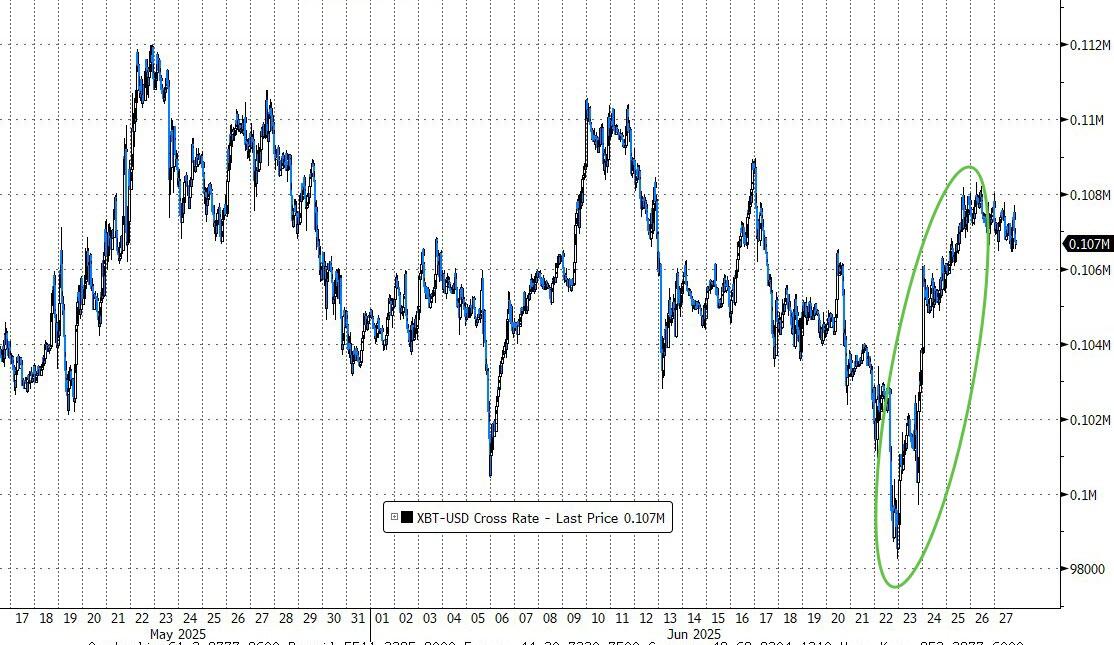
Bitcoin stayed flat today but still logged its best week in nearly two months, briefly crossing $108K.
So, with markets brushing off bad news and charging ahead—are we seeing real strength, or just a calm before the next storm?
2. Current domestic “Buy” Cycle (effective 5/20/2025); International “Buy” Cycle (effective 5/8/25)
Our domestic bullish cycle that began on November 21, 2023, concluded on April 3, 2025, following a market downturn triggered by President Trump’s tariff policy announcement.
This development caused significant declines across major indexes and broader market indices. However, markets subsequently rebounded, culminating in a new domestic “Buy” signal taking effect May 20, 2025.
Concurrently, our International Trend Tracking Index (TTI) experienced parallel volatility. On April 4, 2025, it breached critical thresholds, prompting a “Sell” recommendation. This position reversed as global markets recovered, with the International TTI regaining sufficient momentum to issue a new “Buy” signal effective May 8, 2025.
3. Trend Tracking Indexes (TTIs)
The markets were cruising along nicely until midday when things took a sharp turn.
A sudden trade spat with Canada—and Trump pulling the plug on all talks—put the brakes on the rally and sent stocks sliding.
But after a quick dip, cooler heads stepped in, and the rebound was strong enough to push the indexes back into the green by the close.
Our TTIs rode the ups and downs too, but ultimately ended the day on a high note.
This is how we closed 06/27/2025:
Domestic TTI: +3.05% above its M/A (prior close +2.32%)—Buy signal effective 5/20/25.
International TTI: +8.30% above its M/A (prior close +7.61%)—Buy signal effective 5/8/25.
All linked charts above are courtesy of Bloomberg via ZeroHedge.
———————————————————-
WOULD YOU LIKE TO HAVE YOUR INVESTMENTS PROFESSIONALLY MANAGED?
Do you have the time to follow our investment plans yourself? If you are a busy professional who would like to have his portfolio managed using our methodology, please contact me directly to get more details.
Contact Ulli