
OIL CLIMBS, TECH TUMBLES, AND TENSIONS RISE—NOW WHAT?
- Moving the market
The markets tried to rally early on, but that bounce didn’t last long. Despite Fed Governor Waller striking an optimistic tone—saying inflation looks tame enough for a possible rate cut at the next meeting—stocks slipped into the red. That’s a much rosier outlook than what Fed Chair Powell offered just last week.
But it wasn’t just the Fed on traders’ minds. The ongoing conflict between Israel and Iran continues to cast a shadow over the markets, with no signs of easing. Trump added to the uncertainty, saying he’ll decide in the next two weeks whether to strike Iran, leaving room for potential negotiations.
With tensions running high, traders seem unsure how to react. And when uncertainty rules, markets tend to drift lower—or just stall out—until something gives.
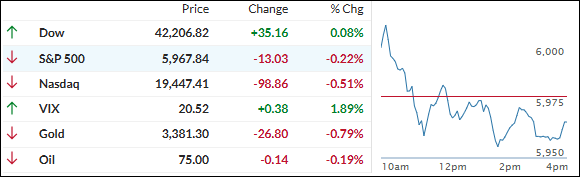
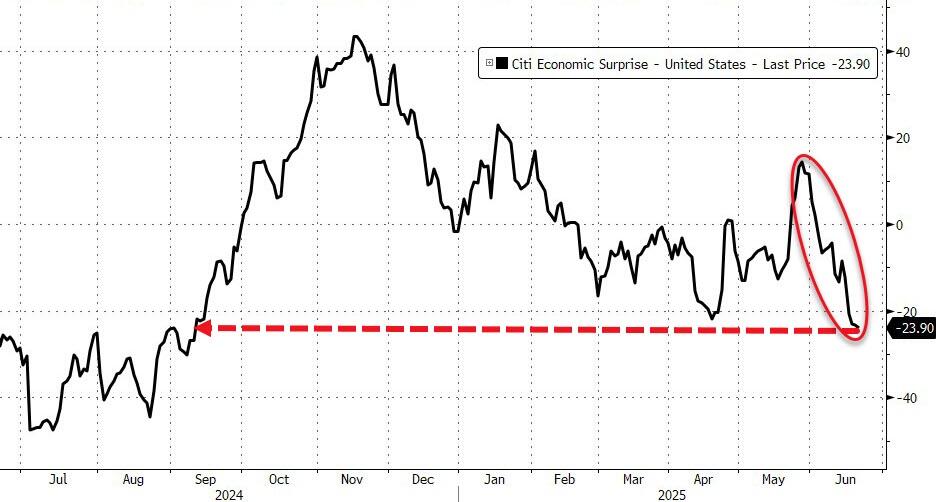
By the end of the week, the major indexes barely budged. Investors were left juggling geopolitical risks, rising oil prices, and mixed economic signals. The Citi Economic Surprise Index even dropped to levels we haven’t seen since last September.
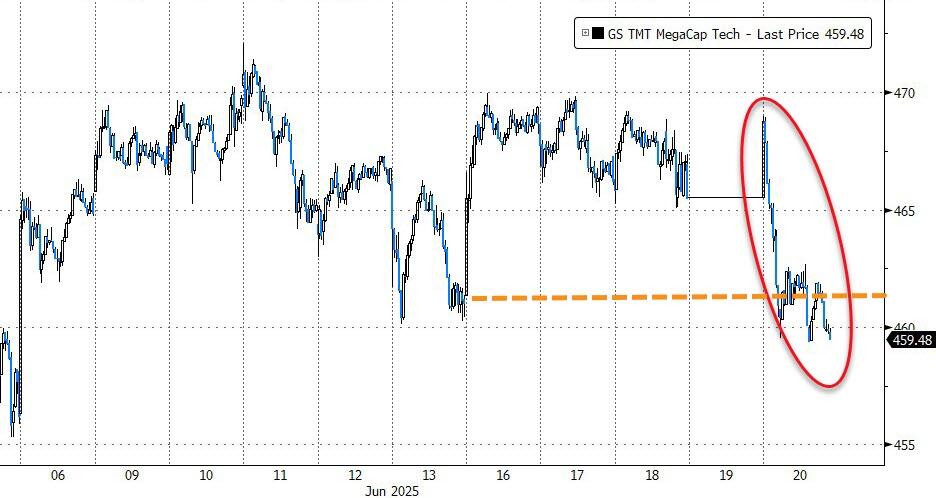
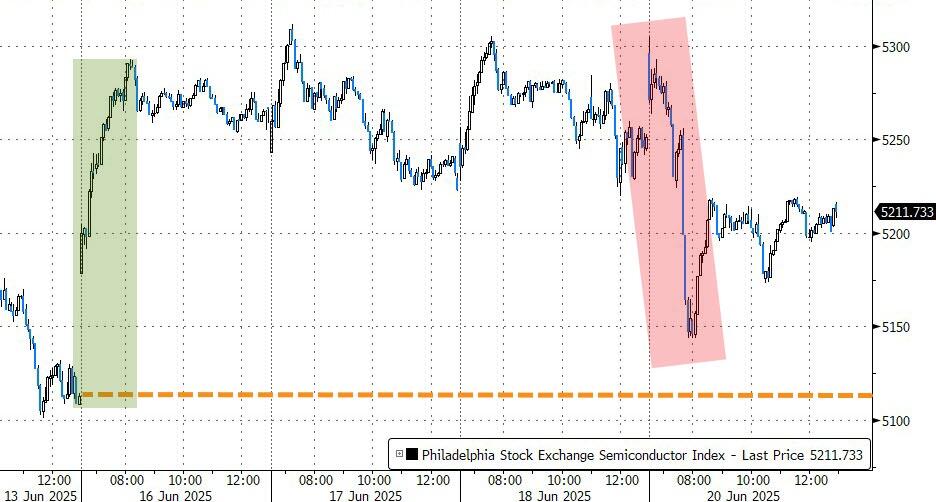
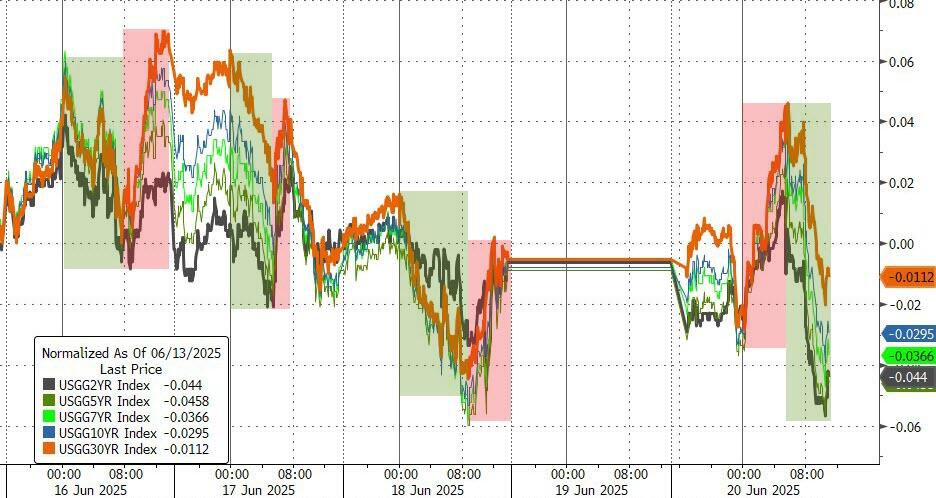
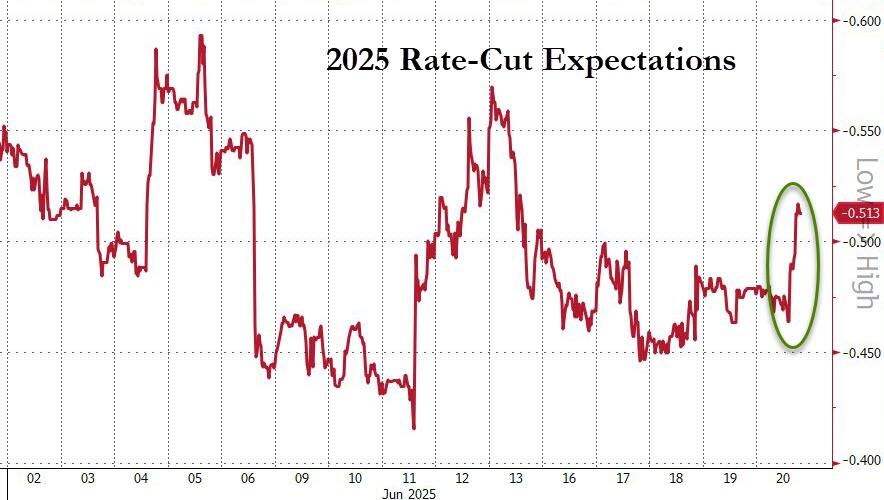
Big tech didn’t fare well either. Mega-cap names and semiconductors both took a hit. Bond yields bounced around but ended lower, while expectations for rate cuts ticked up slightly.
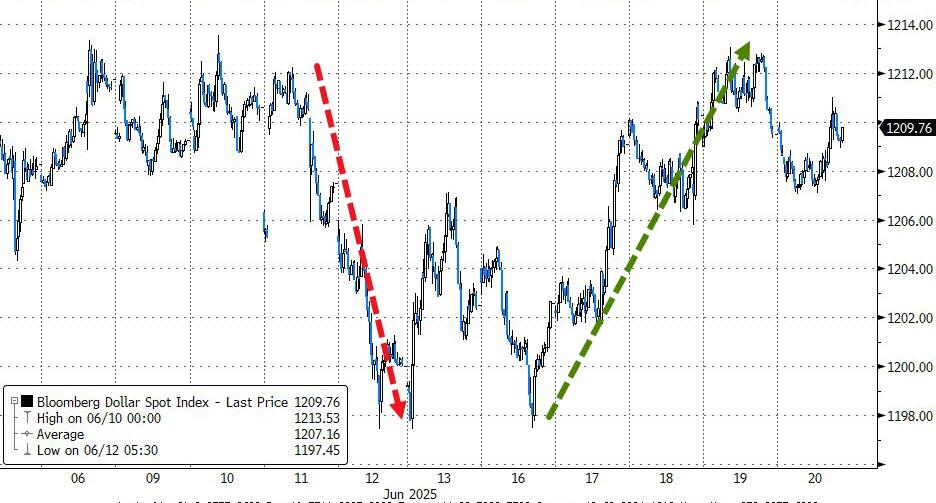
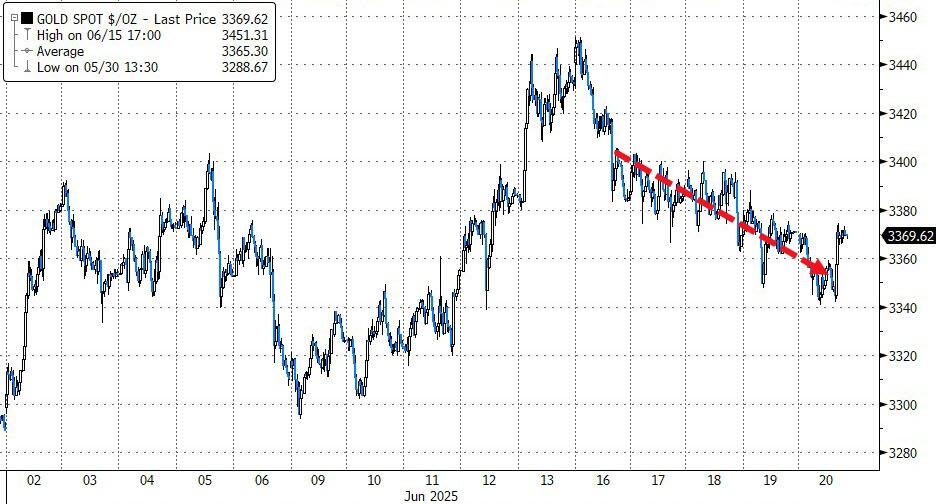
The dollar had a solid week, clawing back recent losses—but that came at gold’s expense, which slipped from last week’s highs.
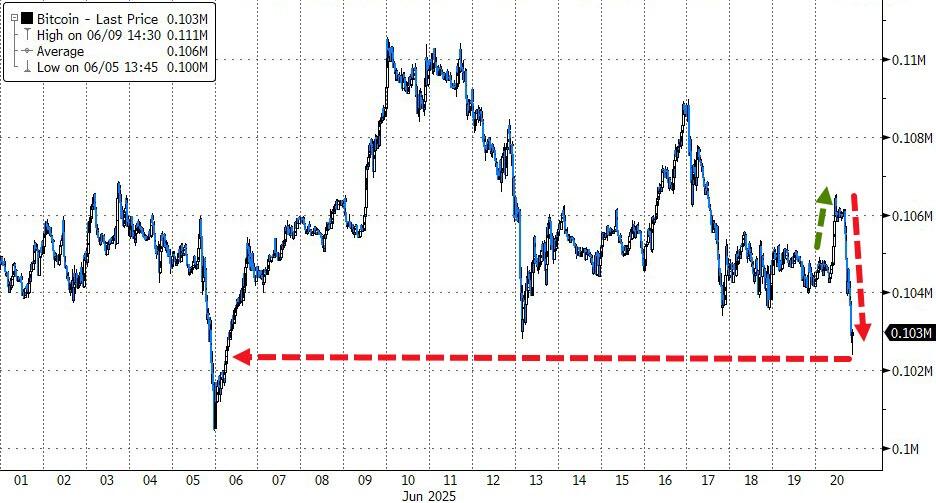
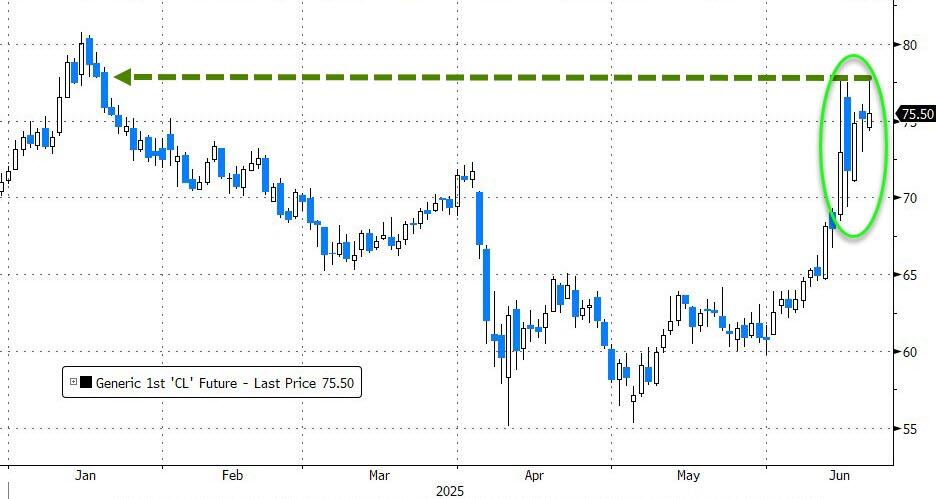
Bitcoin also struggled but found support around $102K. Meanwhile, crude oil climbed for the third straight week and is now eyeing its year-to-date highs from January.
So, here’s the big question:
Is this week’s market stumble just a blip—or the start of something bigger?
2. Current domestic “Buy” Cycle (effective 5/20/2025); International “Buy” Cycle (effective 5/8/25)
Our domestic bullish cycle that began on November 21, 2023, concluded on April 3, 2025, following a market downturn triggered by President Trump’s tariff policy announcement.
This development caused significant declines across major indexes and broader market indices. However, markets subsequently rebounded, culminating in a new domestic “Buy” signal taking effect May 20, 2025.
Concurrently, our International Trend Tracking Index (TTI) experienced parallel volatility. On April 4, 2025, it breached critical thresholds, prompting a “Sell” recommendation. This position reversed as global markets recovered, with the International TTI regaining sufficient momentum to issue a new “Buy” signal effective May 8, 2025.
3. Trend Tracking Indexes (TTIs)
Today’s market felt like a reflection of the whole week—uncertain and a bit hesitant. With ongoing geopolitical tensions keeping traders on edge, there wasn’t much conviction in either direction.
The major indexes ended the week pretty much flat, with no real gains or losses to speak of.
As for our TTIs, it was a mixed bag. The domestic TTI showed a slight uptick, hinting at a bit of strength, while the international TTI slipped just a little.
This is how we closed 06/20/2025:
Domestic TTI: +0.85% above its M/A (prior close +0.73%)—Buy signal effective 5/20/25.
International TTI: +5.33% above its M/A (prior close +5.95%)—Buy signal effective 5/8/25.
All linked charts above are courtesy of Bloomberg via ZeroHedge.
———————————————————-
WOULD YOU LIKE TO HAVE YOUR INVESTMENTS PROFESSIONALLY MANAGED?
Do you have the time to follow our investment plans yourself? If you are a busy professional who would like to have his portfolio managed using our methodology, please contact me directly to get more details.
Contact Ulli