
- Moving the market
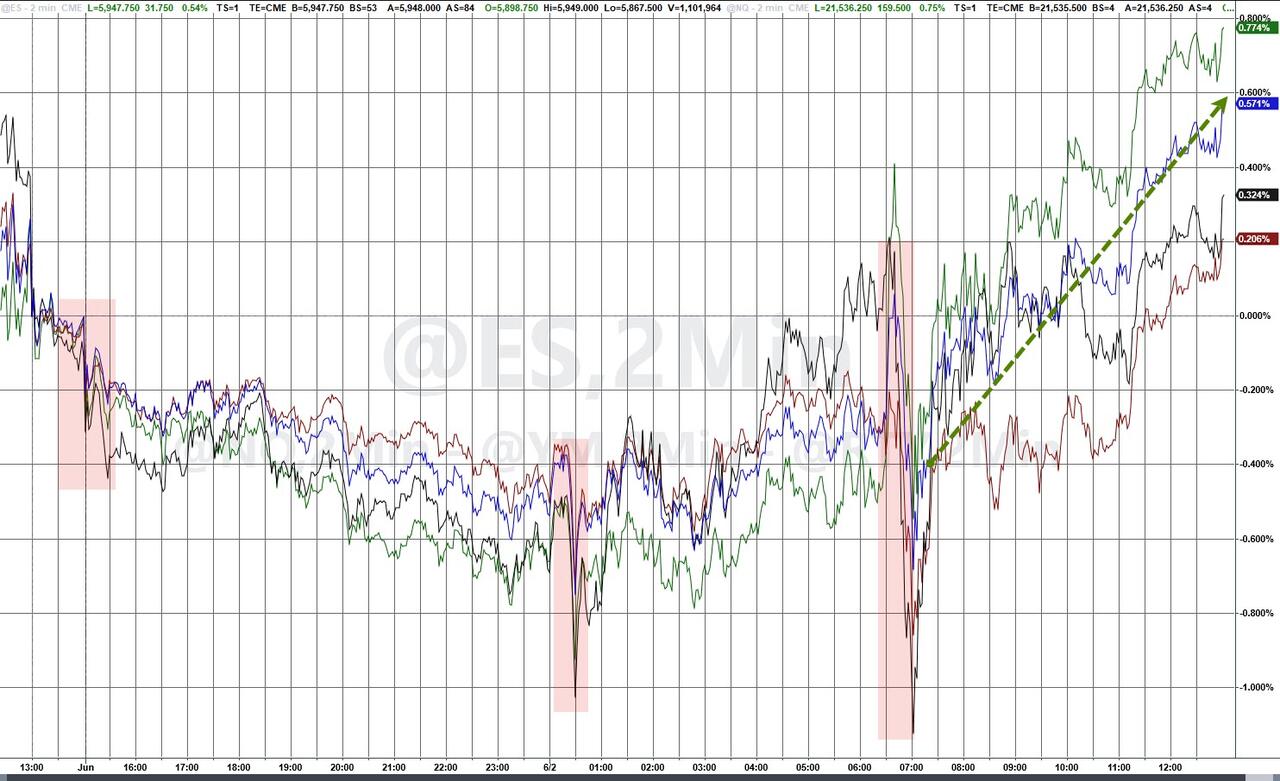
Global trade tensions had markets on edge early in the day, with major indexes slipping into the red right out of the gate.
The pressure came after China pushed back on U.S. claims that it had violated a temporary trade deal—blaming Washington for not holding up its end. The back-and-forth between the two powers made it clear that negotiations are heading in the wrong direction.
Meanwhile, tensions flared between the U.S. and the European Union after Trump announced a plan to double steel tariffs to 50%. The EU warned that this move could inject more uncertainty into the global economy and drive up consumer costs on both sides of the Atlantic.
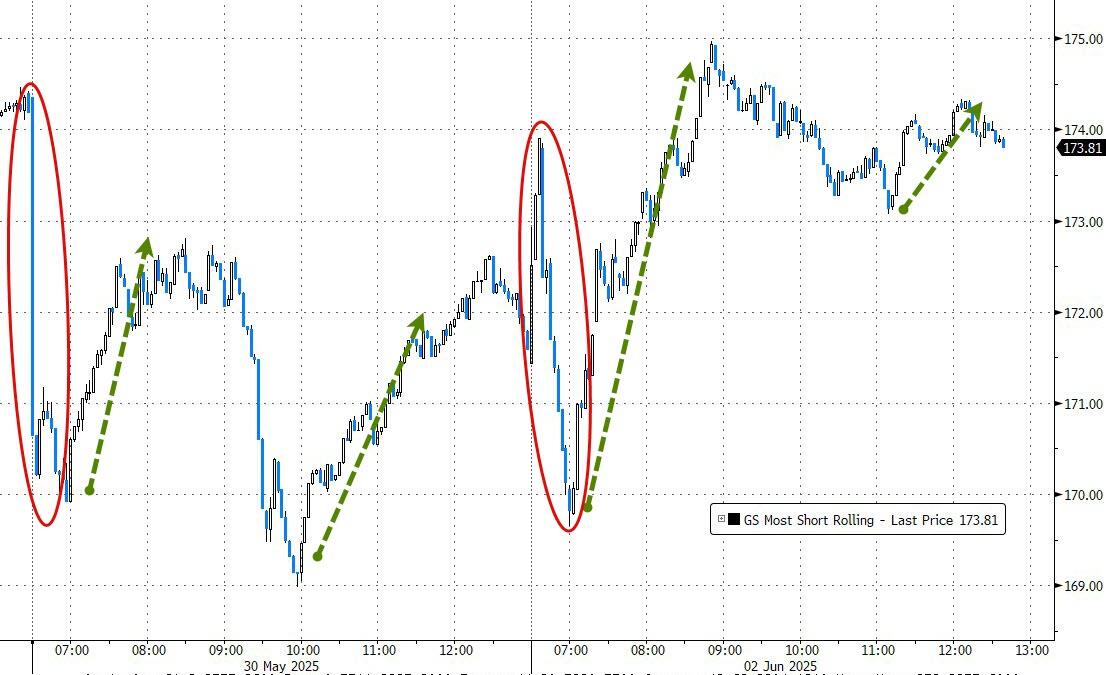
Despite the rocky start, markets found their footing. A short squeeze kicked in early and helped lift the major indexes into the green by the close.
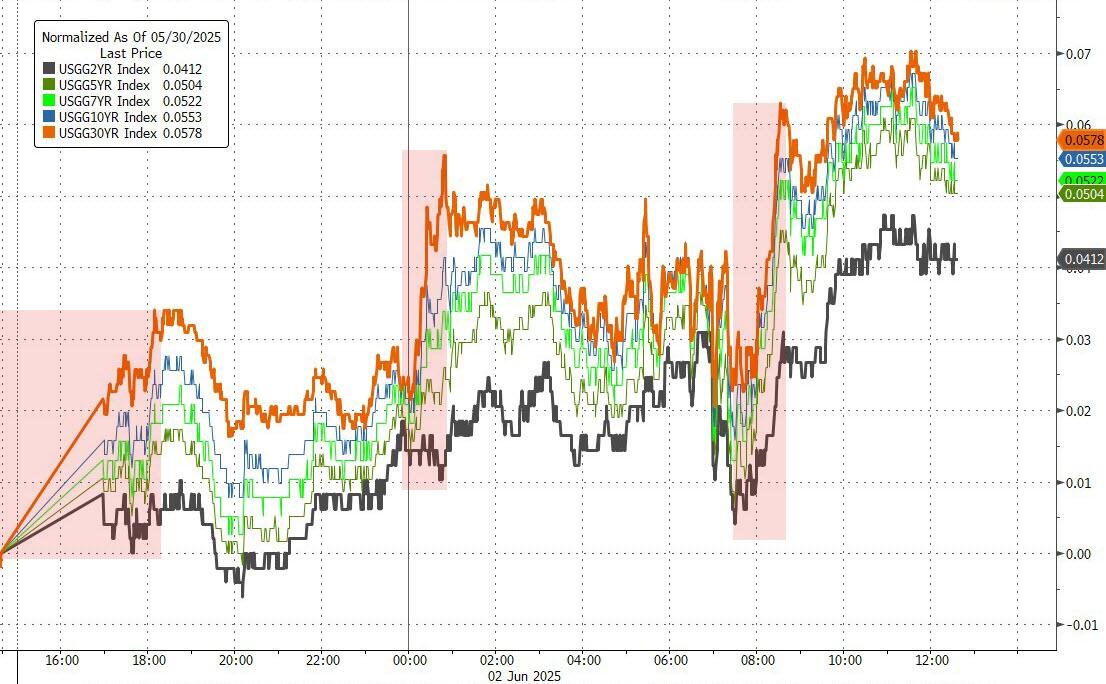
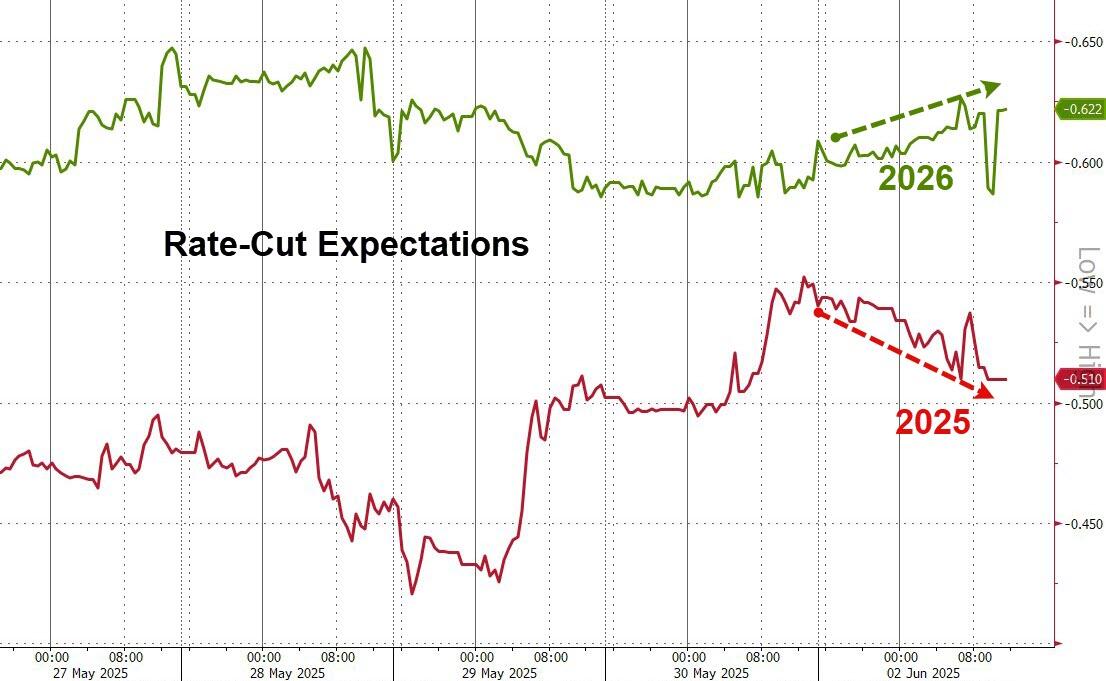
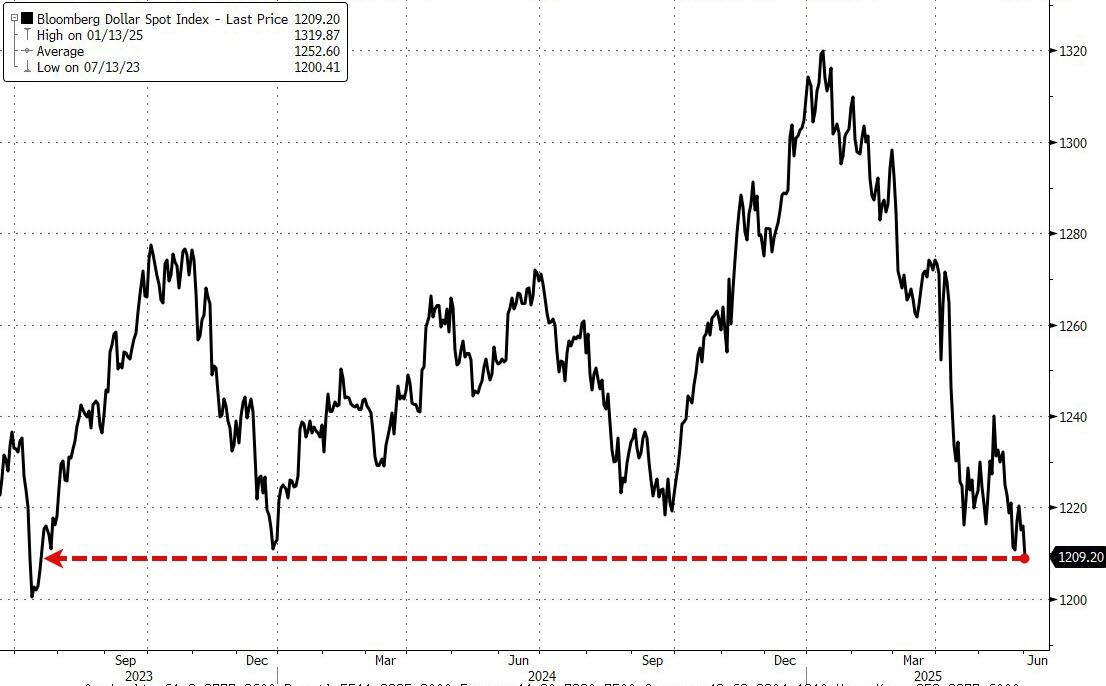
In the bond market, yields climbed as hopes for a 2025 rate cut faded. The dollar slipped to its lowest level since July 2023.
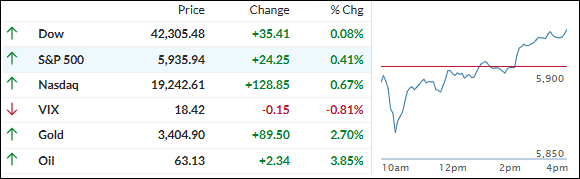
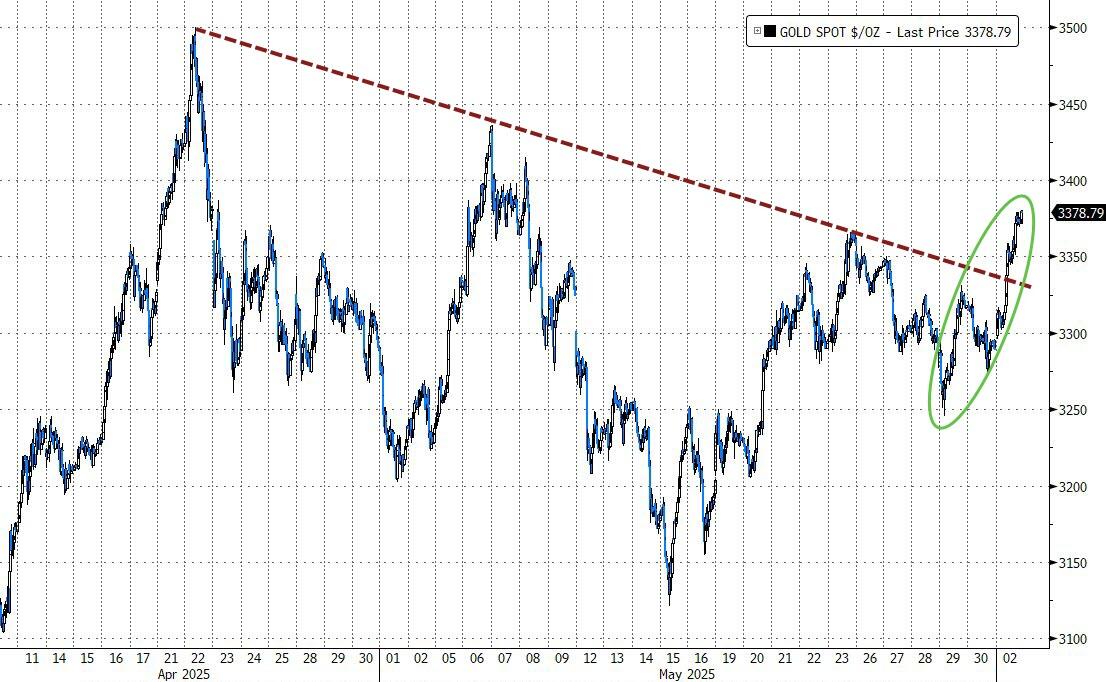
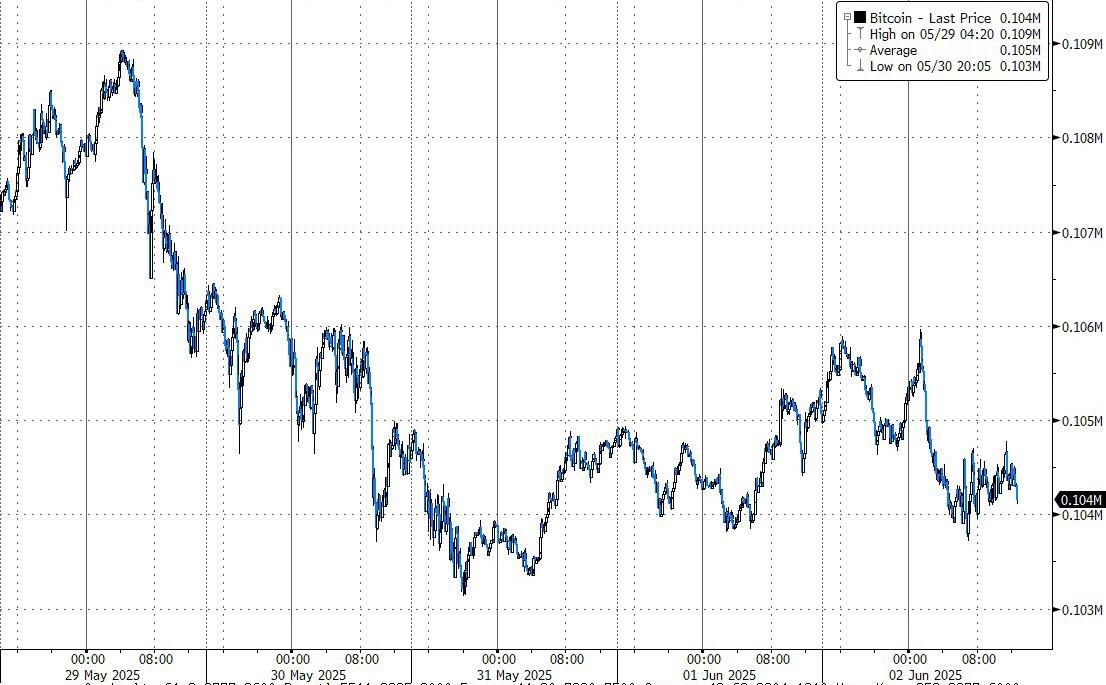
Gold had a standout day—jumping 2.73% and breaking out of its downtrend channel—while silver surged an impressive 5.3%. Bitcoin stayed rangebound but held support around the $104K mark.
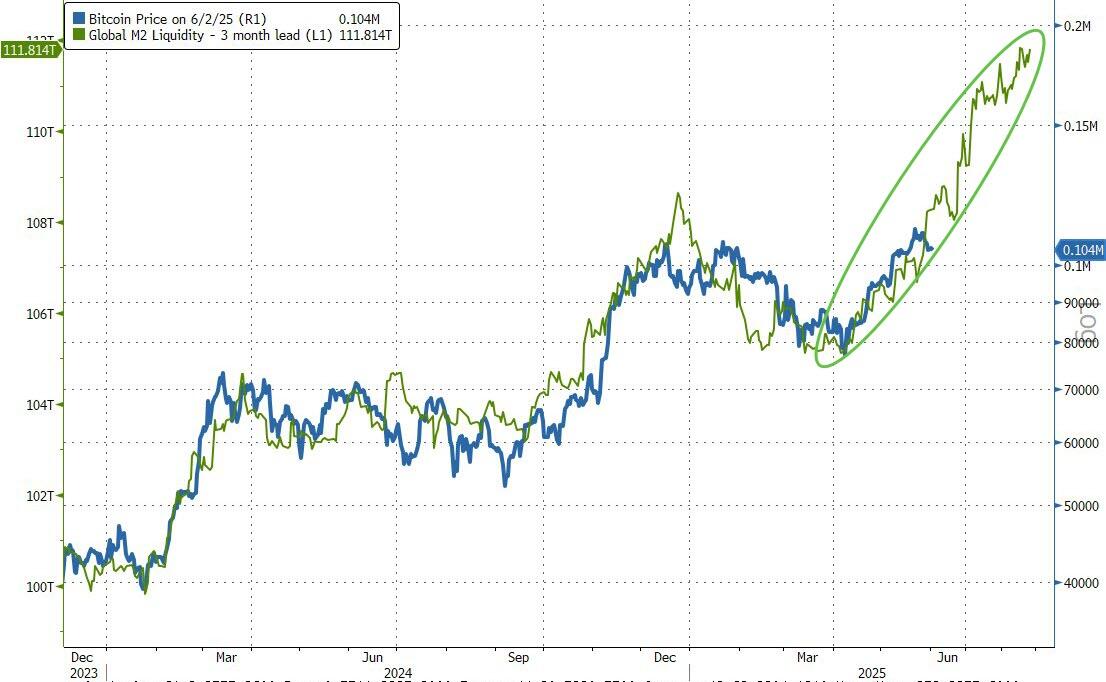
ZeroHedge shared an updated global liquidity chart (with a 3-month lag), hinting that if history repeats, bitcoin could be on a path toward $200K.
So, with all this volatility and momentum, are we looking at the start of a summer breakout—or just another head fake?
2. Current domestic “Buy” Cycle (effective 5/20/2025); International “Buy” Cycle (effective 5/8/25)
Our domestic bullish cycle that began on November 21, 2023, concluded on April 3, 2025, following a market downturn triggered by President Trump’s tariff policy announcement.
This development caused significant declines across major indexes and broader market indices. However, markets subsequently rebounded, culminating in a new domestic “Buy” signal taking effect May 20, 2025.
Concurrently, our International Trend Tracking Index (TTI) experienced parallel volatility. On April 4, 2025, it breached critical thresholds, prompting a “Sell” recommendation. This position reversed as global markets recovered, with the International TTI regaining sufficient momentum to issue a new “Buy” signal effective May 8, 2025.
3. Trend Tracking Indexes (TTIs)
It was one of those “weak start, strong finish” kind of days. The major indexes started off in the red but managed to claw their way back and ended with solid gains.
The Nasdaq led the charge, while the Dow lagged a bit.
Our TTIs moved in step with the market, though the international TTI continued to show stronger upward momentum.
This is how we closed 06/02/2025:
Domestic TTI: +0.49% above its M/A (prior close +0.41%)—Buy signal effective 5/20/25.
International TTI: +6.23% above its M/A (prior close +5.88%)—Buy signal effective 5/8/25.
All linked charts above are courtesy of Bloomberg via ZeroHedge.
———————————————————-
WOULD YOU LIKE TO HAVE YOUR INVESTMENTS PROFESSIONALLY MANAGED?
Do you have the time to follow our investment plans yourself? If you are a busy professional who would like to have his portfolio managed using our methodology, please contact me directly to get more details.
Contact Ulli