- Moving the market
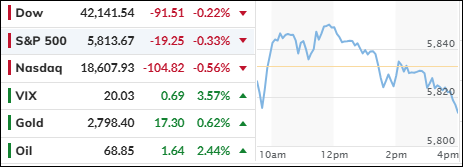
Early in the trading session, bullish sentiment dominated despite a flood of mixed earnings results, with more reports expected from major tech companies.
However, this optimism was short-lived, as the major indexes eventually succumbed to bearish pressures, relinquishing their gains, and closing in the red.
Alphabet set a positive tone by surpassing expectations, boosting its share price by approximately 6%. In contrast, chipmaker AMD disappointed investors, leading to a 10% drop in its stock. Super Micro had an even worse day, with its stock plummeting by 32%, while Caterpillar also underperformed, losing 4% of its value.
As the market closed, anticipation grew for the earnings reports from tech giants Meta and Microsoft, with Apple and Amazon scheduled to release their results the following afternoon.
On the economic front, the latest third-quarter GDP figure showed a 2.8% annualized increase, falling short of economists’ expectations of a 3.1% rise.
However, the ADP payroll report provided a silver lining, revealing the highest level of private job creation in a year. Additionally, pending home sales surged by 7.4% month-over-month, marking the largest jump since June 2020.
Despite the mixed market environment, gold remained resilient, briefly touching the $2,800 level before retreating. Bond yields experienced another turbulent session, with some traders viewing the Fed’s 0.5% rate cut as a potential policy misstep.
The dollar had a volatile day, ultimately closing lower, while Bitcoin, despite coming off its highs, found solid support around $72,000. Oil prices rebounded but continued to drift below recent highs.
It was a volatile session, and I expect to see more of that as we approach election time.
2. Current “Buy” Cycles (effective 11/21/2023)
Our Trend Tracking Indexes (TTIs) have both crossed their trend lines with enough strength to trigger new “Buy” signals. That means, Tuesday, 11/21/2023, was the official date for these signals.
If you want to follow our strategy, you should first decide how much you want to invest based on your risk tolerance (percentage of allocation). Then, you should check my Thursday StatSheet and Saturday’s “ETFs on the Cutline” report for suitable ETFs to buy.
3. Trend Tracking Indexes (TTIs)
In the early hours of trading, the market saw a surge, as bullish traders and algos drove the major indexes upward. However, this optimistic trend was short-lived.
As the day progressed, bearish forces took over, reversing the initial gains and ultimately leading to all three major indexes closing in negative territory.
Similarly, our TTIs mirrored this pattern. The international TTI exhibited more pronounced weakness compared to its domestic counterpart, reflecting a broader global market downturn.
This is how we closed 10/30/2024:
Domestic TTI: +6.74% above its M/A (prior close +6.97%)—Buy signal effective 11/21/2023.
International TTI: +4.51% above its M/A (prior close +5.11%)—Buy signal effective 11/21/2023.
All linked charts above are courtesy of Bloomberg via ZeroHedge.
———————————————————-
WOULD YOU LIKE TO HAVE YOUR INVESTMENTS PROFESSIONALLY MANAGED?
Do you have the time to follow our investment plans yourself? If you are a busy professional who would like to have his portfolio managed using our methodology, please contact me directly to get more details.
Contact Ulli