
- Moving the market
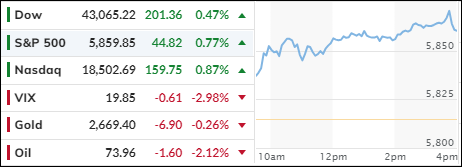
Following Friday’s significant gains, the S&P 500 opened with a surge and reached another record high, driven by anticipation of positive earnings reports, despite the bond market being closed for Columbus Day.
Rumors from China about a new stimulus plan (quantitative easing) laid the groundwork for today’s market action, propelling both equities and cryptocurrencies significantly higher.
Major banking institutions like Bank of America and Goldman Sachs are set to report on Tuesday, following the positive earnings reports from JP Morgan and Wells Fargo.
These initial reports indicated a recovery in banking profits, with the 30 S&P 500 companies that have reported so far exceeding consensus estimates by an average of 5%, compared to a 3% beat in the previous quarter, fueling the current market enthusiasm.
However, several potential risks loom on the horizon, including the upcoming election, rapidly rising bond yields, geopolitical tensions in the Middle East, and uncertainties about the Federal Reserve’s future easing policies.
The MAG7 basket of stocks continues to push towards June’s all-time highs, with Nvidia achieving a new record and closing in on Apple’s market cap lead.
The most shorted stocks experienced a squeeze higher, while bond futures suggest lower prices and higher yields.
Bitcoin soared past $66,000, reaching its highest level since September, as the dollar climbed to a two-month high. Despite the dollar’s strength, gold remained stable within its recent trading range.
Although the VIX (volatility index) pulled back slightly, we are in a seasonal period where market conditions can change rapidly. Bloomberg noted that traders are hedging their positions more aggressively than in the first half of the year.
2. Current “Buy” Cycles (effective 11/21/2023)
Our Trend Tracking Indexes (TTIs) have both crossed their trend lines with enough strength to trigger new “Buy” signals. That means, Tuesday, 11/21/2023, was the official date for these signals.
If you want to follow our strategy, you should first decide how much you want to invest based on your risk tolerance (percentage of allocation). Then, you should check my Thursday StatSheet and Saturday’s “ETFs on the Cutline” report for suitable ETFs to buy.
3. Trend Tracking Indexes (TTIs)
Even though the bond market was closed, traders and algorithms continued to push the stock indexes higher. Contributing to this upward momentum was the announcement from China about a new stimulus plan aimed at reviving their struggling economy.
This news maintained a positive, bullish sentiment throughout the trading session. Consequently, our TTIs also saw a nice increase.
This is how we closed 10/14/2024:
Domestic TTI: +9.40% above its M/A (prior close +8.60%)—Buy signal effective 11/21/2023.
International TTI: +7.64% above its M/A (prior close +7.26%)—Buy signal effective 11/21/2023.
All linked charts above are courtesy of Bloomberg via ZeroHedge.
———————————————————-
WOULD YOU LIKE TO HAVE YOUR INVESTMENTS PROFESSIONALLY MANAGED?
Do you have the time to follow our investment plans yourself? If you are a busy professional who would like to have his portfolio managed using our methodology, please contact me directly to get more details.
Contact Ulli