
- Moving the market
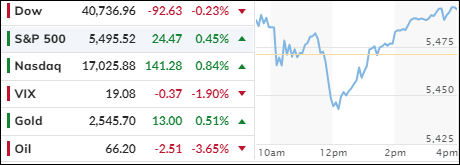
The markets suffered a tumultuous day, initially edging higher before collapsing precipitously, only to regain their footing and ending with another winning session. Among the three major indexes, only the S&P 500 and Nasdaq managed to close in the green after this roller coaster ride.
The tech sector has been struggling, with the XLK ETF losing about 7.5% this quarter. However, yesterday’s rebound helped to mitigate some of these losses. Traders are betting on the Federal Reserve to cut interest rates at their upcoming meeting, hoping this will aid the ailing economy. Spoiler alert: It likely won’t.
Tomorrow’s Consumer Price Index (CPI) and Thursday’s Producer Price Index (PPI) could ignite the markets, unless the numbers come in higher than expected, in which case other asset classes like gold and commodities might benefit.
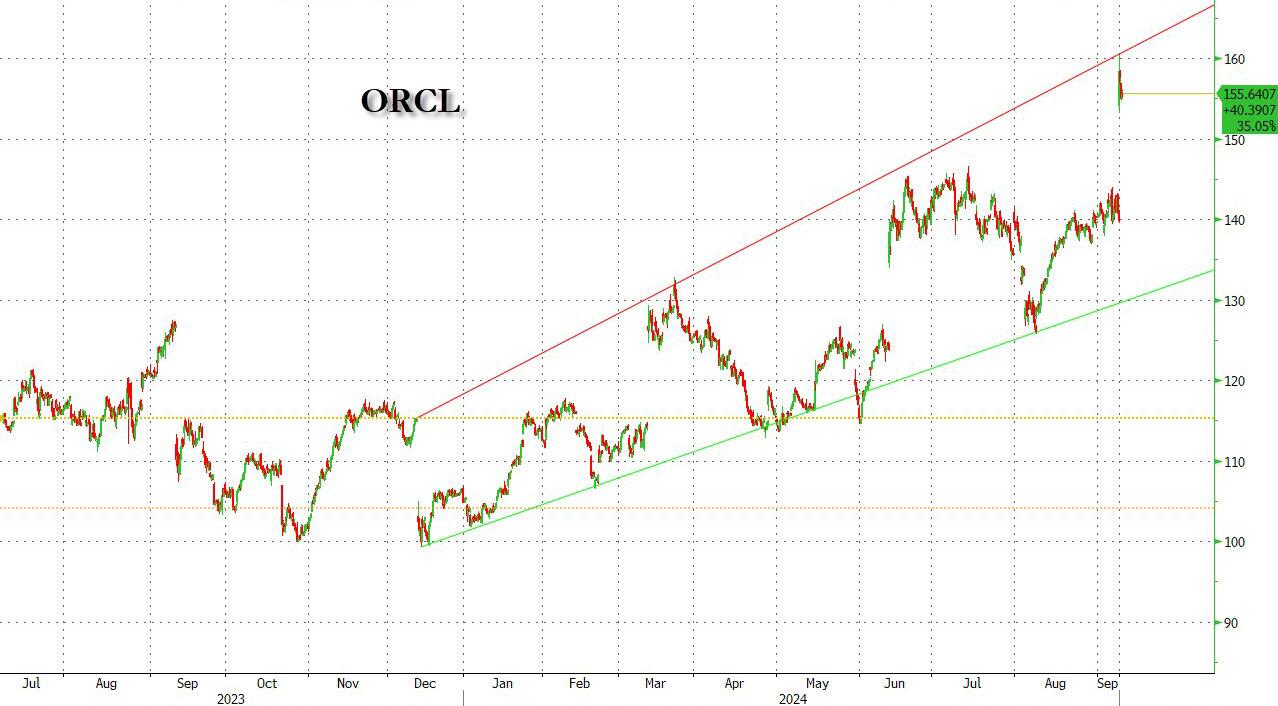
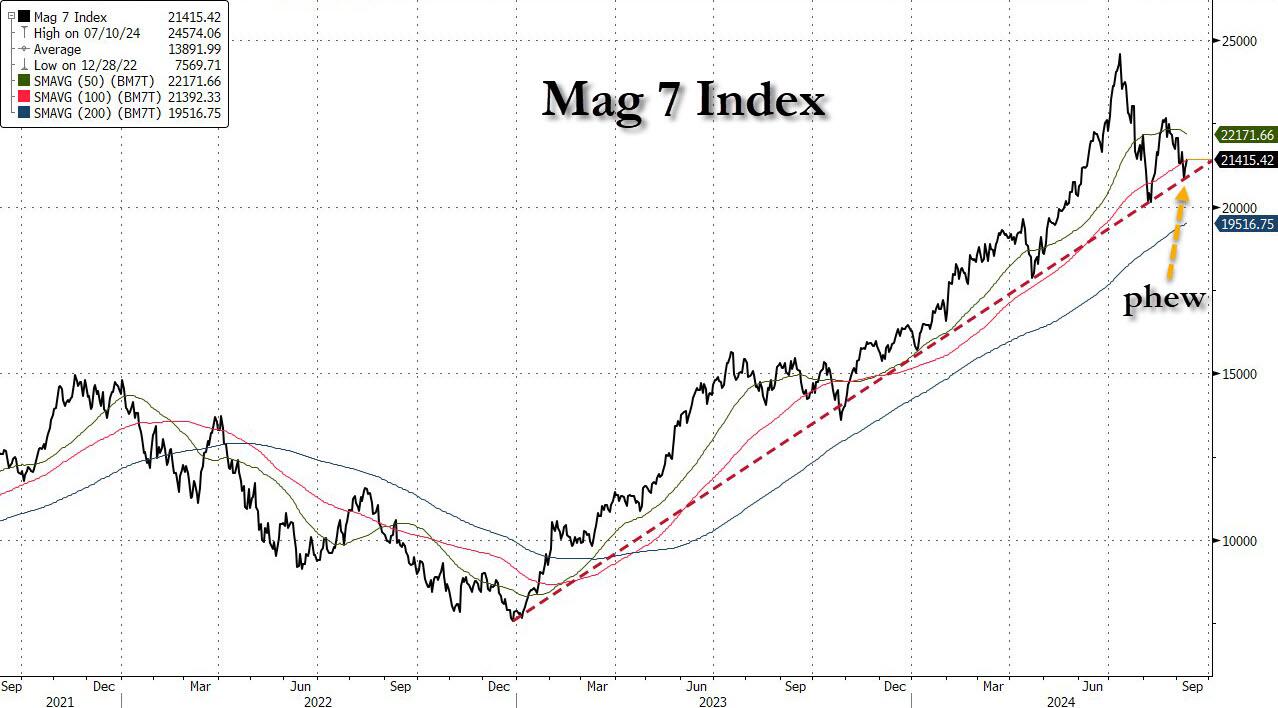
Tech giant Oracle provided a boost to the tech sector with solid earnings results, which also supported the MAG 7 basket as it approached a major support level.
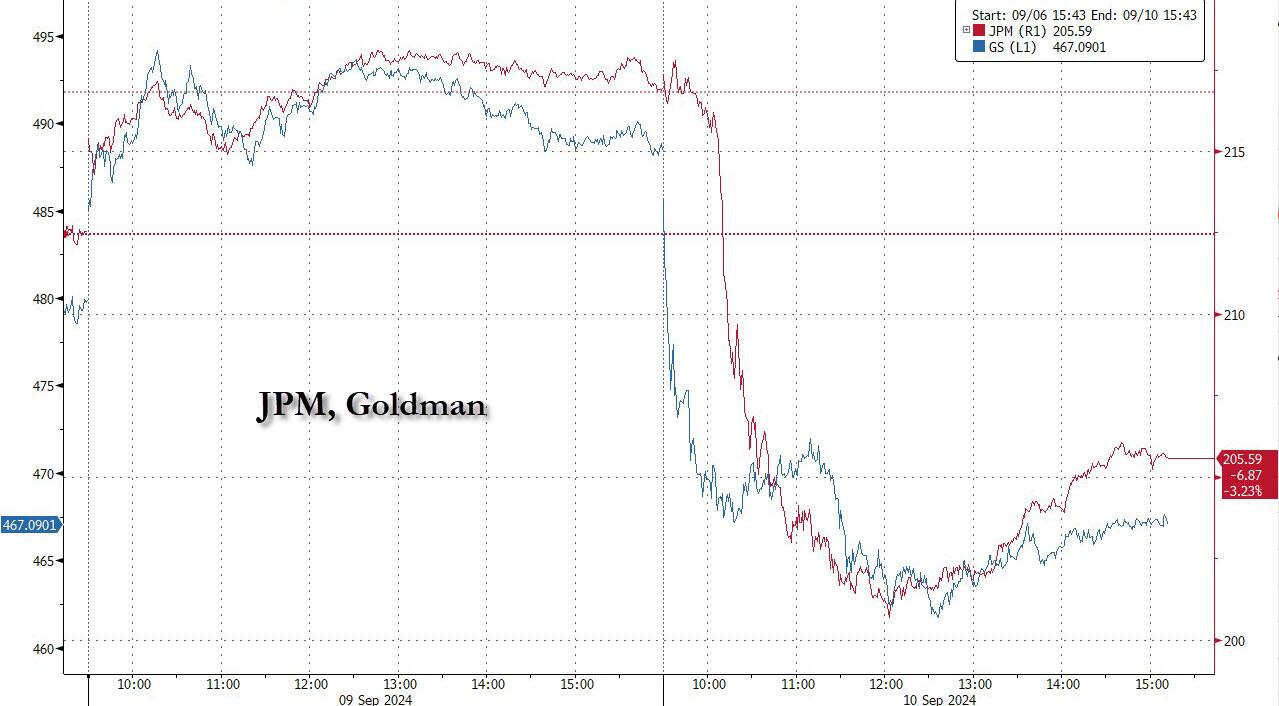
The banking sector, particularly JPMorgan and Goldman Sachs, suffered significant losses as their stocks plummeted on warnings of disappointing Q3 revenues and full-year net interest income outlooks.
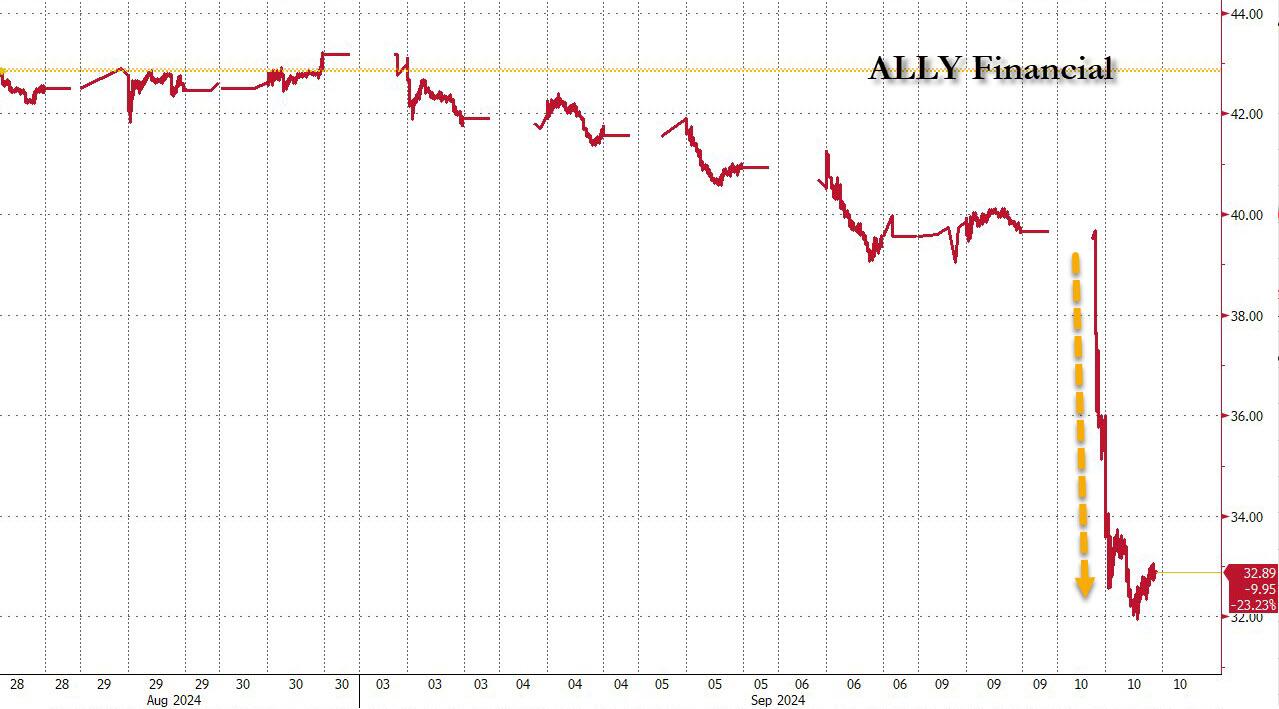
Additionally, Ally Financial, one of the largest US auto loan lenders, revealed surging delinquencies and charge-offs, leading to one of the biggest drops in its stock history.
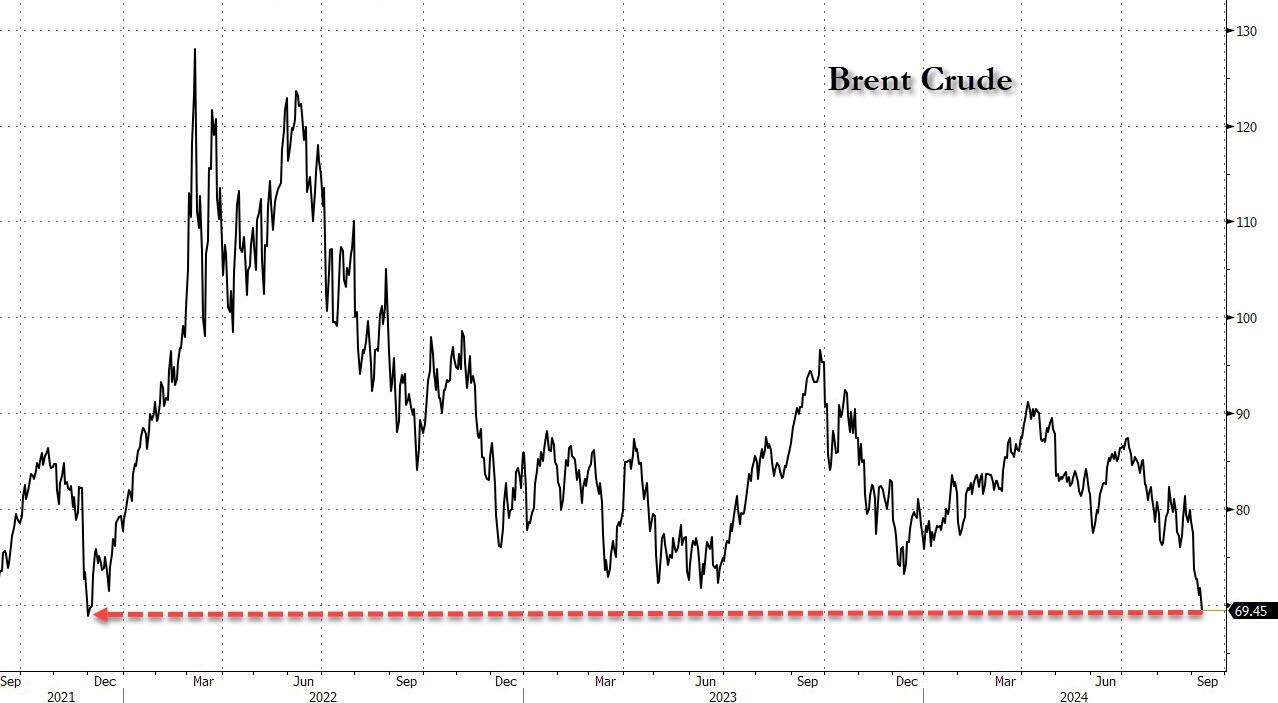
Crude oil prices also fell, dropping around 3.5%. These developments underscore the theme I’ve emphasized over the past year: the economy is straining and in dire need of rescue efforts.
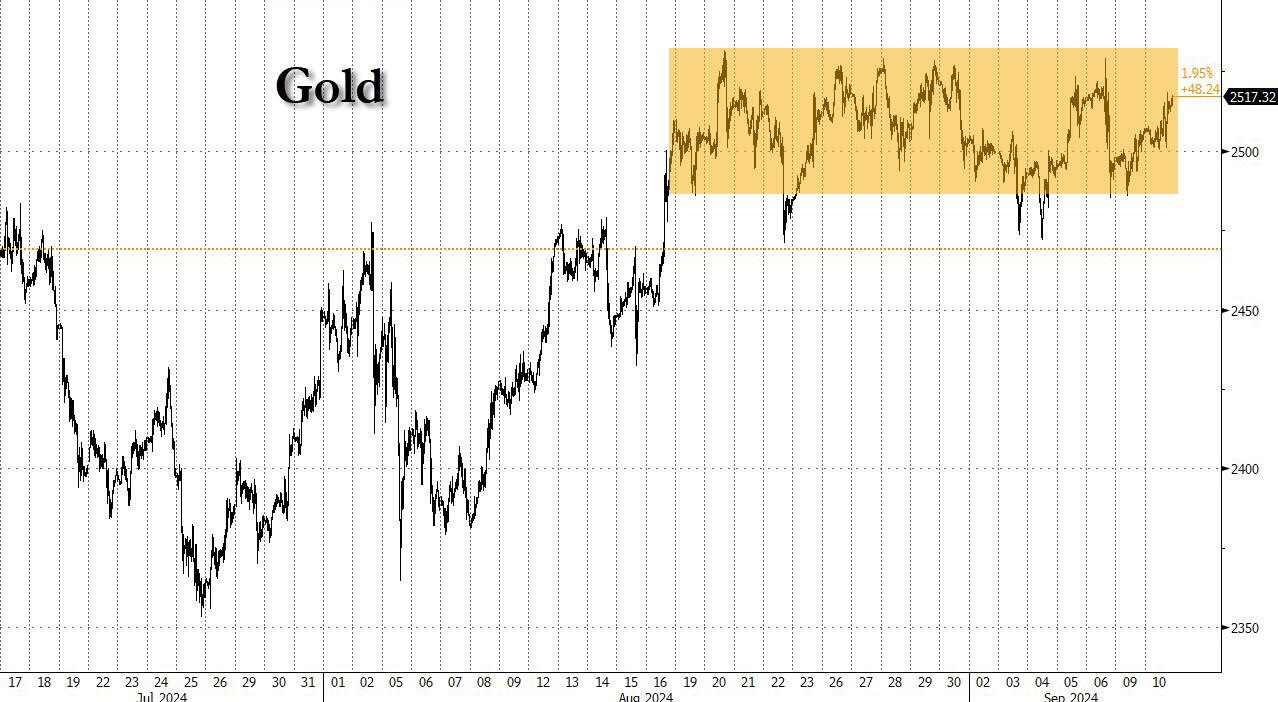
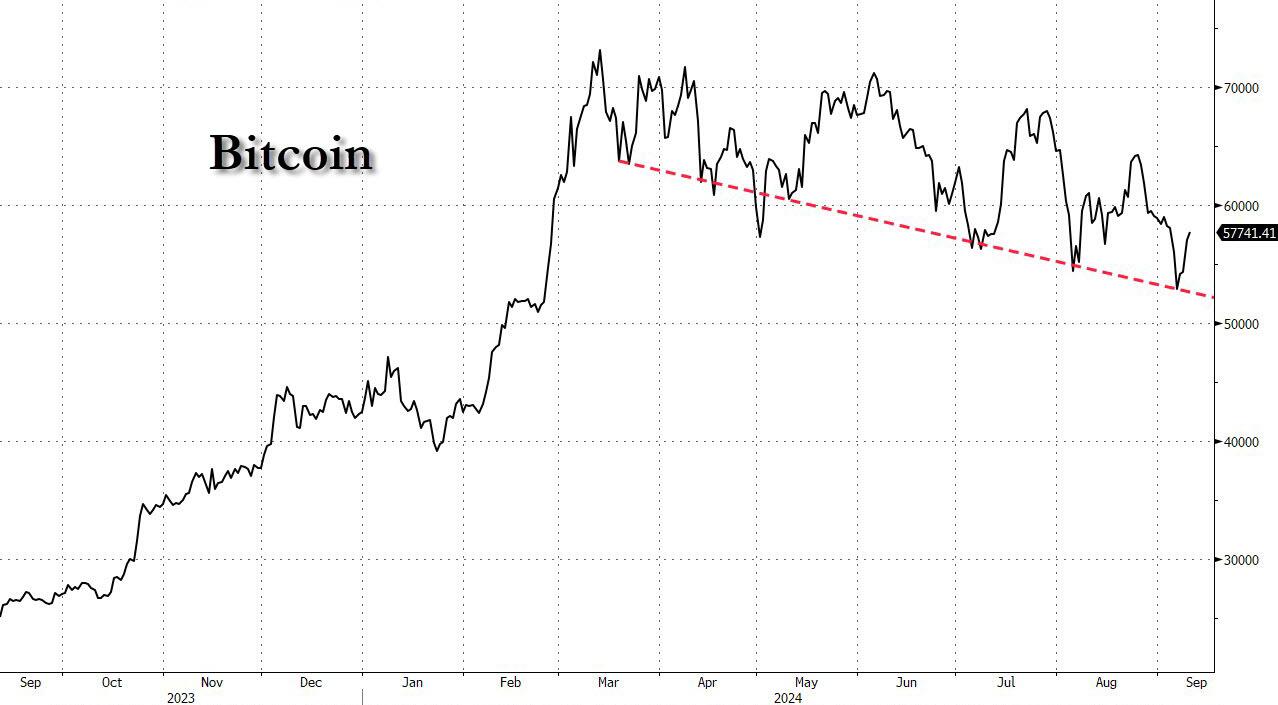
Bond yields pulled back, which boosted gold prices, although the precious metal remains stuck in its four-week trading range. Bitcoin also bounced off its downward support level, gaining slightly.
With the CPI report due tomorrow, traders are more focused on the upcoming presidential debate, where inflation is expected to be a key topic of discussion.
No matter how it turns out, market sentiment will be impacted.
2. Current “Buy” Cycles (effective 11/21/2023)
Our Trend Tracking Indexes (TTIs) have both crossed their trend lines with enough strength to trigger new “Buy” signals. That means, Tuesday, 11/21/2023, was the official date for these signals.
If you want to follow our strategy, you should first decide how much you want to invest based on your risk tolerance (percentage of allocation). Then, you should check my Thursday StatSheet and Saturday’s “ETFs on the Cutline” report for suitable ETFs to buy.
3. Trend Tracking Indexes (TTIs)
Today’s market action can best be described as a rollercoaster of “pumping, dumping, and pumping” again, leaving traders in a state of confusion about how the session might conclude.
Despite the volatility, the bulls ultimately emerged victorious, with both the S&P 500 and the Nasdaq finishing strong.
Meanwhile, our TTIs showed little to no change, reflecting a relatively stable underlying market sentiment amidst the day’s fluctuations.
This is how we closed 09/10/2024:
Domestic TTI: +5.43% above its M/A (prior close +5.37%)—Buy signal effective 11/21/2023.
International TTI: +4.45% above its M/A (prior close +4.58%)—Buy signal effective 11/21/2023.
All linked charts above are courtesy of Bloomberg via ZeroHedge.
———————————————————-
WOULD YOU LIKE TO HAVE YOUR INVESTMENTS PROFESSIONALLY MANAGED?
Do you have the time to follow our investment plans yourself? If you are a busy professional who would like to have his portfolio managed using our methodology, please contact me directly to get more details.
Contact Ulli