
- Moving the market
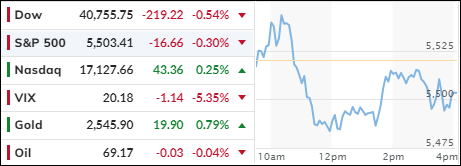
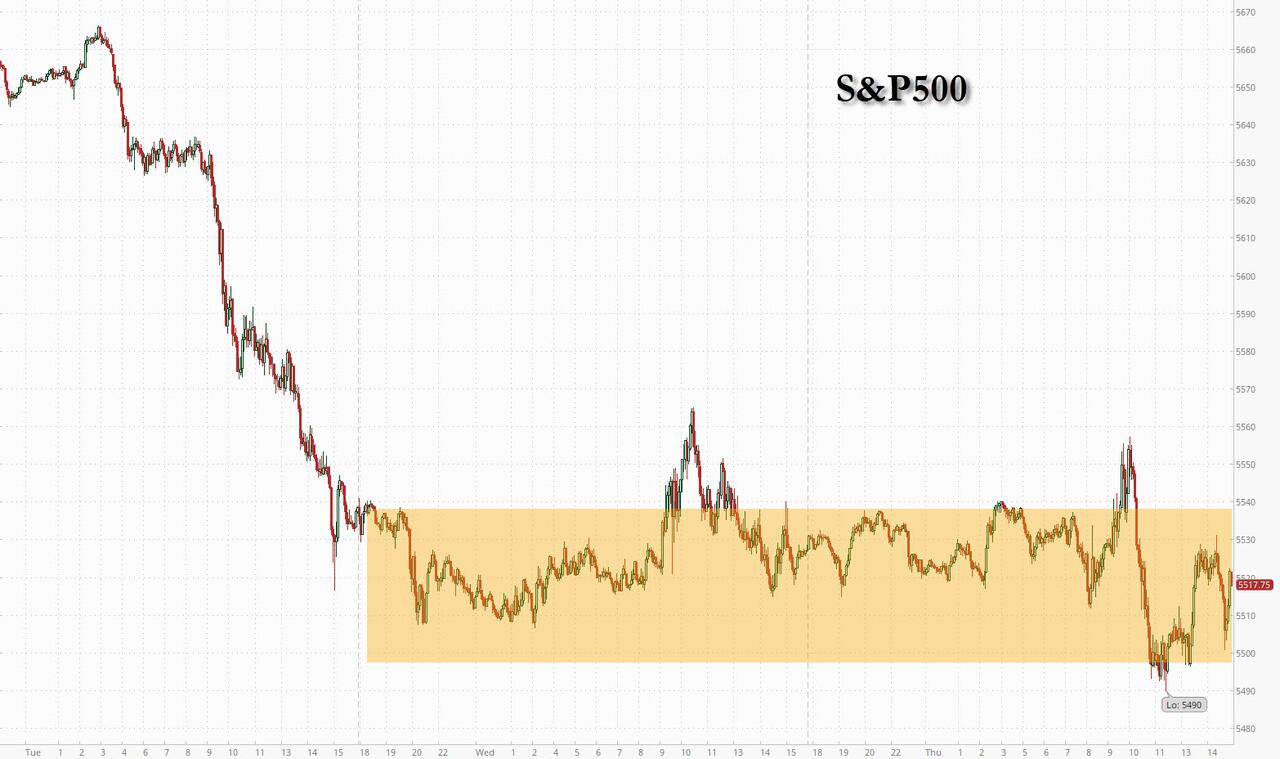
After two consecutive losing sessions, the major indexes made a notable comeback, led by the Nasdaq, as traders revived the tech sector from its slump. Early on, bargain hunters took advantage of the dip, but bearish sentiment soon resurfaced, causing the Dow and S&P 500 to close in the red once again.
Today’s jobless claims fell slightly, reaching an eight-week low. This has created a tug-of-war scenario between employers’ reluctance to lay off workers and their caution about new hiring. Despite reports of a chronic labor shortage, some companies expect the economy to improve once the Federal Reserve implements its rate reduction policy later this month.
However, I believe the economy has already turned downward, and the Fed is lagging on rate cuts. Weak economic data, such as declining manufacturing output, numerous store closures, and mass layoffs by major corporations, have been evident for months.
The ADP employment report revealed a disappointing addition of 99,000 jobs, falling short of the expected 145,000 and marking the weakest growth since January 2021. Additionally, July’s job numbers were revised down from 122,000 to 111,000. This suggests that tomorrow’s jobs report might also fall short of expectations, unless it is artificially inflated to temporarily appease the markets before being revised down again.
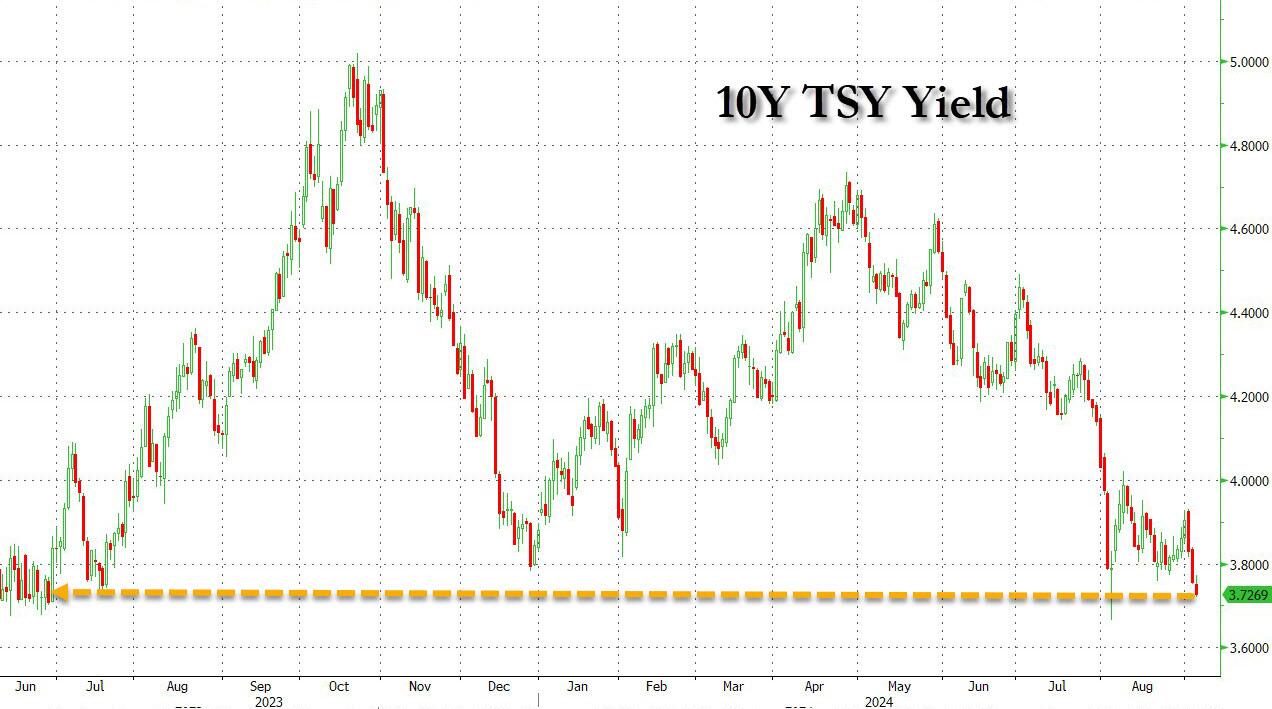
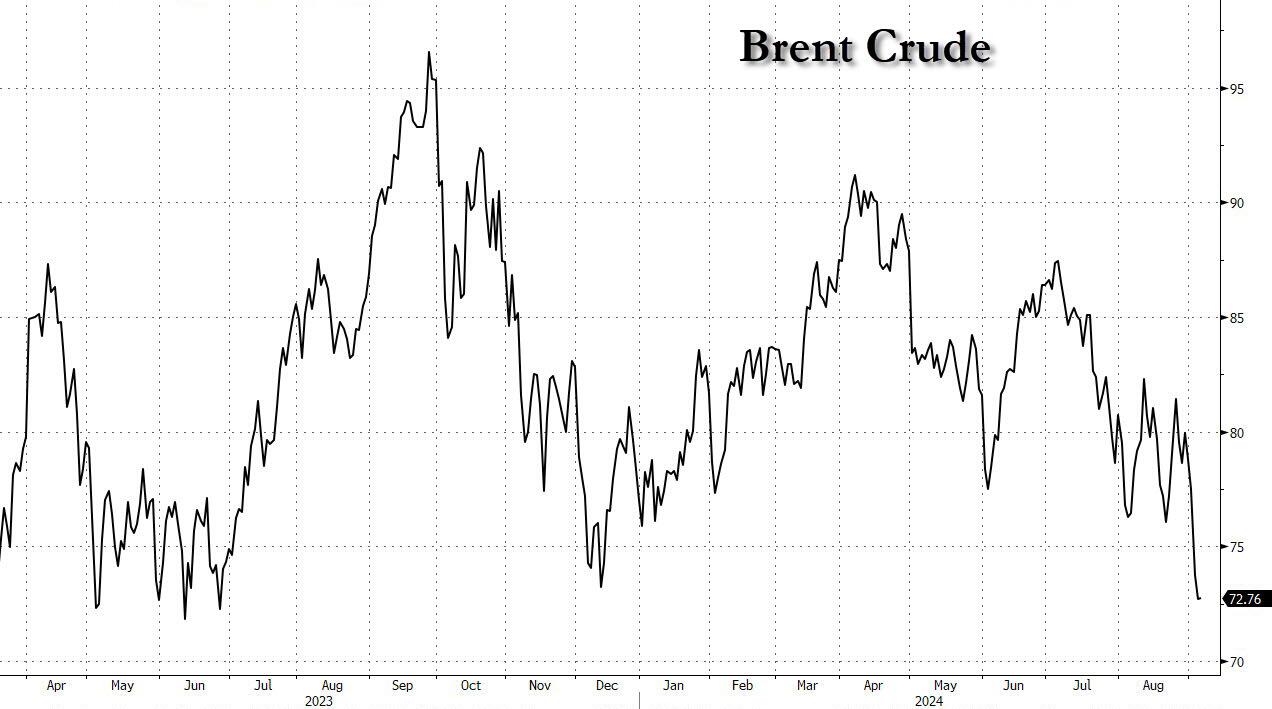
Bond yields dipped slightly, with the 10-year yield hitting its lowest point of 2024. As recession fears intensify, crude oil prices have dropped to their lowest levels of the year, potentially breaking 2023’s lows as well.
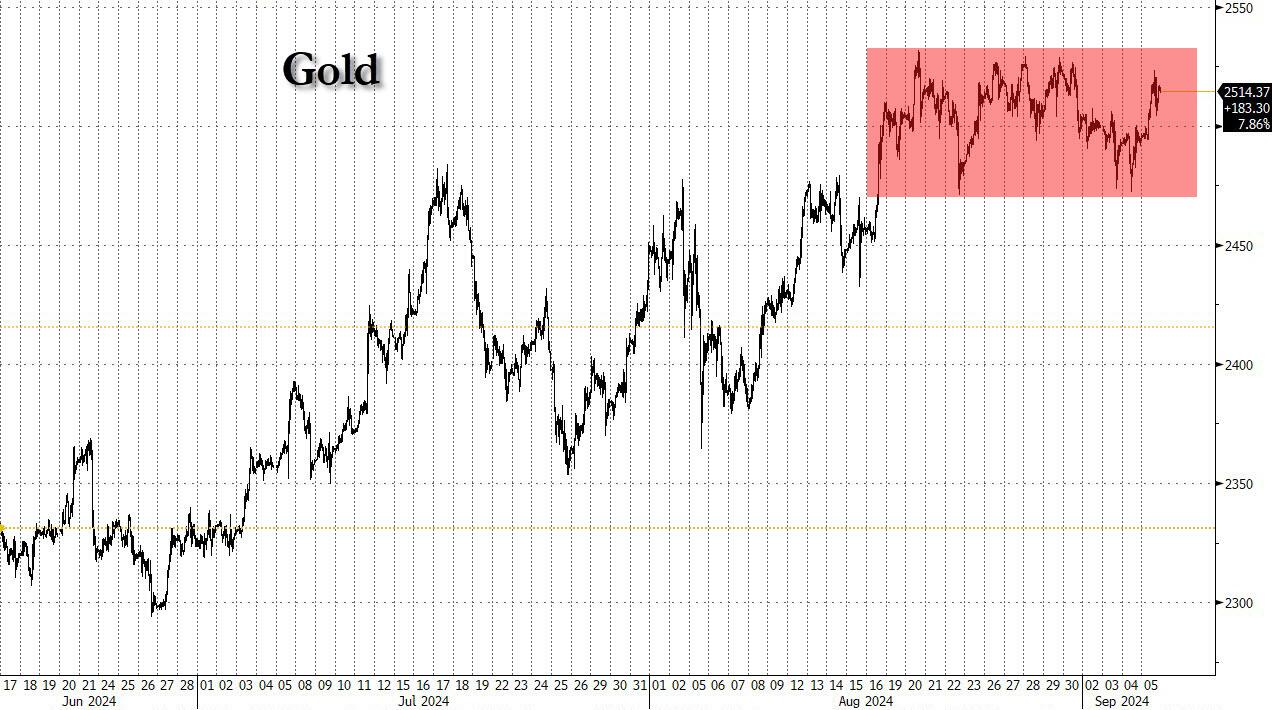
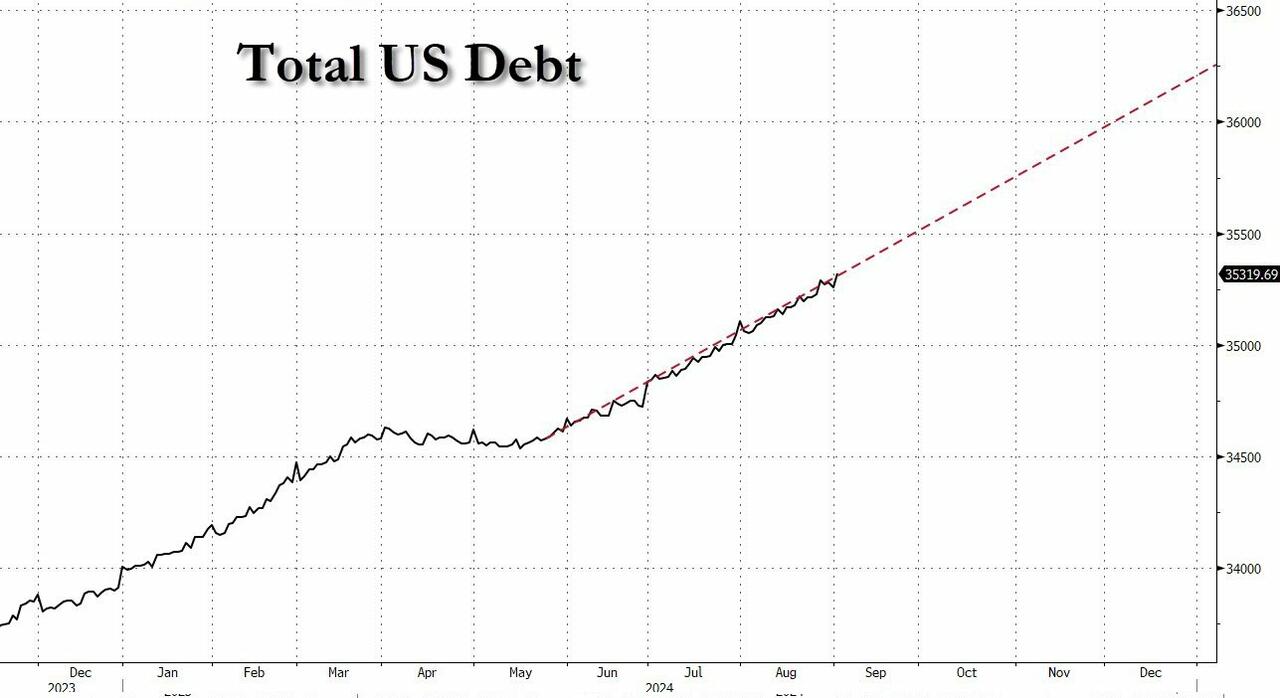
Gold prices surged and, while still within a broad range, appear poised to reach new all-time highs soon. This movement is expected to be driven by lower interest rates, as announced by the Fed, and its upcoming debt monetization, which could propel inflation to new heights.
This leaves me with one question: Got gold?
2. Current “Buy” Cycles (effective 11/21/2023)
Our Trend Tracking Indexes (TTIs) have both crossed their trend lines with enough strength to trigger new “Buy” signals. That means, Tuesday, 11/21/2023, was the official date for these signals.
If you want to follow our strategy, you should first decide how much you want to invest based on your risk tolerance (percentage of allocation). Then, you should check my Thursday StatSheet and Saturday’s “ETFs on the Cutline” report for suitable ETFs to buy.
3. Trend Tracking Indexes (TTIs)
The market’s performance today closely mirrored that of yesterday. Initially, the major indexes surged forward with strong momentum. However, this optimism was short-lived as they encountered significant resistance, causing a sharp reversal.
Consequently, both the Dow Jones Industrial Average and the S&P 500 ended the day in negative territory once again.
Our TTIs also succumbed to the prevailing bearish sentiment, experiencing moderate declines.
This is how we closed 09/05/2024:
Domestic TTI: +5.85% above its M/A (prior close +6.51%)—Buy signal effective 11/21/2023.
International TTI: +5.76% above its M/A (prior close +6.00%)—Buy signal effective 11/21/2023.
All linked charts above are courtesy of Bloomberg via ZeroHedge.
———————————————————-
WOULD YOU LIKE TO HAVE YOUR INVESTMENTS PROFESSIONALLY MANAGED?
Do you have the time to follow our investment plans yourself? If you are a busy professional who would like to have his portfolio managed using our methodology, please contact me directly to get more details.
Contact Ulli