
ETF Tracker StatSheet
You can view the latest version here.
GOLD SHINES AMID MARKET VOLATILITY, REACHES NEW ALL-TIME HIGH
- Moving the market
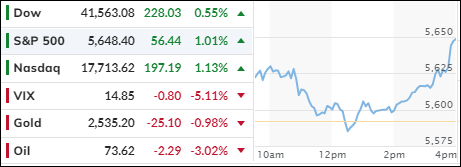
The volatility that marked the beginning of August subsided, allowing bullish sentiment to prevail as we closed out the month. Despite an initial drop of over 7%, the S&P 500 rebounded, achieving its fourth consecutive winning month with a 2.3% gain. In contrast, the Nasdaq barely managed to close in the green.
Traders found relief in the Federal Reserve’s preferred inflation gauge, the Personal Consumption Expenditures (PCE) index, which rose by only 0.2% month-over-month and 2.5% year-over-year. These figures met expectations and reinforced the belief that the Fed will cut rates at their September 18 meeting.
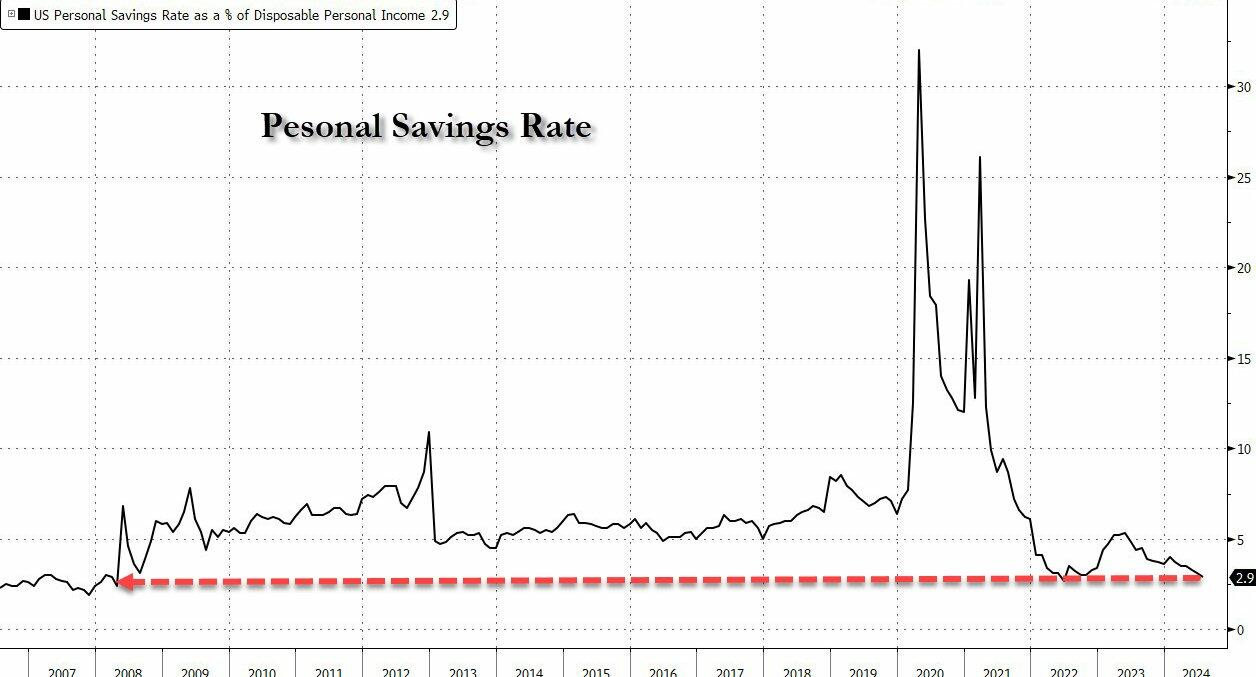
However, the Personal Savings Rate as a percentage of disposable personal income fell below 3% for the first time since the COVID-19 pandemic. This was the lowest level since June 2022 and the second lowest since 2008, reflecting challenging economic conditions.
The Economic Surprise Index continued its volatile trend from July but ended the month on a positive note, as the early August market downturn became a distant memory. Most stock indexes closed August positively.
Following the early August decline, bond yields rose and decoupled from equities. Gold emerged as the standout performer, reaching a new all-time high after an initial drop.
Crude oil traded within a broad range but ultimately closed lower, the dollar dropped before attempting a rebound, and Bitcoin recovered from early losses only to fade back by month’s end.
With Nvidia’s earnings now public and the stock having retreated from its highs, can it overcome historical comparisons with Cisco Systems and continue to advance despite significant recession risks?
2. Current “Buy” Cycles (effective 11/21/2023)
Our Trend Tracking Indexes (TTIs) have both crossed their trend lines with enough strength to trigger new “Buy” signals. That means, Tuesday, 11/21/2023, was the official date for these signals.
If you want to follow our strategy, you should first decide how much you want to invest based on your risk tolerance (percentage of allocation). Then, you should check my Thursday StatSheet and Saturday’s “ETFs on the Cutline” report for suitable ETFs to buy.
3. Trend Tracking Indexes (TTIs)
Throughout the trading session, the major indexes fluctuated, moving above and below their respective unchanged lines. However, a late surge ensured that the markets closed in positive territory.
Additionally, our TTIs managed to secure another gain on this final trading day of August.
This is how we closed 08/30/2024:
Domestic TTI: +8.05% above its M/A (prior close +7.68%)—Buy signal effective 11/21/2023.
International TTI: +7.66% above its M/A (prior close +7.57%)—Buy signal effective 11/21/2023.
All linked charts above are courtesy of Bloomberg via ZeroHedge.
———————————————————-
WOULD YOU LIKE TO HAVE YOUR INVESTMENTS PROFESSIONALLY MANAGED?
Do you have the time to follow our investment plans yourself? If you are a busy professional who would like to have his portfolio managed using our methodology, please contact me directly to get more details.
Contact Ulli