
- Moving the market
Last week’s selloff spread globally and accelerated this morning as traders grappled with fears of a U.S. recession. The downturn began in Japan, where the Nikkei plummeted over 12%, marking its worst day since the 1987 Black Monday crash. Contributing to the turmoil was Japan’s recent decision to hike interest rates, which disrupted the highly leveraged yen carry trade and triggered a cascade of selling and forced liquidations worldwide.
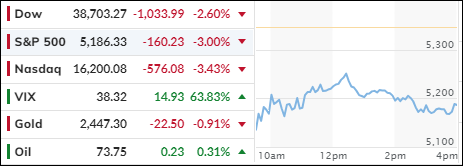
In the U.S., the Dow Jones Industrial Average dropped over 1,000 points, or 2.6%, while the Nasdaq fared even worse, losing 3.4%. The release of July’s jobs report on Friday exacerbated the situation, convincing traders that the Federal Reserve is behind the curve in cutting rates to address the current economic slowdown.
Mega-cap tech stocks were hit hardest, with Nvidia falling 6%, Apple 5%, and Tesla 4%. Broadcom and Super Micro also declined by 1% and 2.5%, respectively. Notably, only nine stocks in the S&P 500 ended the session higher.
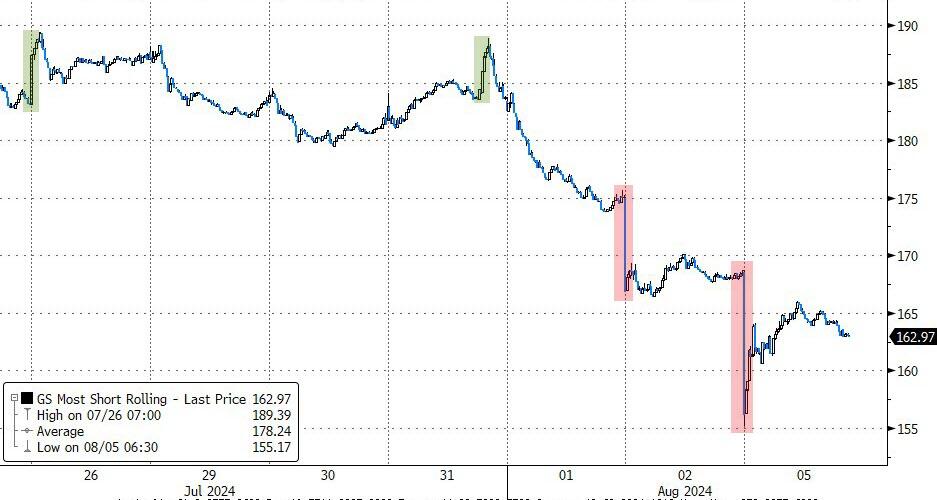
At their lowest points, Small Caps and the Nasdaq were down 6% before dip buyers stepped in to limit the damage. The most shorted stocks were heavily impacted but managed to recover some ground late in the session.
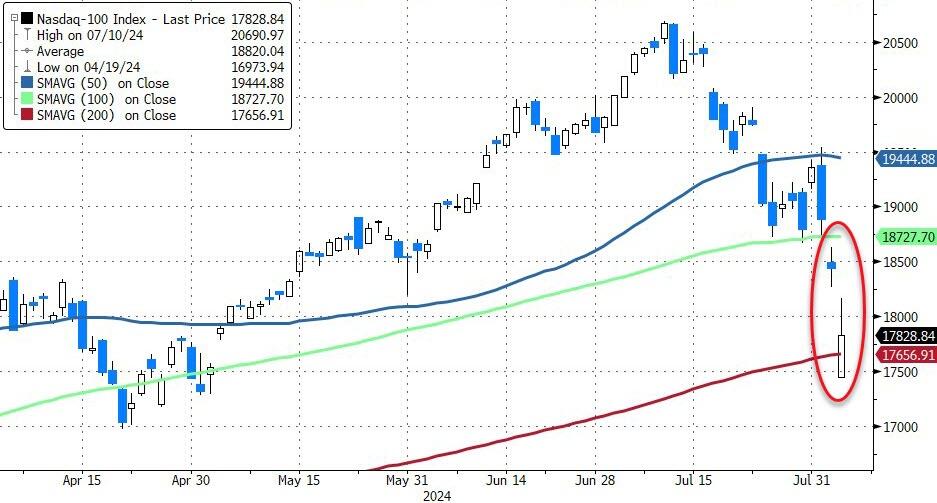
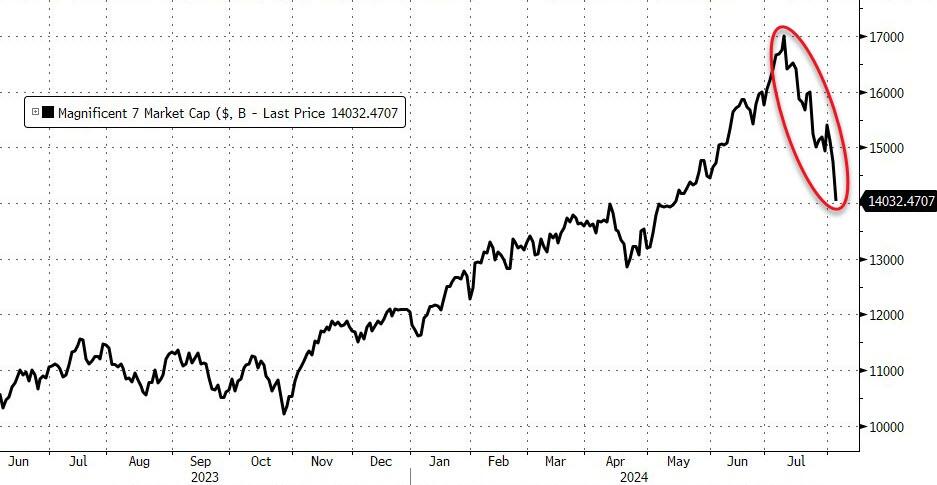
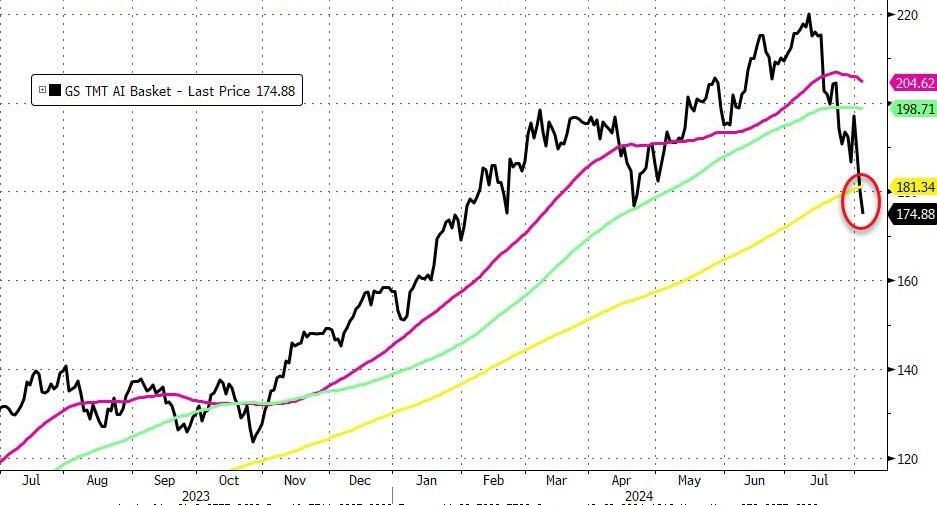
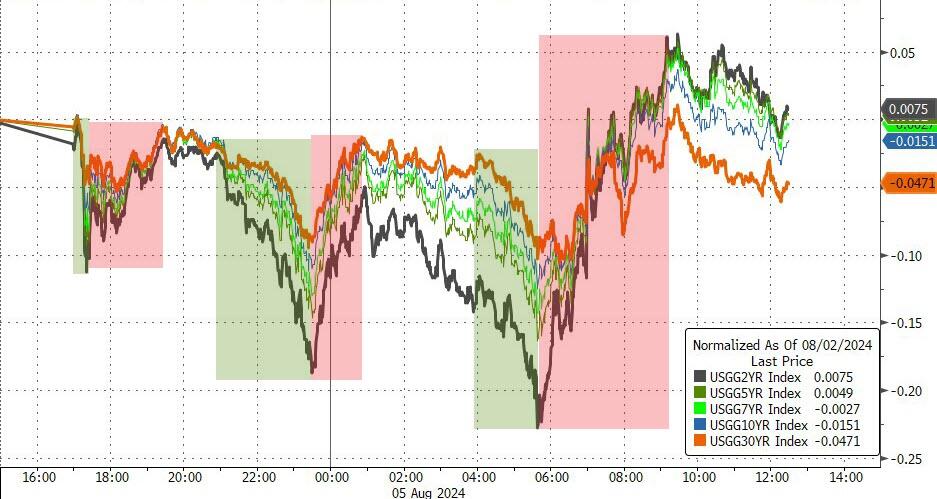
The MAG7 stocks suffered significant losses, now down an astonishing $3 trillion from their record highs. The AI sector also faced a rapid decline, falling below its 200-day moving average. Bond yields were volatile, initially collapsing before rebounding to nearly unchanged levels.
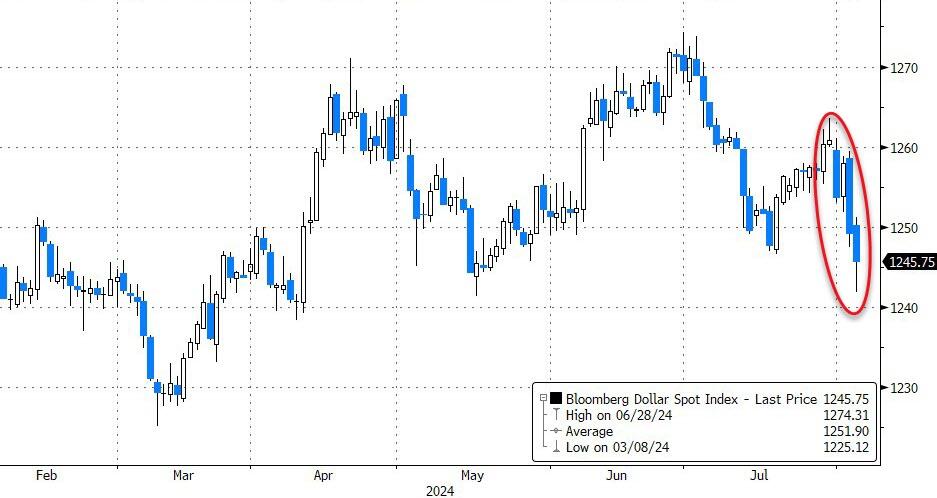
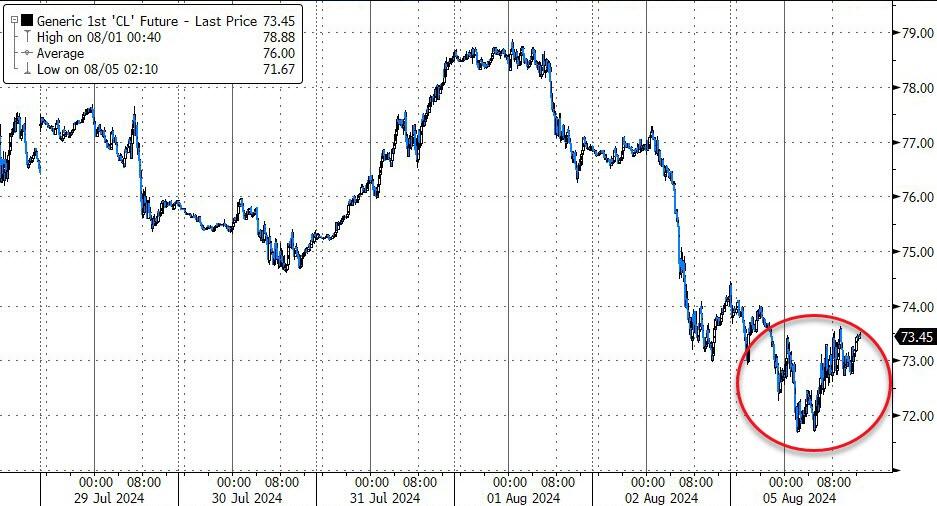
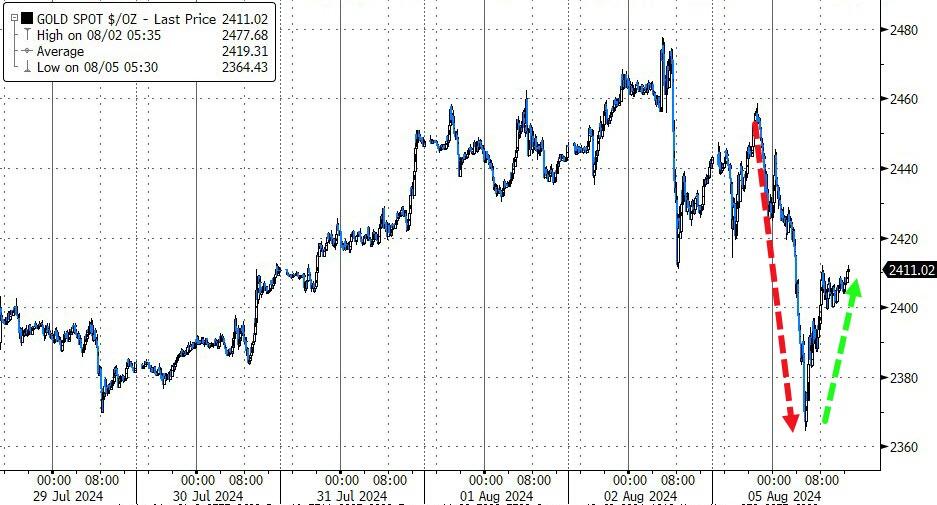
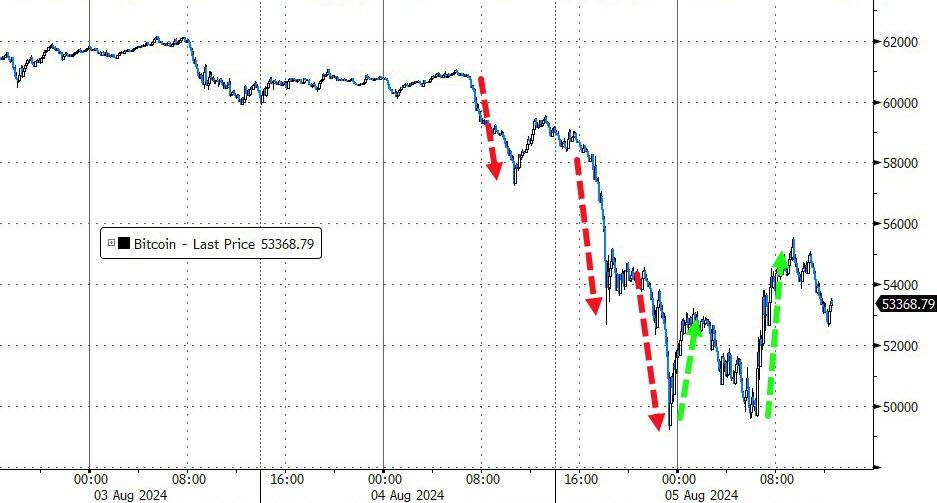
The dollar weakened, crude oil retreated but later recovered, and gold experienced wild swings before bouncing off support. Bitcoin also took a dive as traders liquidate assets to meet margin calls, but it found support at the $50,000 level.
In my advisory practice, we sold a major tech ETF and closed our position in the international market after the International TTI dropped below its long-term trend line.
The future direction of the market now hinges on the Federal Reserve’s response.
Will they panic and implement an emergency rate cut to prevent equities from plunging further?
2. Current “Buy” Cycles (effective 11/21/2023)
Our Trend Tracking Indexes (TTIs) have both crossed their trend lines with enough strength to trigger new “Buy” signals. That means, Tuesday, 11/21/2023, was the official date for these signals.
If you want to follow our strategy, you should first decide how much you want to invest based on your risk tolerance (percentage of allocation). Then, you should check my Thursday StatSheet and Saturday’s “ETFs on the Cutline” report for suitable ETFs to buy.
3. Trend Tracking Indexes (TTIs)
The global equity markets saw a significant downturn, with red numbers prevailing across the board. This widespread sell-off has left traders speculating about the future direction of the markets.
Our TTIs also took a sharp dive, particularly the international index, which fell below its long-term trend line. This prompted me to liquidate our global holdings.
However, since this is the first instance of the index dipping below the trend line, I am withholding a formal “Sell” signal until further downside confirmation is received.
This is how we closed 08/05/2024:
Domestic TTI: +1.81% above its M/A (prior close +4.28%)—Buy signal effective 11/21/2023.
International TTI: -0.62% below its M/A (prior close +2.86%)—Buy signal effective 11/21/2023.
All linked charts above are courtesy of Bloomberg via ZeroHedge.
———————————————————-
WOULD YOU LIKE TO HAVE YOUR INVESTMENTS PROFESSIONALLY MANAGED?
Do you have the time to follow our investment plans yourself? If you are a busy professional who would like to have his portfolio managed using our methodology, please contact me directly to get more details.
Contact Ulli