
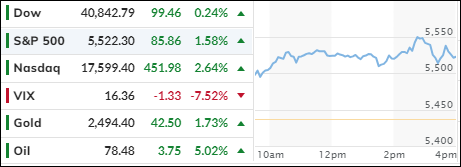
- Moving the market
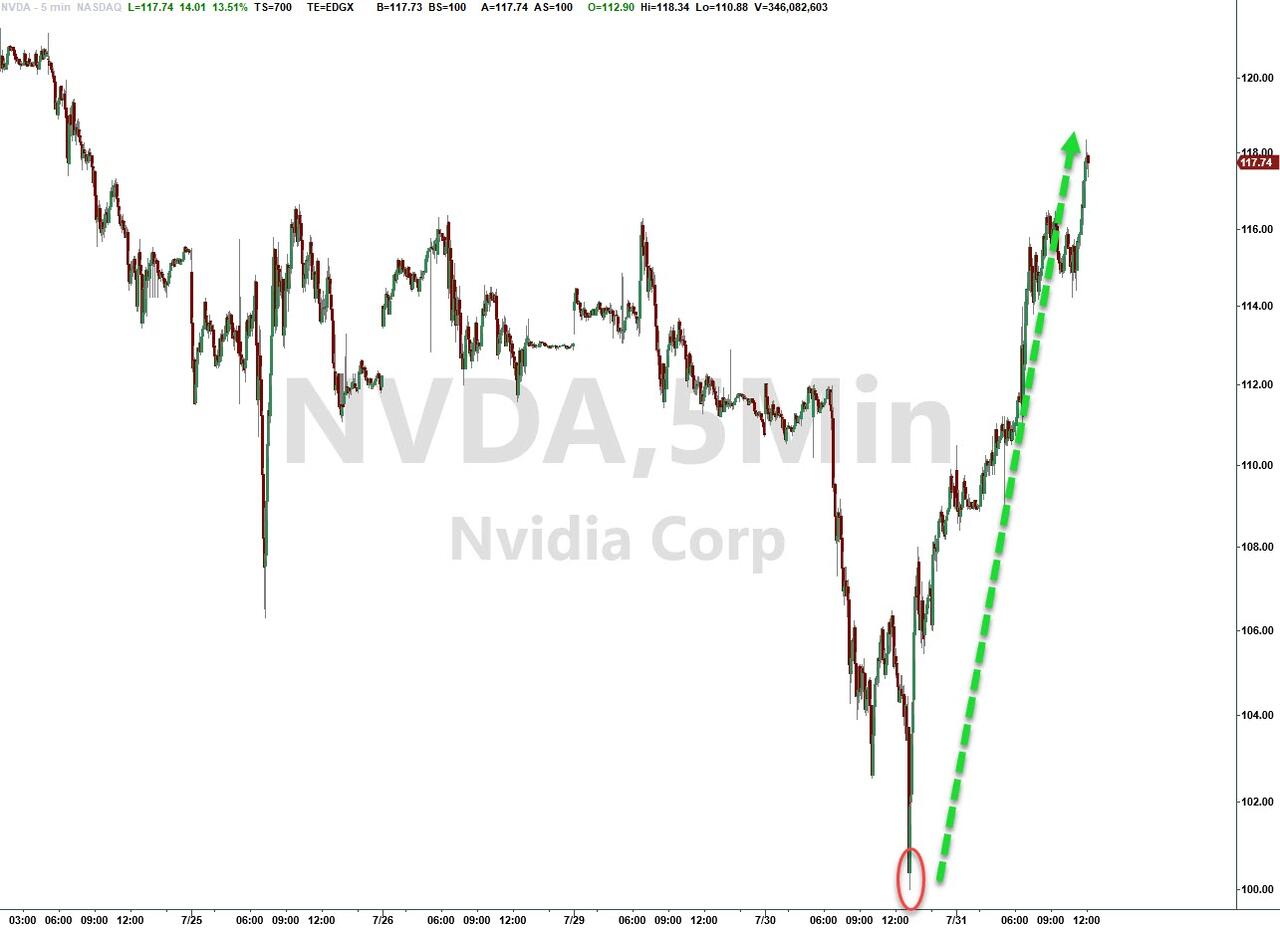
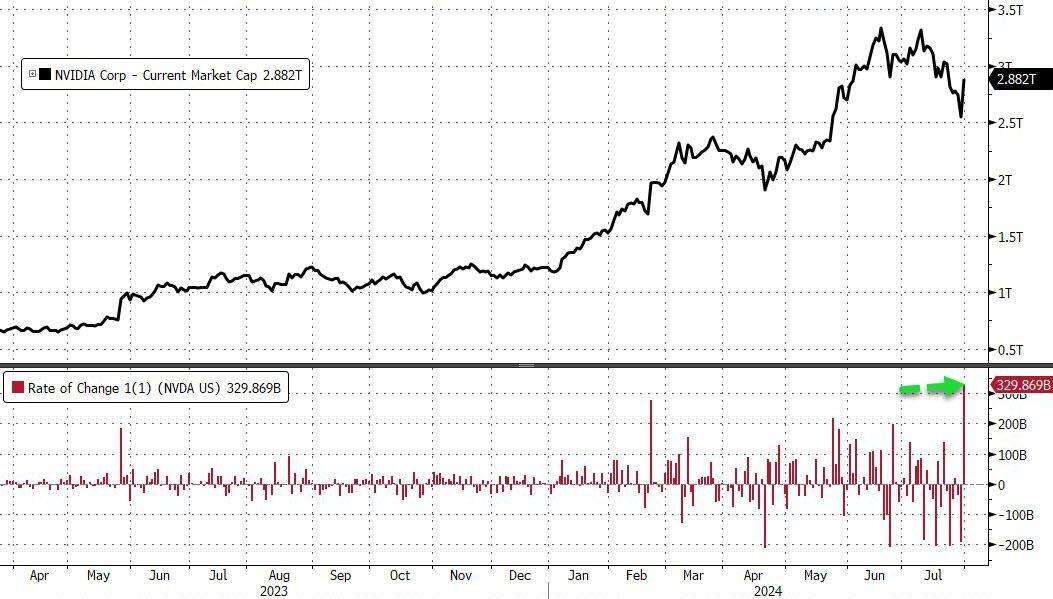
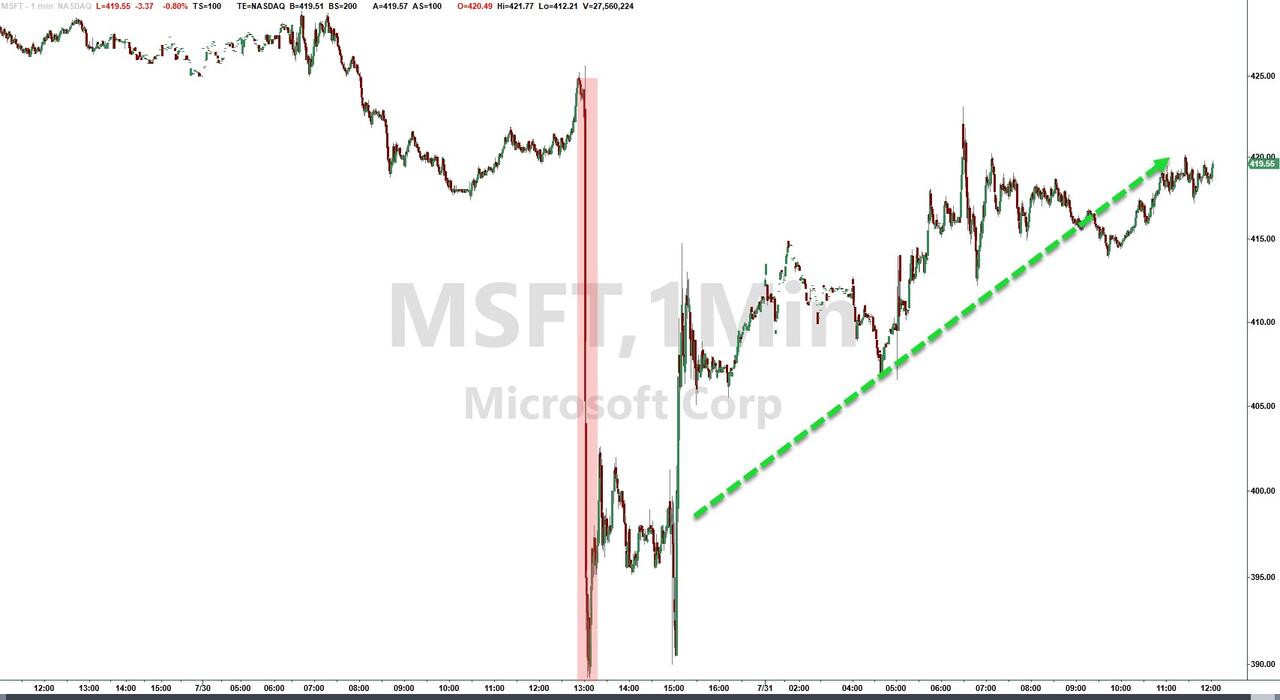
The tech sector saw a significant boost, led by Advanced Micro Devices (AMD), which lifted the Nasdaq to an impressive gain after surpassing second-quarter expectations. Nvidia followed suit, achieving its largest single-day gain ever at 12%. Meanwhile, Microsoft experienced a decline due to underwhelming cloud business performance but managed to recover by the close of trading.
Despite reporting a larger-than-expected loss and disappointing revenue, Boeing’s shares rose by 2% following the announcement of a new CEO.
The Nasdaq led the charge, with all major indexes climbing higher in anticipation of more earnings reports and the Federal Reserve’s decision on interest rates. The Fed opted to keep rates unchanged, but traders were keenly focused on any hints of a potential rate cut in September.
Fed Chair Powell maintained cautious optimism, suggesting that if inflation data continues to improve, a rate reduction could be considered at the next meeting. The Fed’s post-meeting statement was more optimistic, noting progress towards the 2% inflation target. This positive outlook fueled further gains in the tech sector, with companies like Apple, Meta, and Amazon joining the rally.
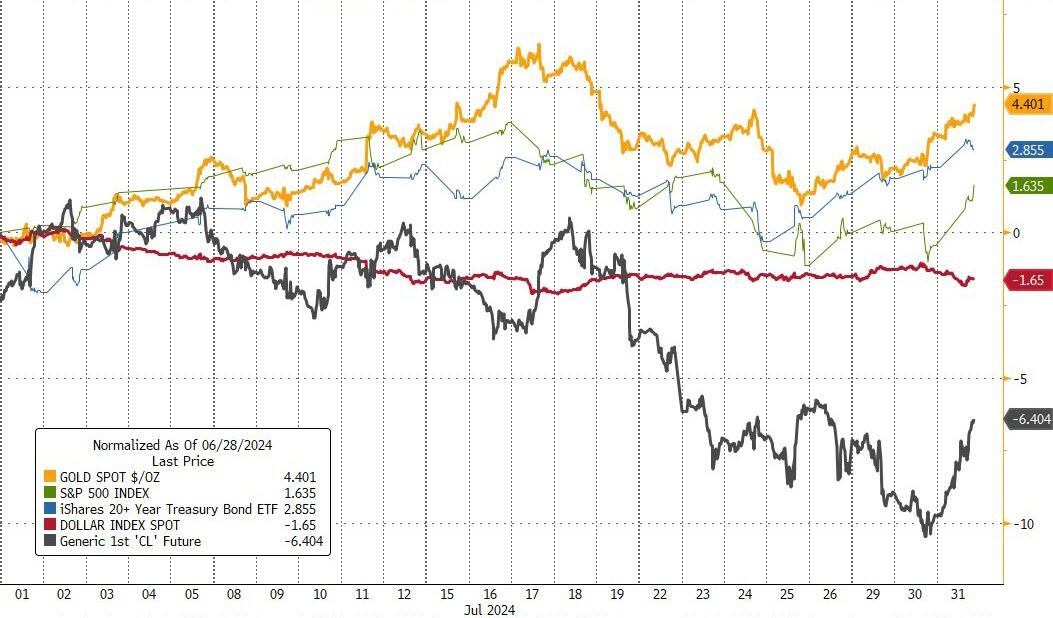
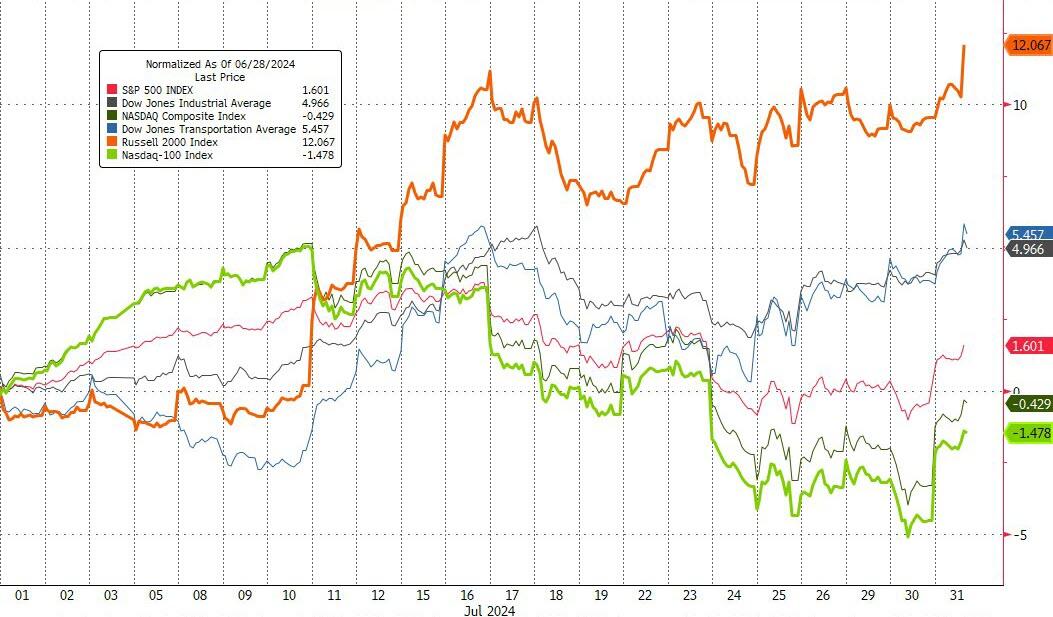
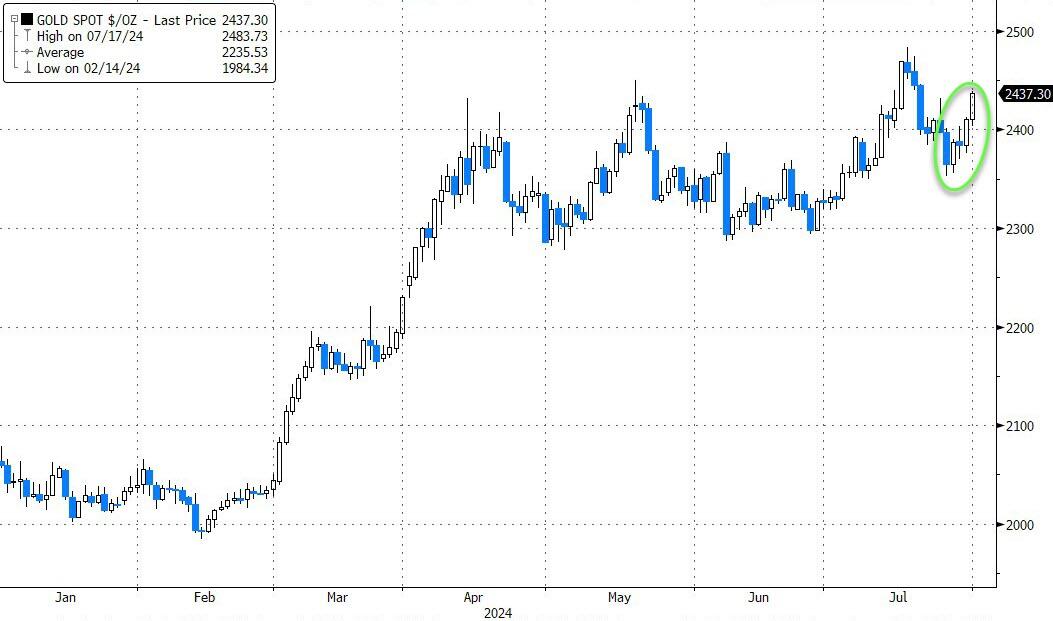
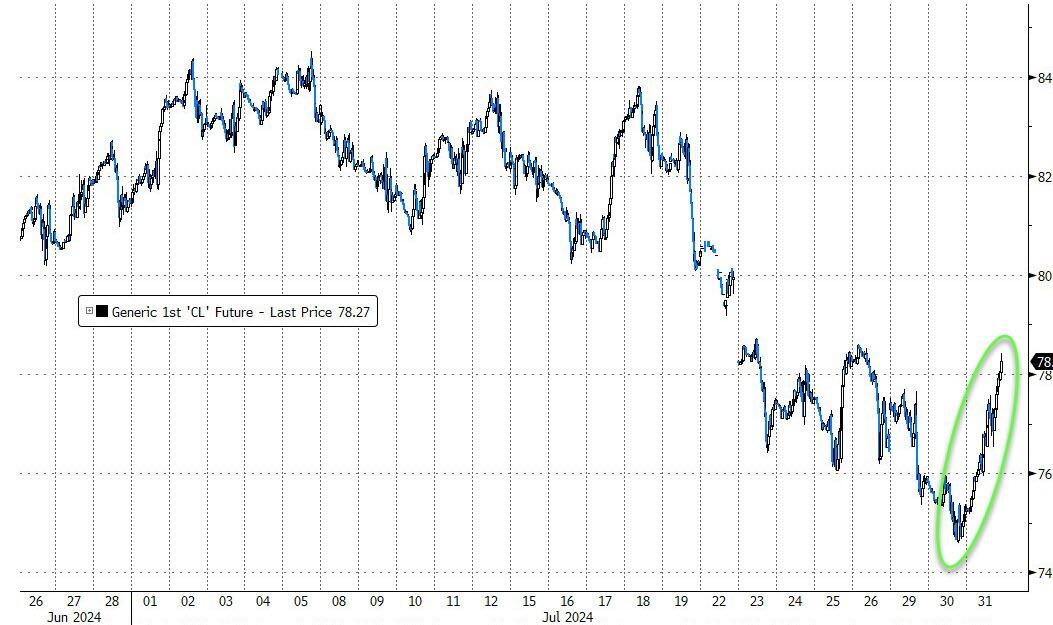
In July, gold emerged as the top performer, followed closely by bonds, while the dollar and crude oil ended the month in the red. Small Caps surged ahead by 12%, contrasting with the Nasdaq’s 1.5% decline, highlighting a significant divergence.
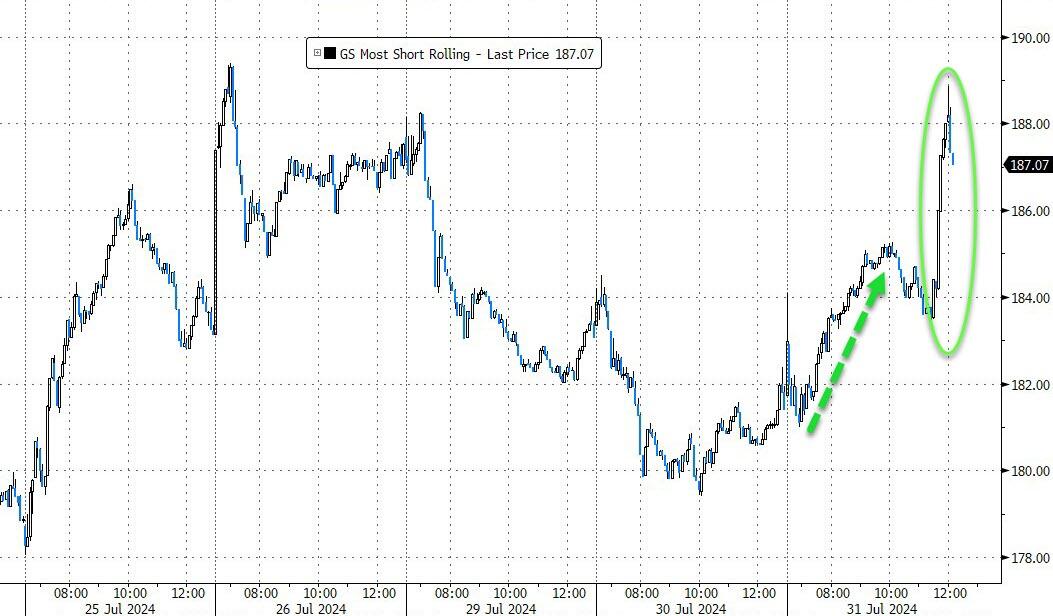
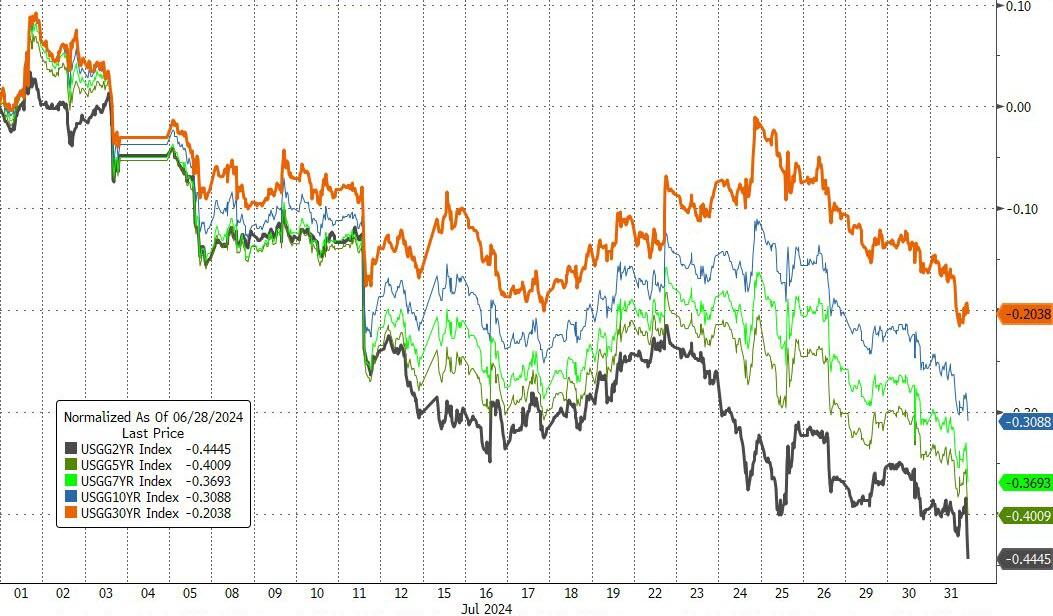
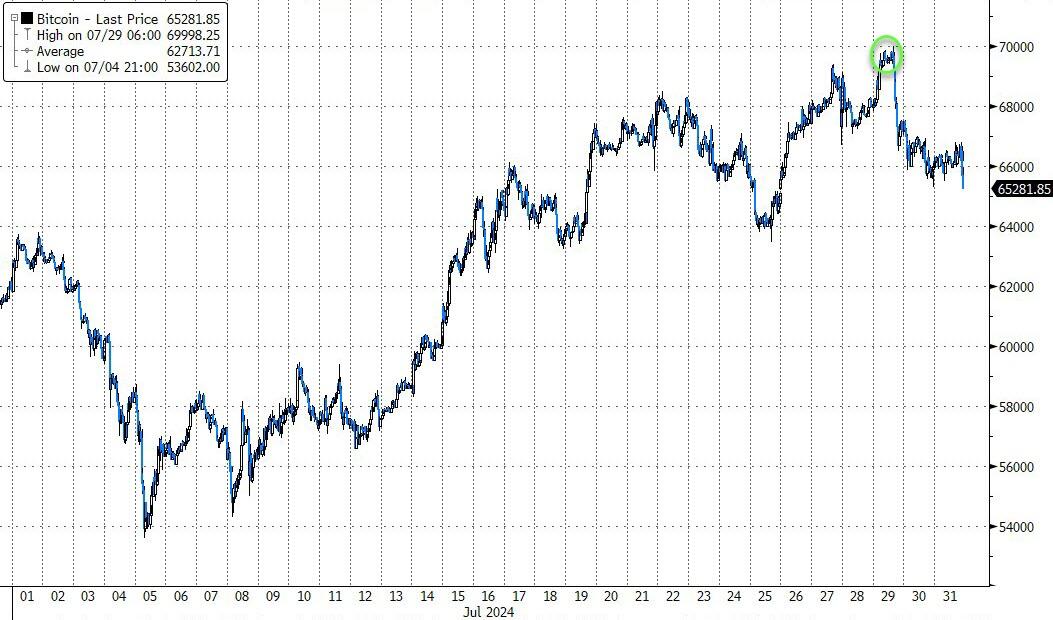
The most shorted stocks saw substantial gains, sustaining the rally throughout the session. Bond yields dropped, and gold reached its highest monthly closing level ever. Crude oil recovered some losses amid rising tensions in the Middle East, and Bitcoin, although down from its $70k high, still posted gains.
Thanks to the day’s rebound, the S&P 500 managed a slight gain for July. As we move into August, will the index be able to maintain this upward trajectory?
2. Current “Buy” Cycles (effective 11/21/2023)
Our Trend Tracking Indexes (TTIs) have both crossed their trend lines with enough strength to trigger new “Buy” signals. That means, Tuesday, 11/21/2023, was the official date for these signals.
If you want to follow our strategy, you should first decide how much you want to invest based on your risk tolerance (percentage of allocation). Then, you should check my Thursday StatSheet and Saturday’s “ETFs on the Cutline” report for suitable ETFs to buy.
3. Trend Tracking Indexes (TTIs)
Today’s surge in market activity can be attributed to a combination of strong earnings reports and optimism surrounding the Federal Reserve’s decision to maintain current interest rates.
This decision, coupled with the possibility of a rate cut in September, fueled a significant rally, particularly in the Nasdaq.
Our TTIs also reflected this positive sentiment, as they moved further away from their respective trend lines, indicating a sustained bullish environment.
This is how we closed 07/31/2024:
Domestic TTI: +7.76% above its M/A (prior close +7.25%)—Buy signal effective 11/21/2023.
International TTI: +7.09% above its M/A (prior close +5.97%)—Buy signal effective 11/21/2023.
All linked charts above are courtesy of Bloomberg via ZeroHedge.
———————————————————-
WOULD YOU LIKE TO HAVE YOUR INVESTMENTS PROFESSIONALLY MANAGED?
Do you have the time to follow our investment plans yourself? If you are a busy professional who would like to have his portfolio managed using our methodology, please contact me directly to get more details.
Contact Ulli