
- Moving the markets
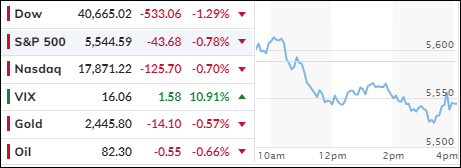
The Nasdaq and S&P 500 saw a modest rebound early in the day, with the Nasdaq attempting to recover from its worst decline in two years. However, by midday, a wave of selling pressure hit the markets, leading to a significant downturn, with the Dow suffering the most.
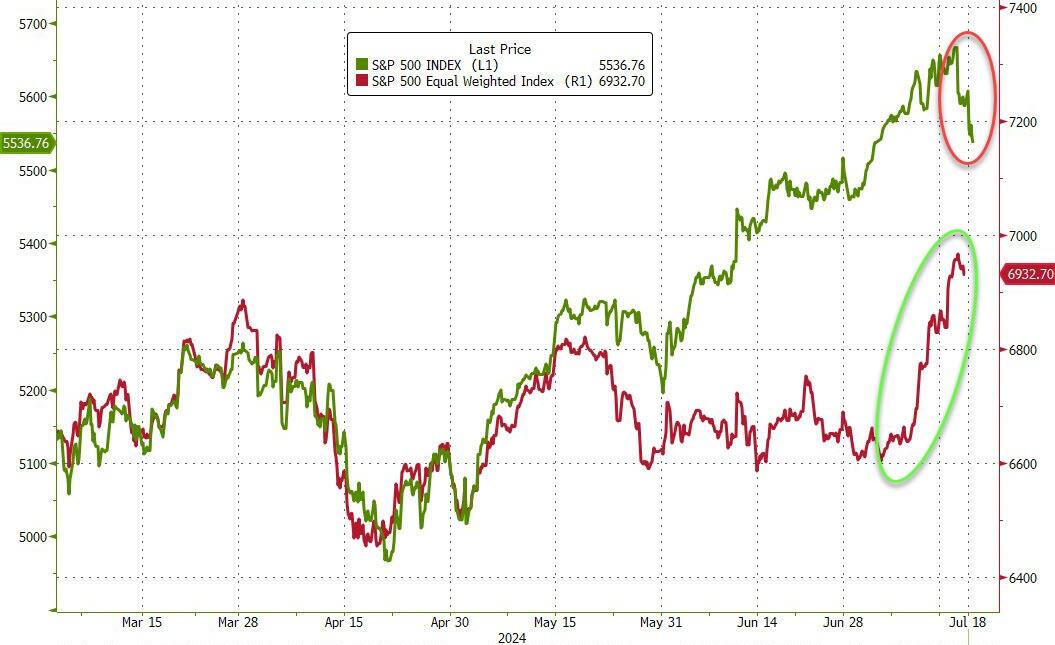
The sell-off in tech stocks continued, driven by the increasing likelihood that the Federal Reserve might ease off on raising interest rates in September. While this had previously supported the broader market, today saw a widespread decline across all asset classes, including Small Caps, which turned traders’ screens into a sea of red.
Over the past five trading days, Small Caps have surged more than 7%, while the tech sector has dropped over 4%. Today’s broad market plunge has raised concerns about whether the high levels of the major indexes are justified given the current weak economic environment.
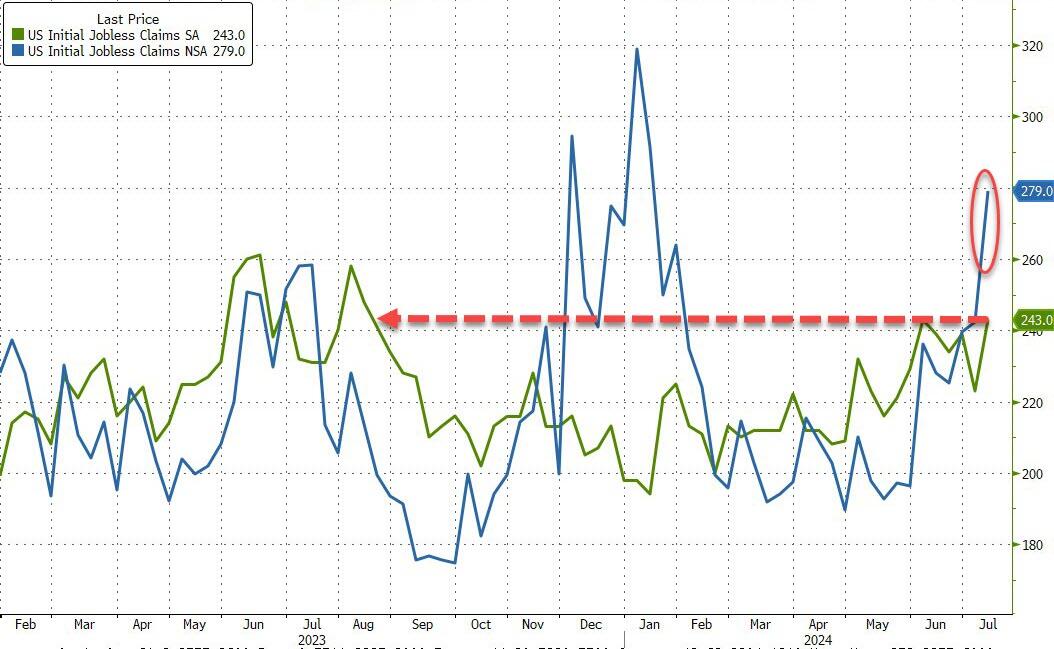
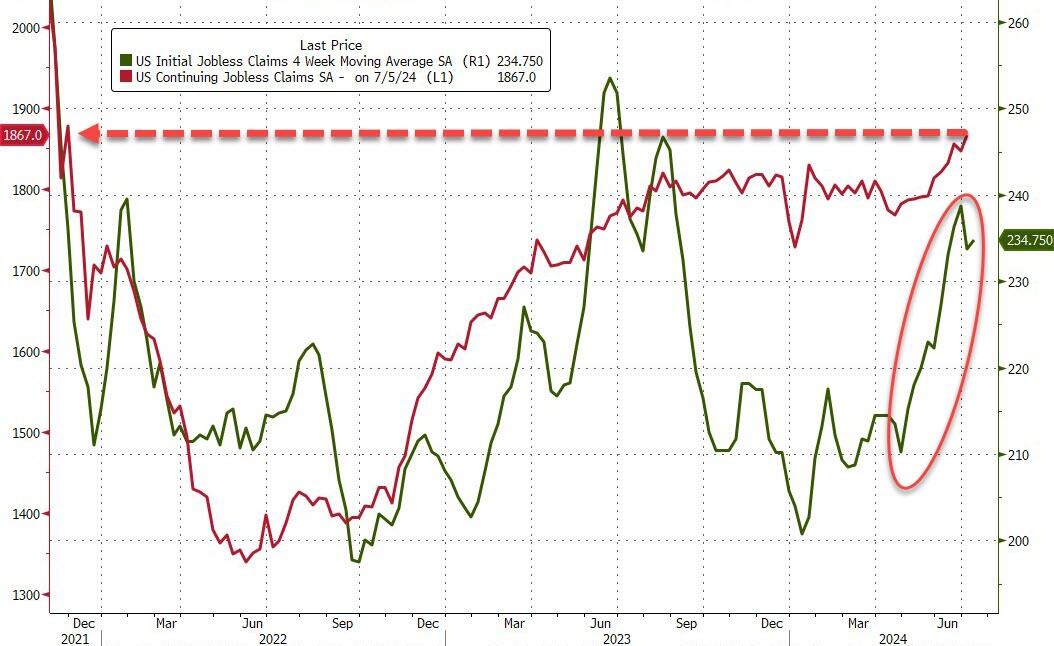
Jobless claims have now rebounded to their highest levels since August 2023, and continuing claims have spiked to levels not seen since November 2021. This is troubling news for American workers, but it remains to be seen if Wall Street will interpret this “bad” news as “good” news for the markets.
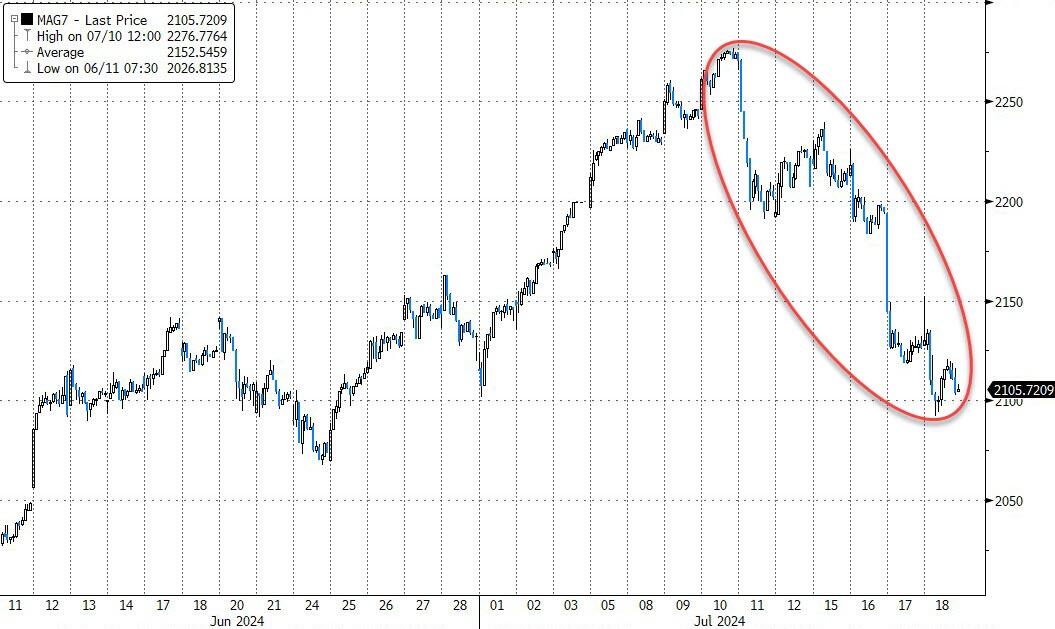
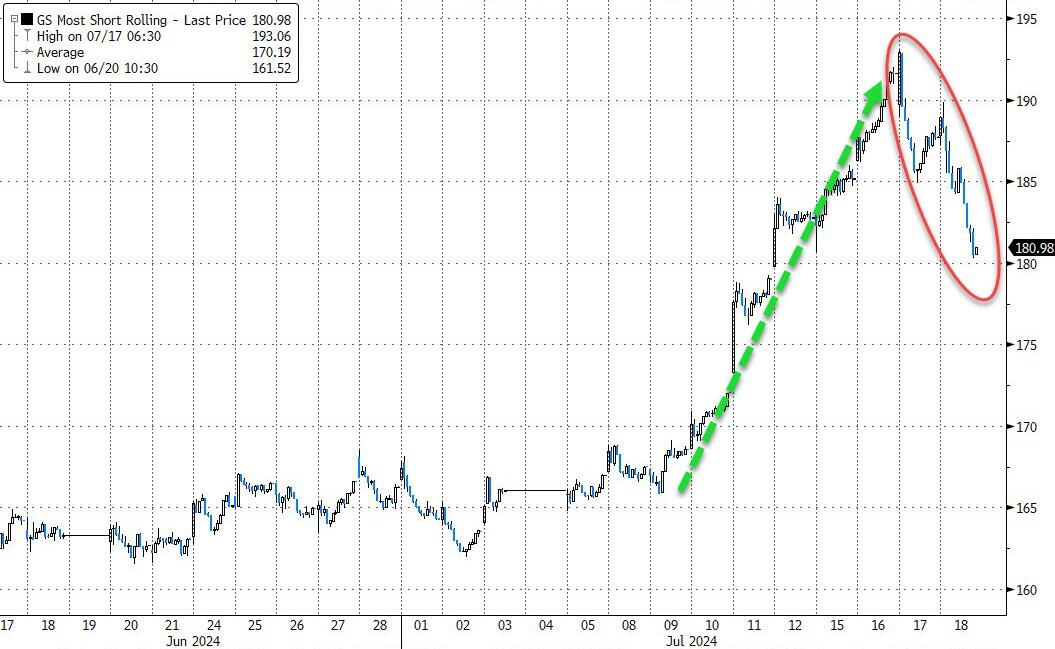
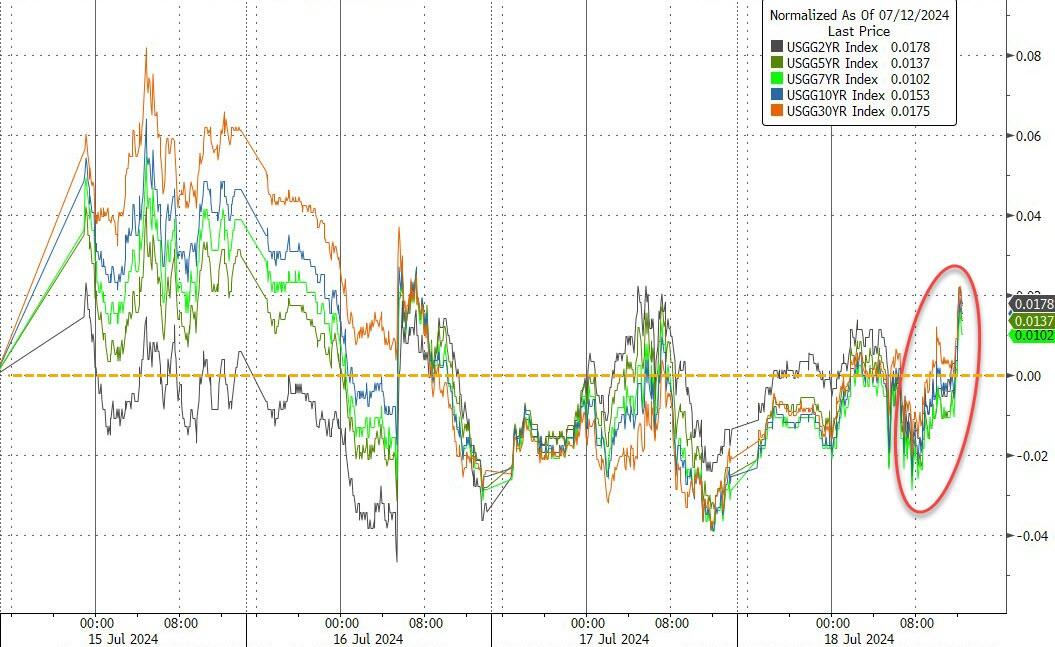
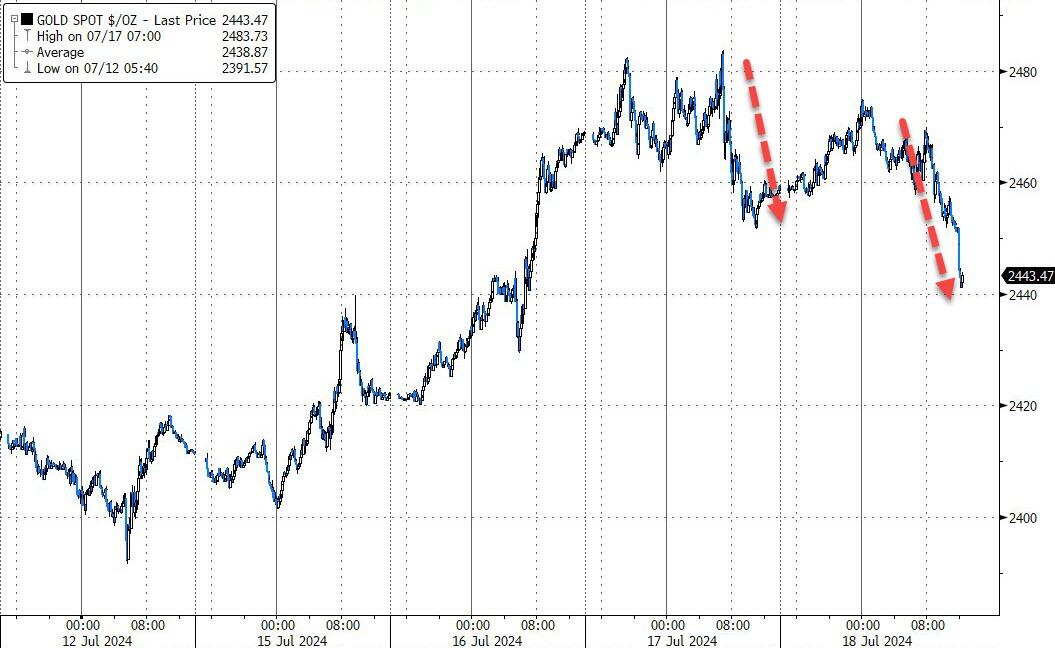
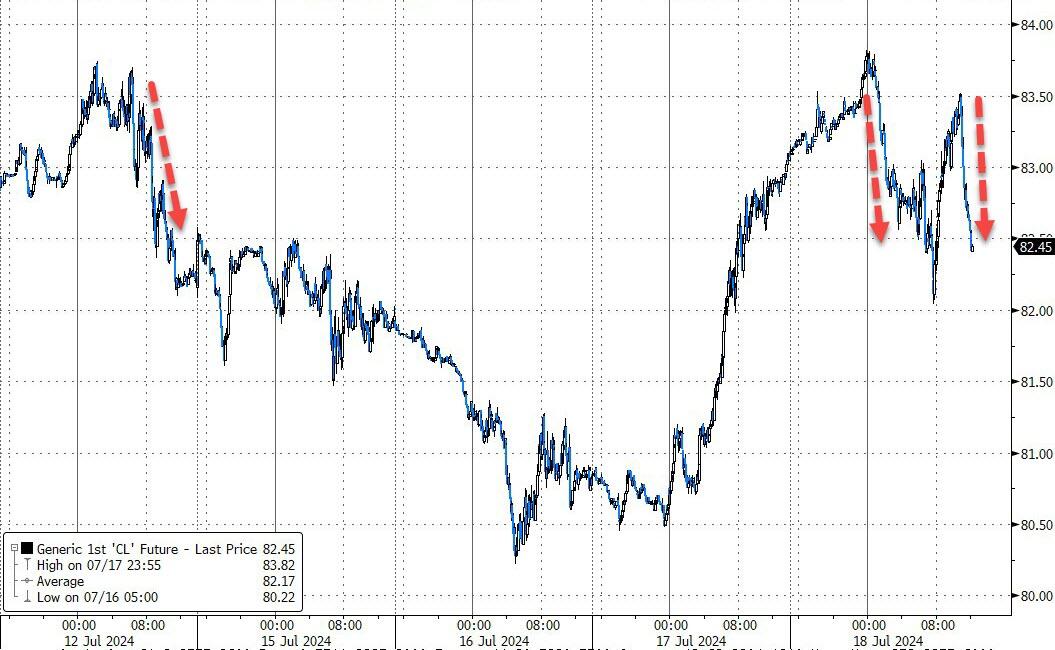
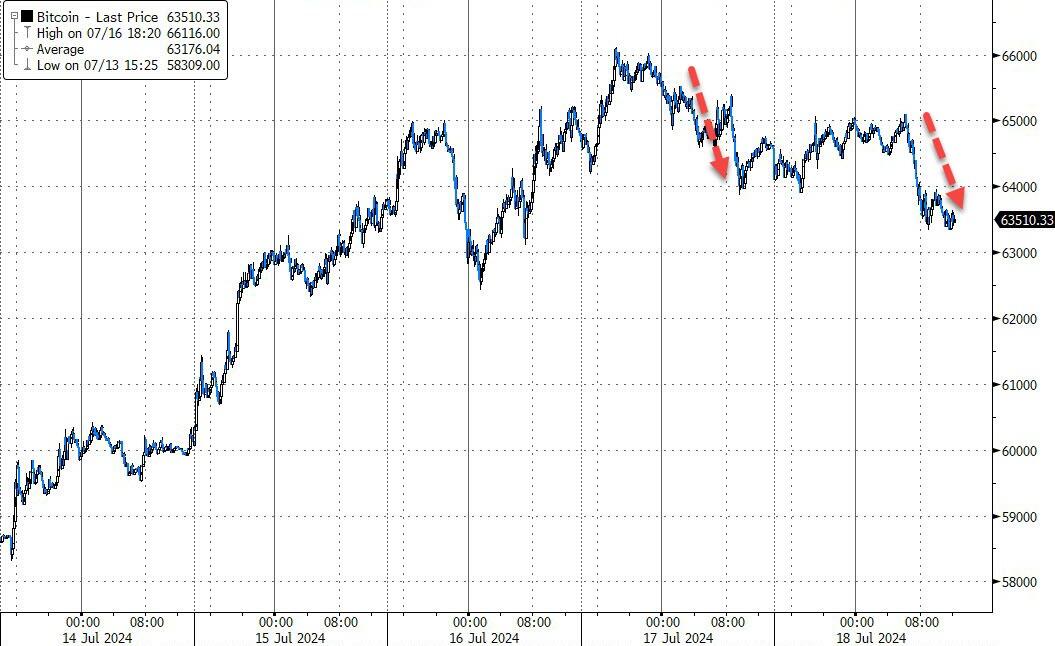
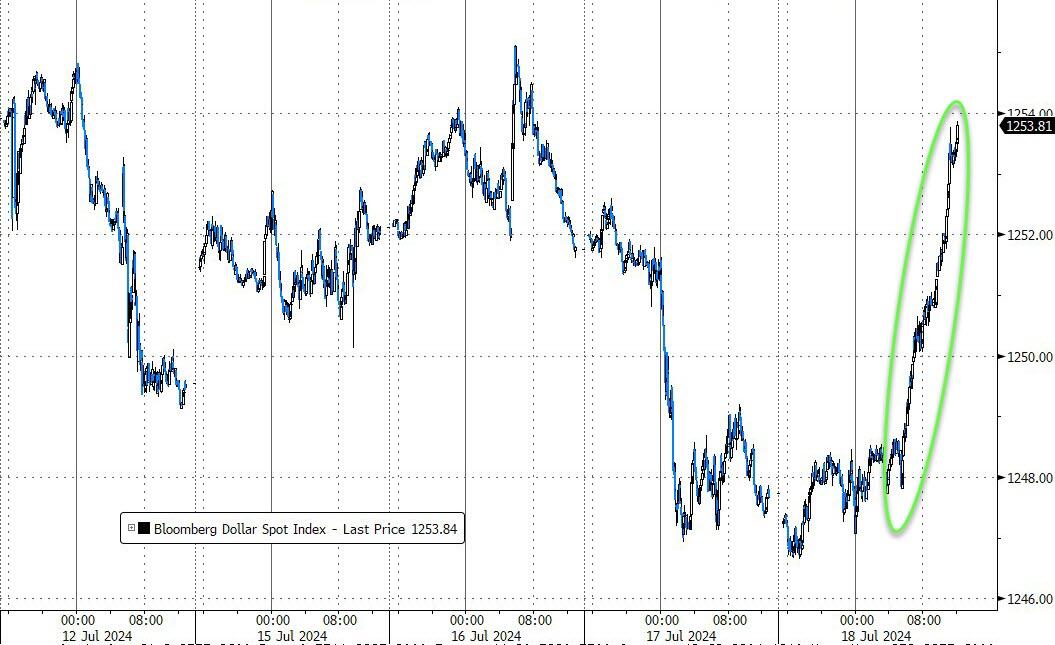
The MAG7 stocks fell to their lowest levels in a month, and the recent short squeeze lost momentum for the second consecutive day. Bond yields edged higher, gold prices declined, crude oil traded erratically, and Bitcoin struggled to gain traction. However, the dollar managed to recover from its recent slump.
Given these developments, I am wondering if current market levels are sustainable, or are we headed for a more significant correction?
2. Current “Buy” Cycles (effective 11/21/2023)
Our Trend Tracking Indexes (TTIs) have both crossed their trend lines with enough strength to trigger new “Buy” signals. That means, Tuesday, 11/21/2023, was the official date for these signals.
If you want to follow our strategy, you should first decide how much you want to invest based on your risk tolerance (percentage of allocation). Then, you should check my Thursday StatSheet and Saturday’s “ETFs on the Cutline” report for suitable ETFs to buy.
3. Trend Tracking Indexes (TTIs)
The stock market experienced a brief early rally before reversing direction and trending downward. By the end of the day, all major indexes were in the red, reflecting a widespread decline across all assets.
Unfortunately, our TTIs were unable to resist this downward momentum and experienced a pullback.
This is how we closed 07/18/2024:
Domestic TTI: +7.69% above its M/A (prior close +8.63%)—Buy signal effective 11/21/2023.
International TTI: +8.03% above its M/A (prior close +8.88%)—Buy signal effective 11/21/2023.
All linked charts above are courtesy of Bloomberg via ZeroHedge.
———————————————————-
WOULD YOU LIKE TO HAVE YOUR INVESTMENTS PROFESSIONALLY MANAGED?
Do you have the time to follow our investment plans yourself? If you are a busy professional who would like to have his portfolio managed using our methodology, please contact me directly to get more details.
Contact Ulli