
- Moving the markets
The much-awaited CPI fell 0.1% last month from May, which reduced the annual inflation rate down to 3%. Expectations were for a monthly increase of 0.1% and annual rate of 3.1%.
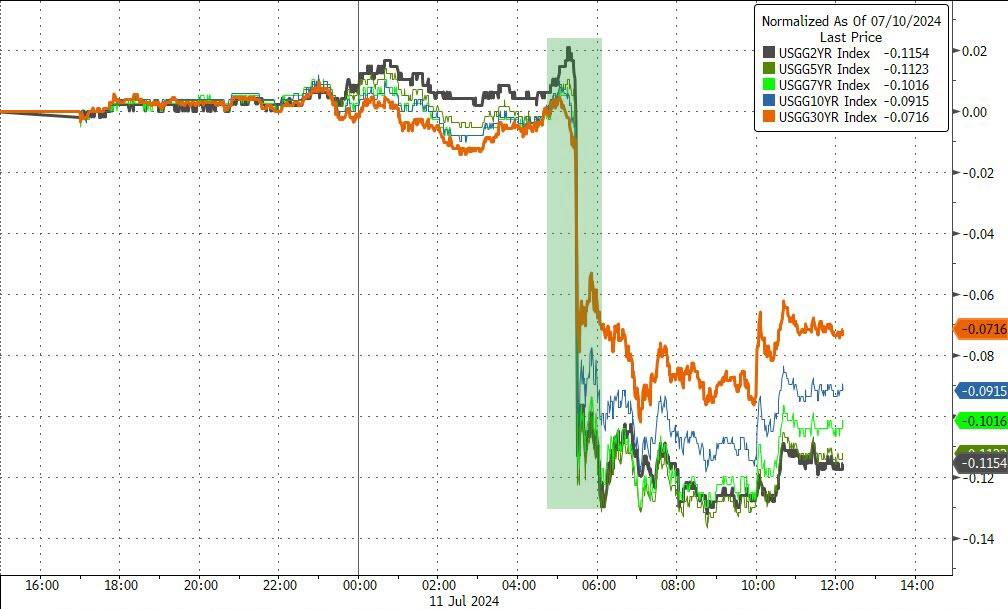
Core CPI, which excludes food and energy, and is the most closely watched number by the Fed, came in at an annual rate of 3.3%, also below expectations. Bond yields took a dive with the 10-year dropping some 8 basis points.
Odds of a September rate cut surged to greater than 80%, but no action by the Fed is expected later this month. Traders’ hopes increased that another potential cut may happen in December, that is if inflation data cooperates.
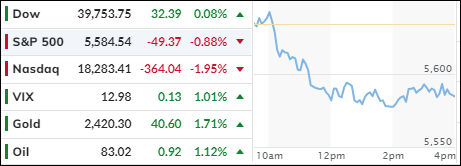
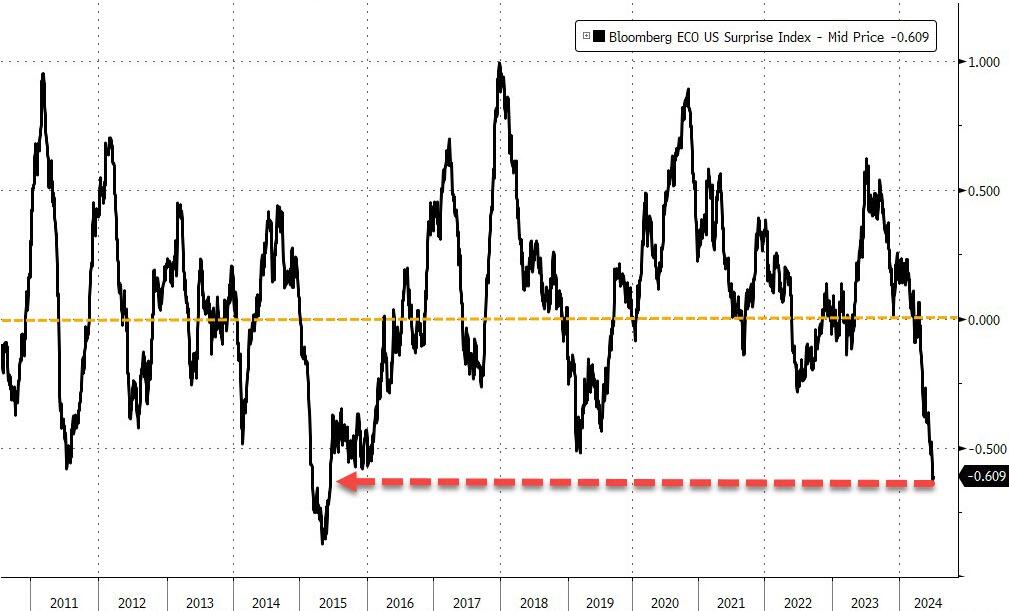
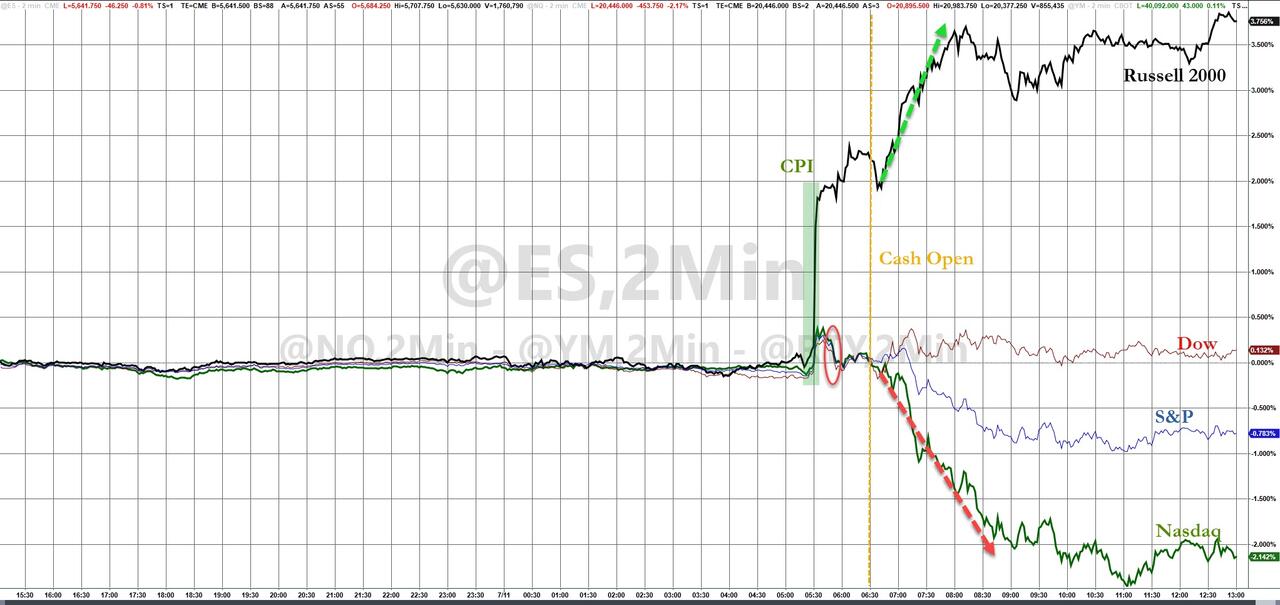
The classic adage “buy the rumor, sell the fact” made its presence known, as the S&P 500 and Nasdaq sold off moderately, while the Dow held on and broke even. With the economy clearly being in tumble mode, this was reflected in the Macro Surprise Data index, which plunged to its lowest since 2015.
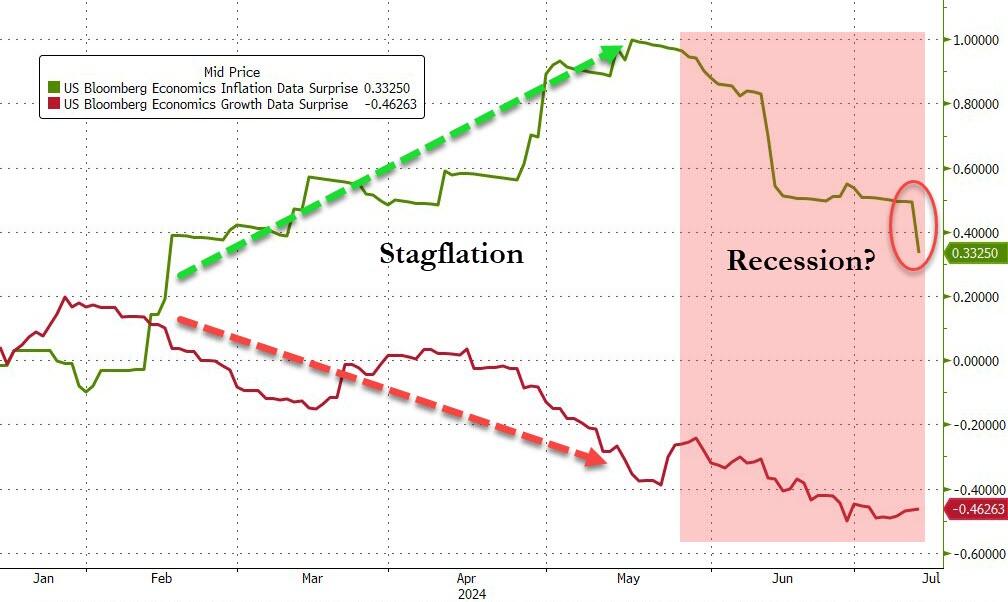
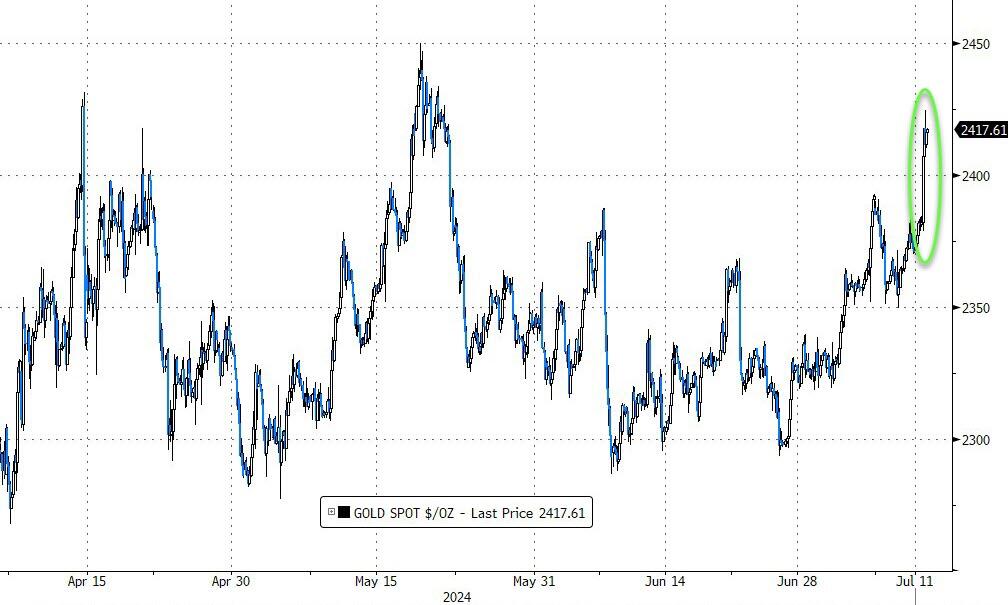
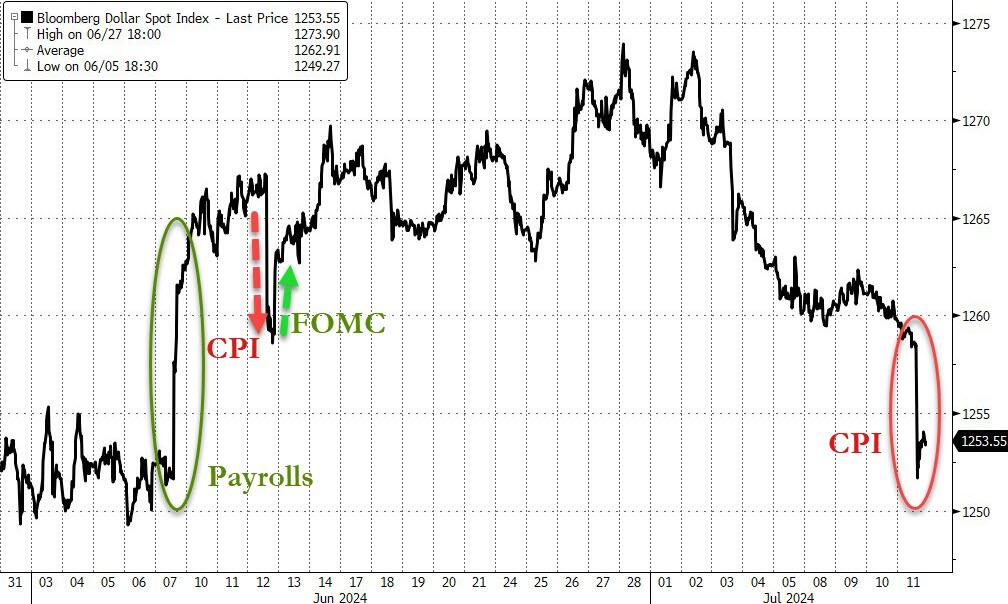
We appear to be moving from stagflation to recession, if this chart, thanks to ZH, is any indication. Gold took advantage of that uncertainty and surged over 1.7% on the session, while bond yields cratered, as the dollar got spanked.
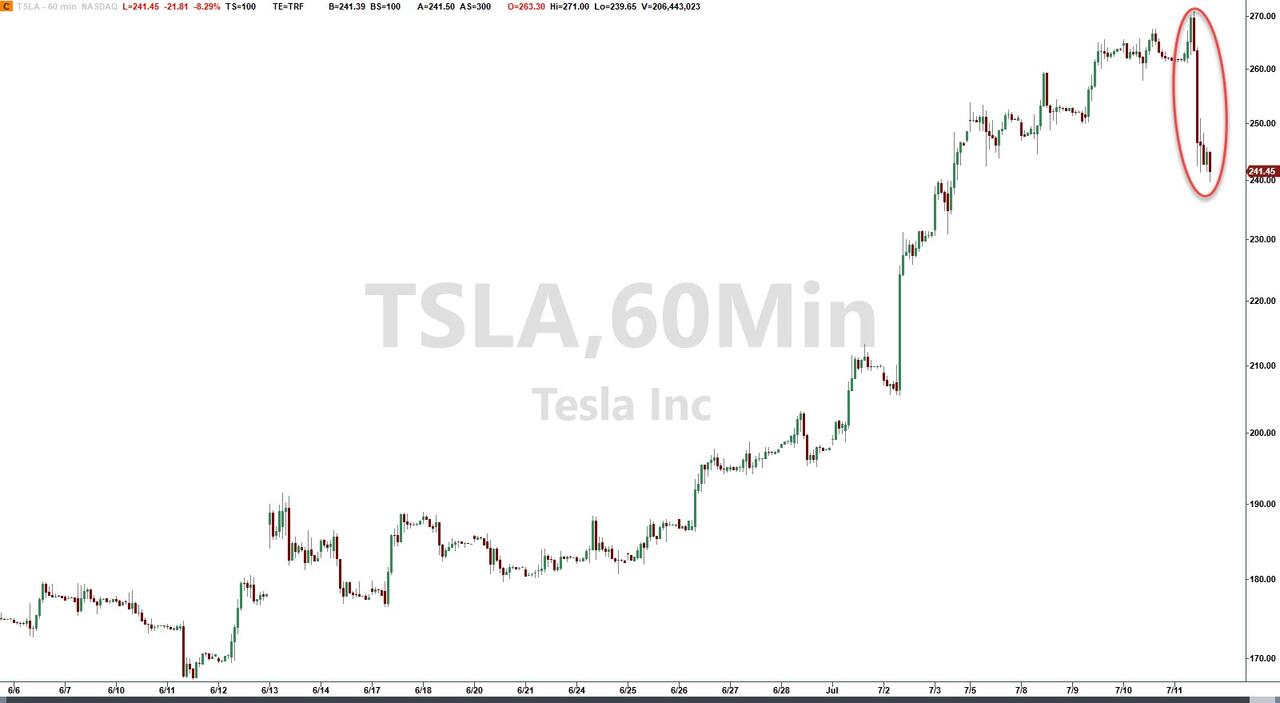
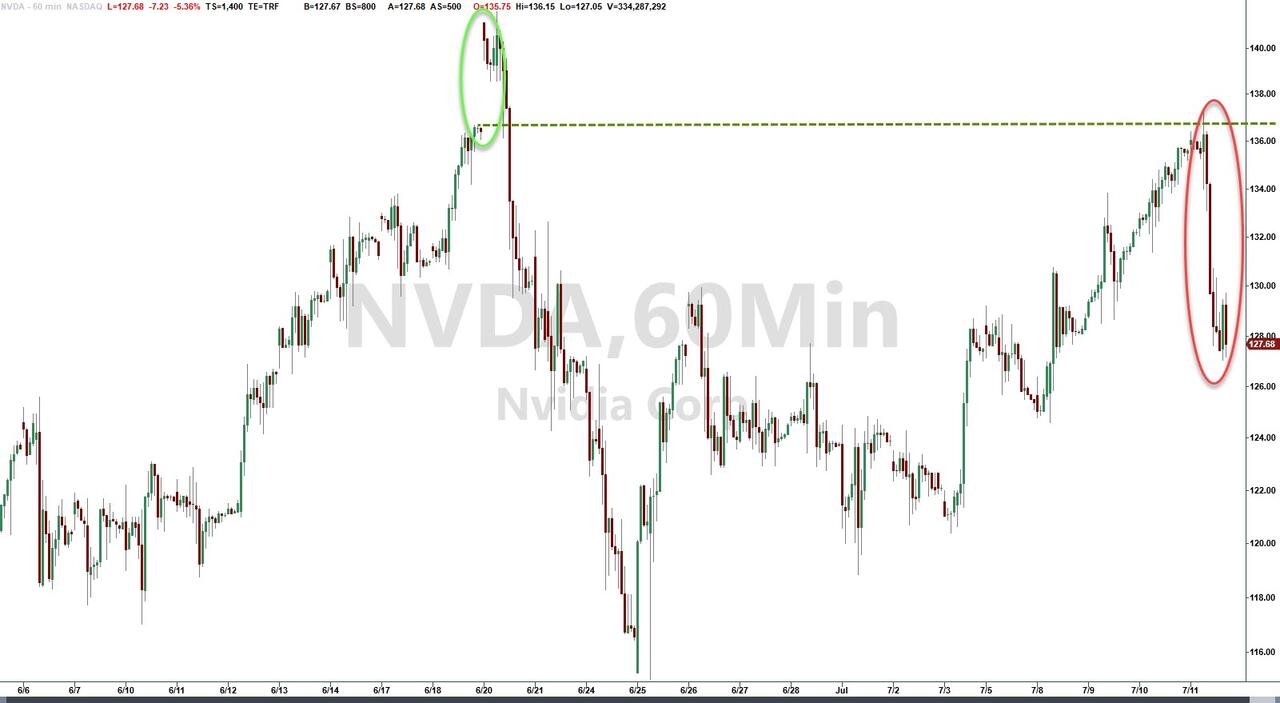
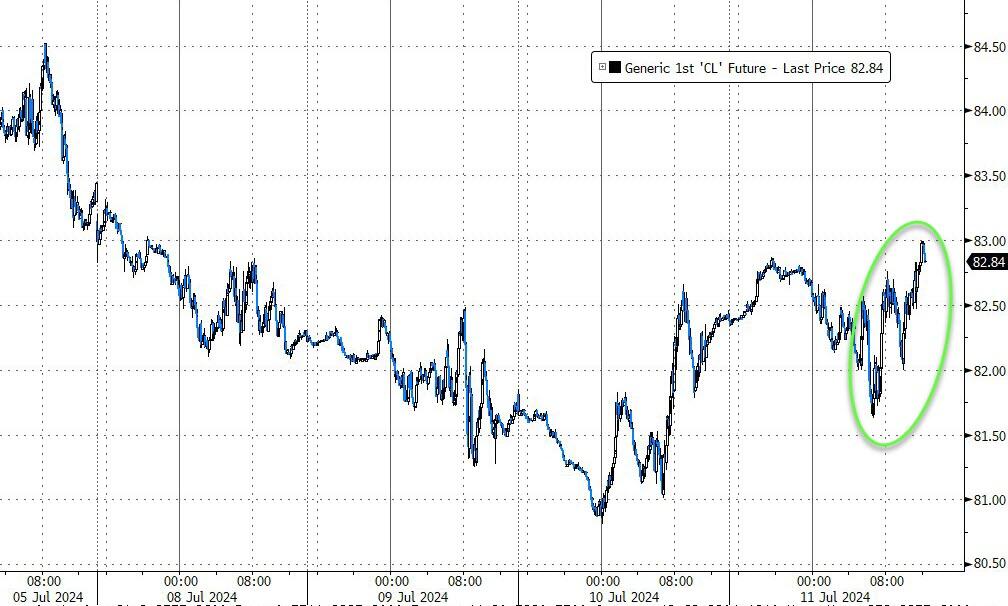
The Nasdaq took the brunt of the beating, but Small Caps found some life and rallied. Tesla tumbled on robotaxi news, and Nvidia pulled back and lost 5%, but crude oil rebounded and climbed back above $83.
With relentless attention being given to a potential rate cut, let me show you one of most scary charts demonstrating what happens, if the Fed indeed makes such a policy change:
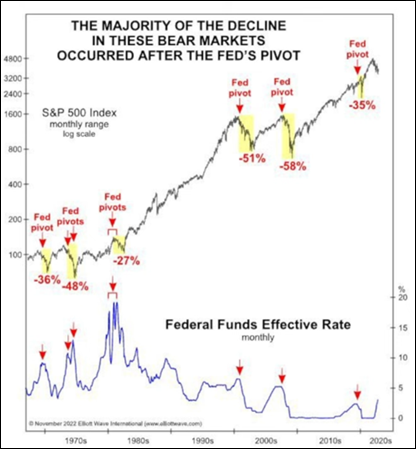
Almost 100% of the time, the markets have gone south in a big way.
Be careful what you wish/hope for, and make sure you have an exit strategy in place, so that you do not become part of history, should it repeat itself.
2. Current “Buy” Cycles (effective 11/21/2023)
Our Trend Tracking Indexes (TTIs) have both crossed their trend lines with enough strength to trigger new “Buy” signals. That means, Tuesday, 11/21/2023, was the official date for these signals.
If you want to follow our strategy, you should first decide how much you want to invest based on your risk tolerance (percentage of allocation). Then, you should check my Thursday StatSheet and Saturday’s “ETFs on the Cutline” report for suitable ETFs to buy.
3. Trend Tracking Indexes (TTIs)
After yesterday’s bounce, the adage “buy the rumor, sell the fact” was applicable today, as the major indexes lost some mojo. Selling pressure was focused predominantly on the tech sector, while the broad market gained.
Our TTIs advanced nicely.
This is how we closed 07/11/2024:
Domestic TTI: +6.64% above its M/A (prior close +5.37%)—Buy signal effective 11/21/2023.
International TTI: +8.33% above its M/A (prior close +7.76%)—Buy signal effective 11/21/2023.
All linked charts above are courtesy of Bloomberg via ZeroHedge.
———————————————————-
WOULD YOU LIKE TO HAVE YOUR INVESTMENTS PROFESSIONALLY MANAGED?
Do you have the time to follow our investment plans yourself? If you are a busy professional who would like to have his portfolio managed using our methodology, please contact me directly to get more details.
Contact Ulli