
- Moving the markets
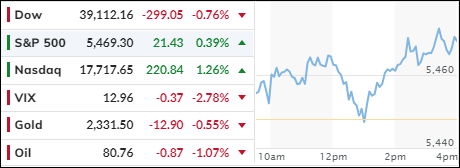
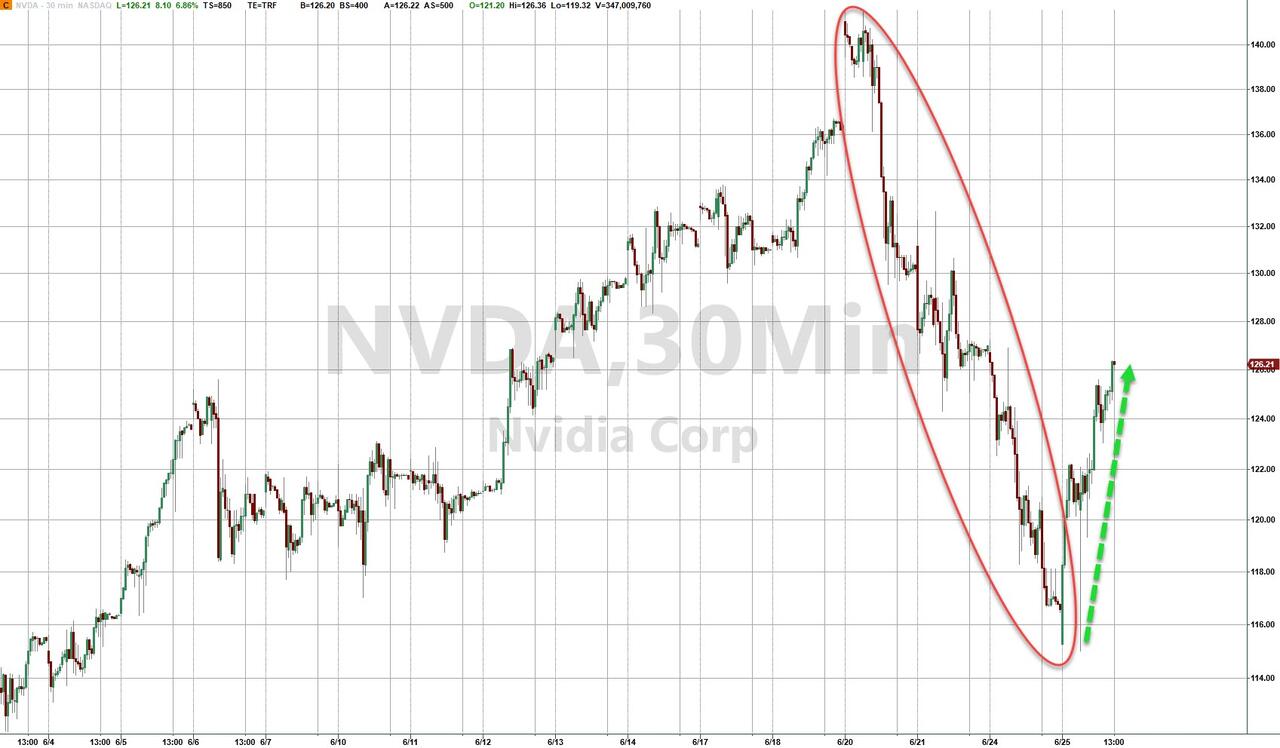
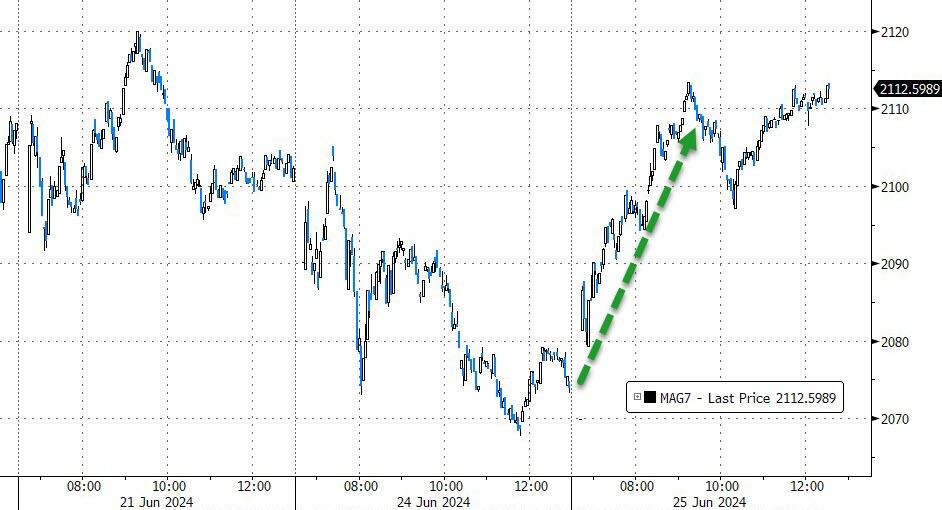
A rebound in the tech sector helped the S&P 500 and Nasdaq to find some footing, with both indexes starting and ending the session on a positive note. Nvidia gave a much-needed assist by bouncing back from its latest slide, as did the MAG 7 stocks.
The recent sell off pushed the AI darling more than 13% off its highs and into correction territory, as other semiconductor stocks also had to deal with sudden pullbacks. The Dow saved the day by maintaining its bullish theme.
So far this type of correction is perfectly normal given the sharp advances during the first half of 2024. Besides, summertime, or specifically Q3, can be slow and typically scores as the worst quarter in any year.
Consumer Confidence is not helping the economic outlook with the index moving down to 100.4, which was a slight drop from May’s reading of 101.3 but exceeded expectations of 100. Still, this index seems to have been stuck in a tight range for the past 2 years.
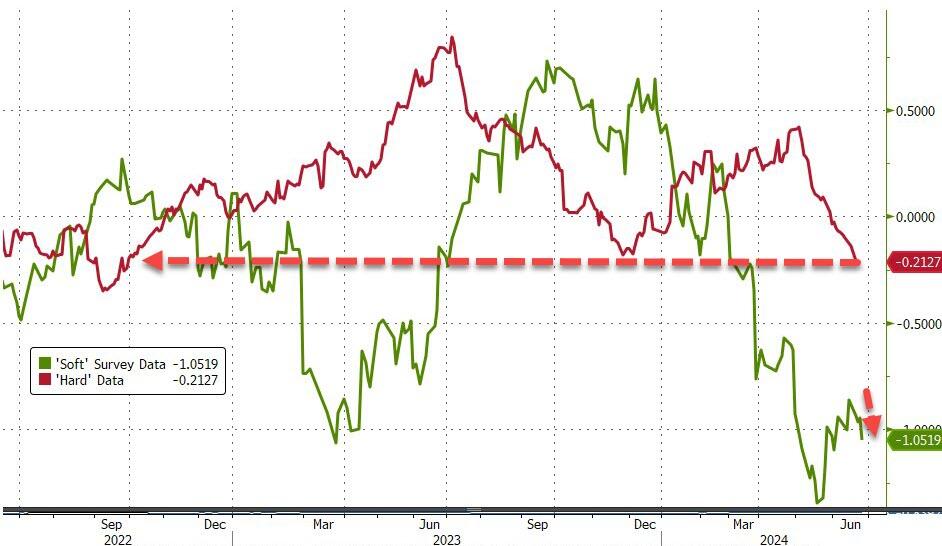
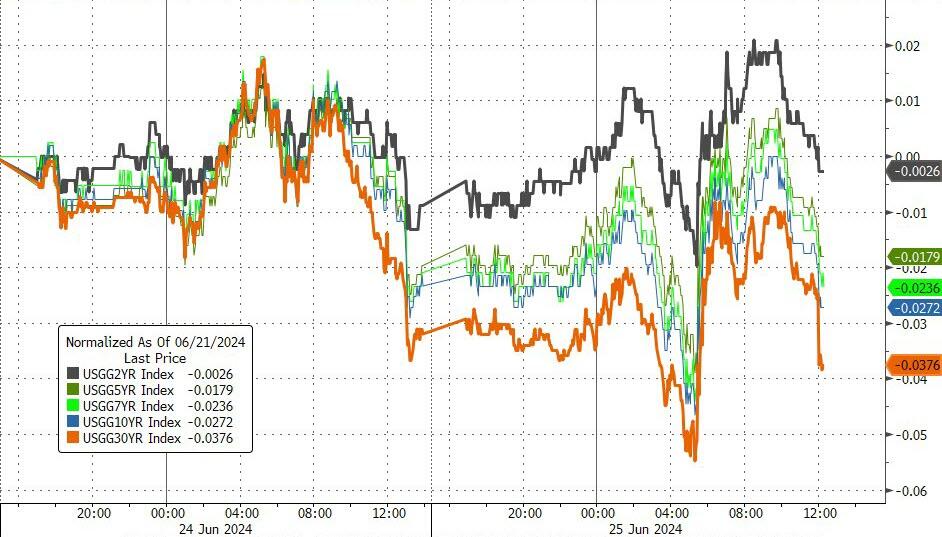
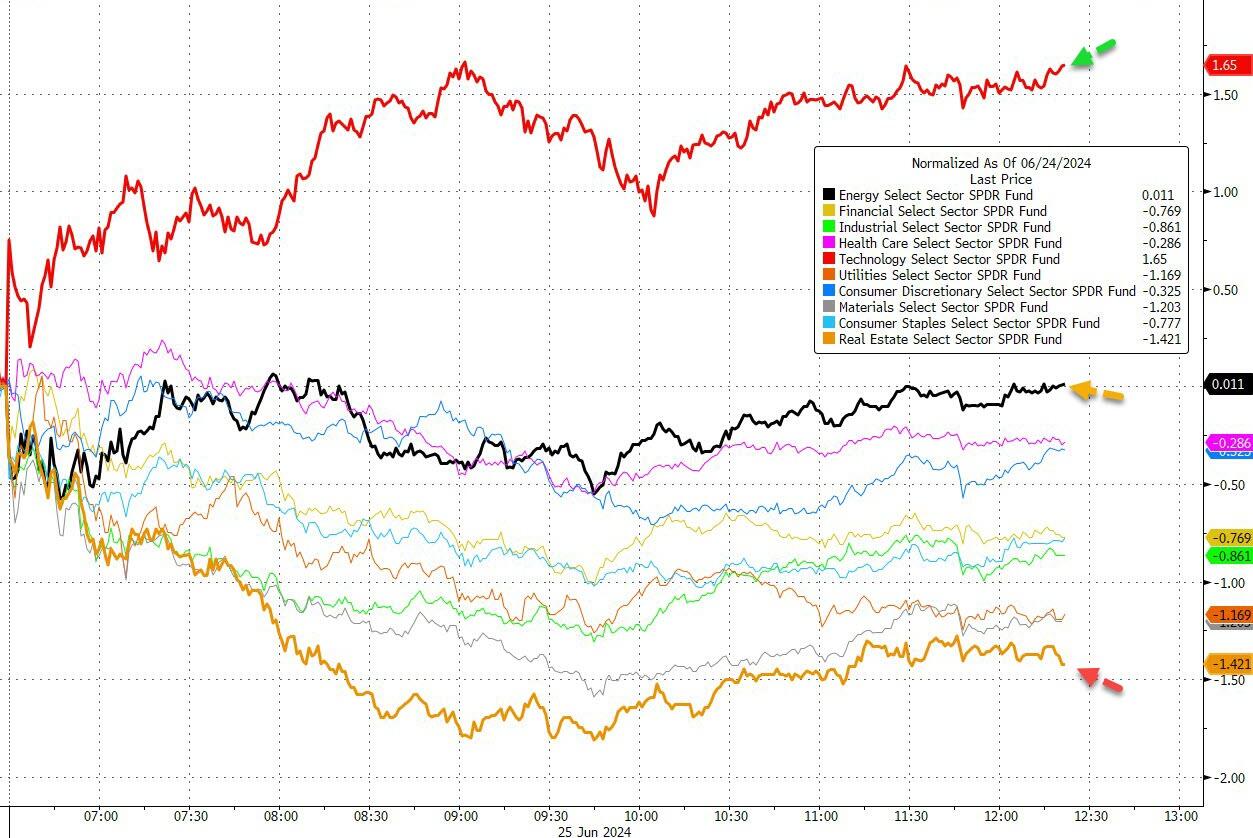
From a Macro point of view, “hard” and “soft” data ended lower, with bonds basically closing unchanged. The majors offered a mixed picture, as the graph above shows. Tech was the lead dog for the day, while energy trod water but all other sectors were in the red.
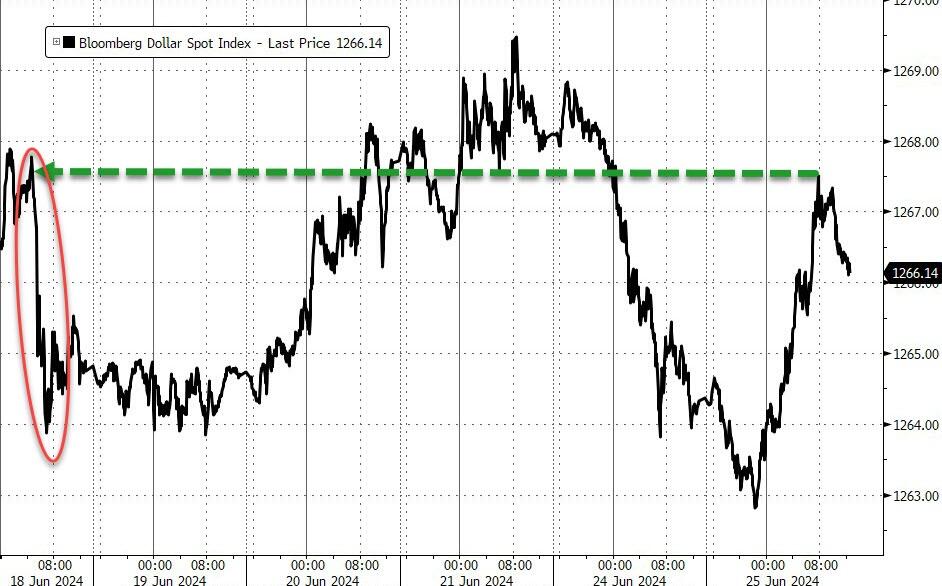
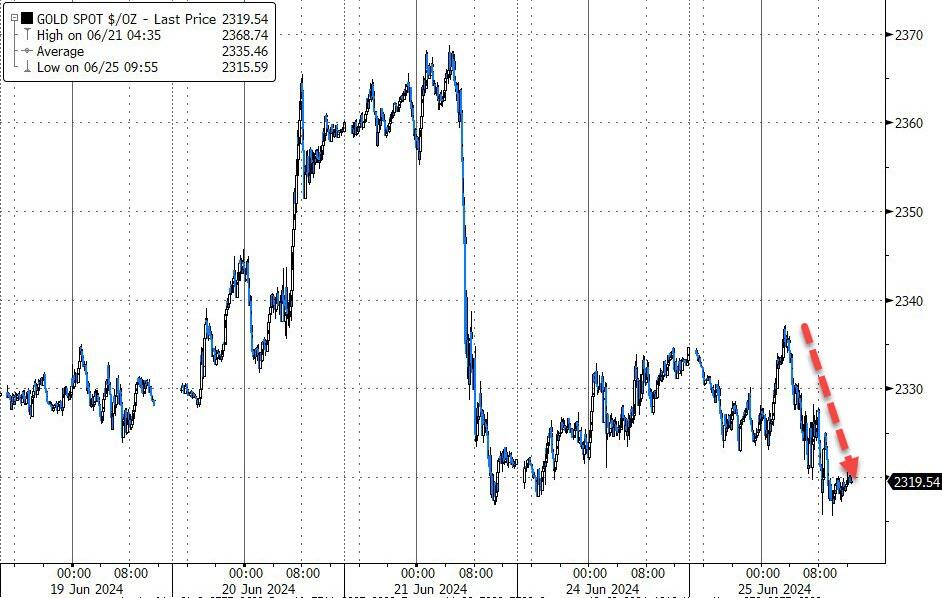
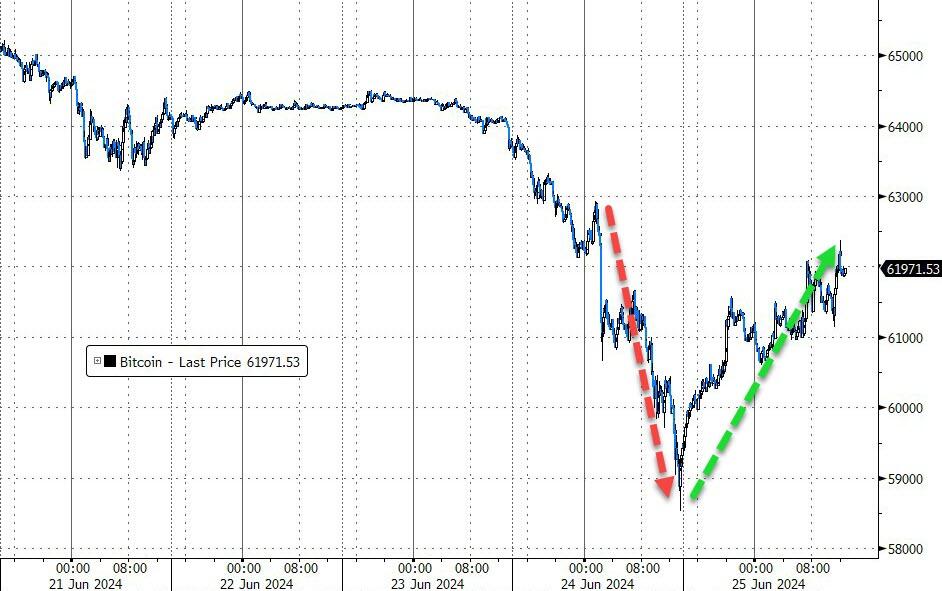
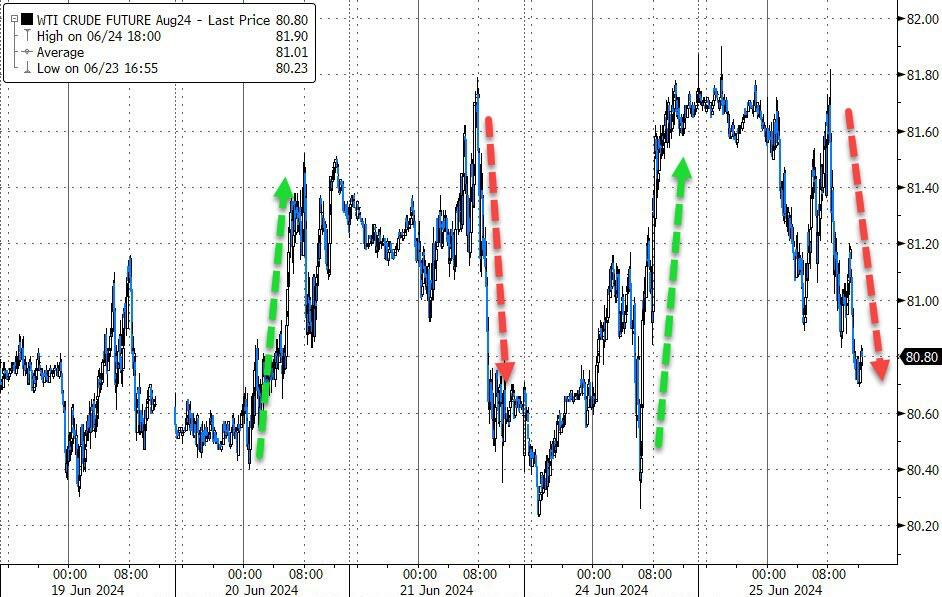
The dollar bounced, gold slipped back to Friday’s lows, but Bitcoin found support and rallied sharply. Crude oil succumbed to profit taking and stumbled back into last week’s trading range.
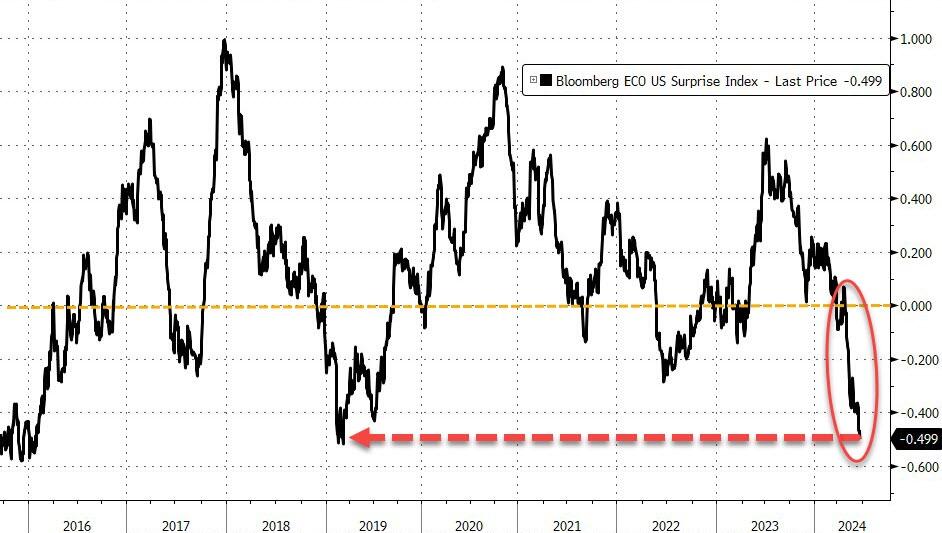
As ZH pointed out, the US Macro Surprise index has now dropped to its lowest level since March 2019.
How does that align with the Fed’s constant jawboning that the economy is doing well?
2. Current “Buy” Cycles (effective 11/21/2023)
Our Trend Tracking Indexes (TTIs) have both crossed their trend lines with enough strength to trigger new “Buy” signals. That means, Tuesday, 11/21/2023, was the official date for these signals.
If you want to follow our strategy, you should first decide how much you want to invest based on your risk tolerance (percentage of allocation). Then, you should check my Thursday StatSheet and Saturday’s “ETFs on the Cutline” report for suitable ETFs to buy.
3. Trend Tracking Indexes (TTIs)
The Nasdaq raced ahead, as the tech sector found some footing, with the S&P 500 following suit. The Dow bucked the trend and closed in the red.
The rally was not broad based, so our TTIs pulled back a tad.
This is how we closed 06/25/2024:
Domestic TTI: +5.49% above its M/A (prior close +6.22%)—Buy signal effective 11/21/2023.
International TTI: +7.03% above its M/A (prior close +7.09%)—Buy signal effective 11/21/2023.
All linked charts above are courtesy of Bloomberg via ZeroHedge.
———————————————————-
WOULD YOU LIKE TO HAVE YOUR INVESTMENTS PROFESSIONALLY MANAGED?
Do you have the time to follow our investment plans yourself? If you are a busy professional who would like to have his portfolio managed using our methodology, please contact me directly to get more details.
Contact Ulli