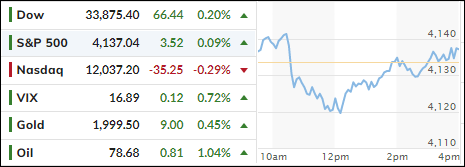
- Moving the markets
In a repeat of last week’s activity, the major indexes spent most of the session vacillating near their respective unchanged lines but managed to slightly close in the green, with the Nasdaq being the exception.
Earnings season, economic data, upcoming Central Bank actions, and geopolitical tensions kept traders and algos on edge causing the indexes again to tread water, as uncertainty reigned supreme. Regarding economic data, manufacturing slumped to post-Covid lows, as the 12th straight month of contraction became a reality.
Data provider FactSet announced that, through this morning, 76% of S&P 500 companies beat sharply reduced earnings estimates, while Refinitiv added that S&P 500 companies overall are projected to decline 5.2% for this past quarter.
The fact that a technical debt default is a real possibility, according to this chart, has been largely ignored by the financial markets, even though this CDS (Credit Default Swap) has now risen to its highest level ever. Go figure…
Mid-April’s short squeeze has lost its upward momentum, and the “most shorted” stocks are now acting like they are supposed to, namely drift lower.
Bond yields retreated from Friday’s high, but May’s rate-hike odds moved higher and are now signaling a 92% chance of a 0.25% hike next week.
The US Dollar weakened after an early bounce and closed at 4-day lows. That helped gold to rebound, but it was not enough for the precious metal to crack its $2k level.
Observing this directionless behavior over the past week, I am wondering if the next breakout will be to the downside, which appears to be the path of least resistance.
2. “Buy” Cycle Suggestions
For the current Buy cycle, which started on 12/1/2022, I suggested you reference my then current StatSheet for ETF selections. However, if you came on board later, you may want to look at the most recent version, which is published and posted every Thursday at 6:30 pm PST.
I also recommend you consider your risk tolerance when making your selections by dropping down more towards the middle of the M-Index rankings, should you tend to be more risk adverse. Likewise, a partial initial exposure to the markets, say 33% to start with, will reduce your risk in case of a sudden directional turnaround.
We are living in times of great uncertainty, with economic fundamentals steadily deteriorating, which will eventually affect earnings negatively and, by association, stock prices.
In my advisor’s practice, we are therefore looking for limited exposure in value, some growth and dividend ETFs. Of course, gold has been a core holding for a long time.
With all investments, I recommend the use of a trailing sell stop in the range of 8-12% to limit your downside risk.
3. Trend Tracking Indexes (TTIs)
Our TTIs barely moved, as the sideway pattern continued.
This is how we closed 04/24/2023:
Domestic TTI: +2.21% above its M/A (prior close +2.02%)—Buy signal effective 12/1/2022.
International TTI: +7.79% above its M/A (prior close +7.64%)—Buy signal effective 12/1/2022.
All linked charts above are courtesy of Bloomberg via ZeroHedge.
Contact Ulli