
- Moving the markets
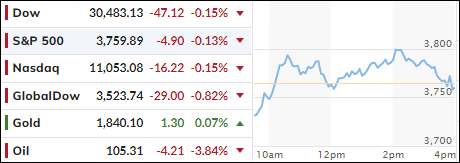
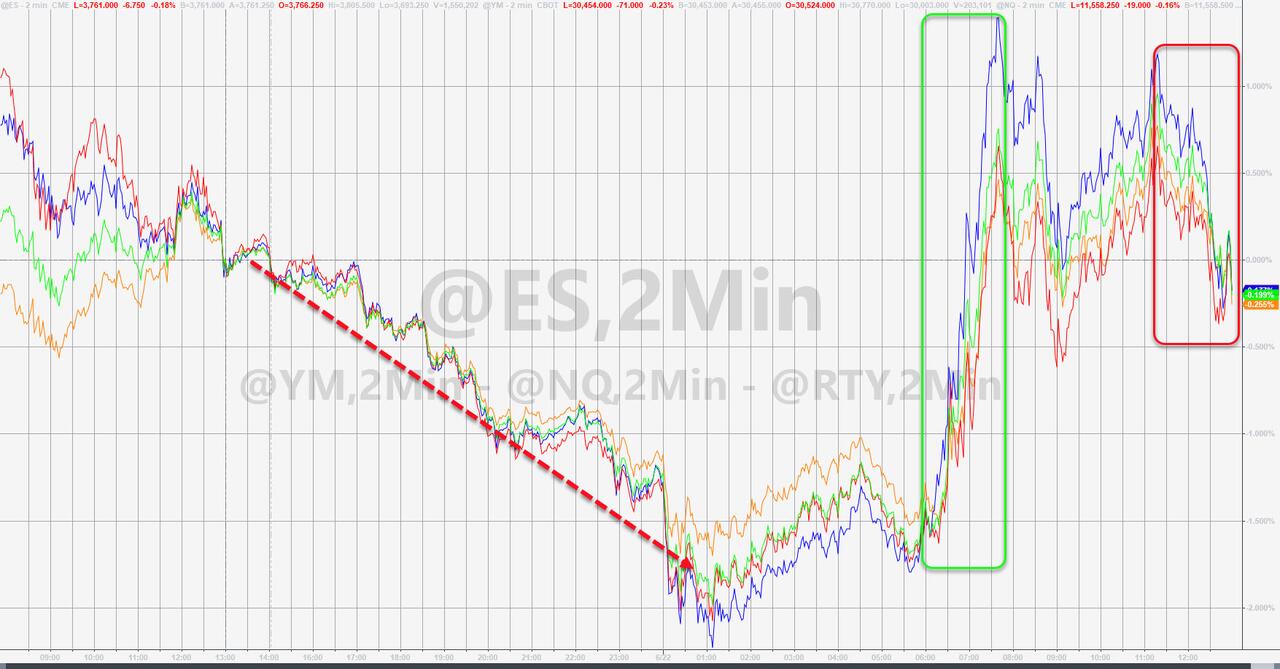
Bullish attempts to keep yesterday’s comeback alive ended up failing, as the major indexes surrendered early gains and ended up the hugging their respective unchanged lines with not much to show for.
Initially, stocks had blasted higher, despite weakness in the futures markets. For a while, it looked like we were facing another “bad news is good news” scenario, as Fed President Harker opined that the “US economy might see a modest contraction in growth,” along with “we could have a couple of negative quarters.”
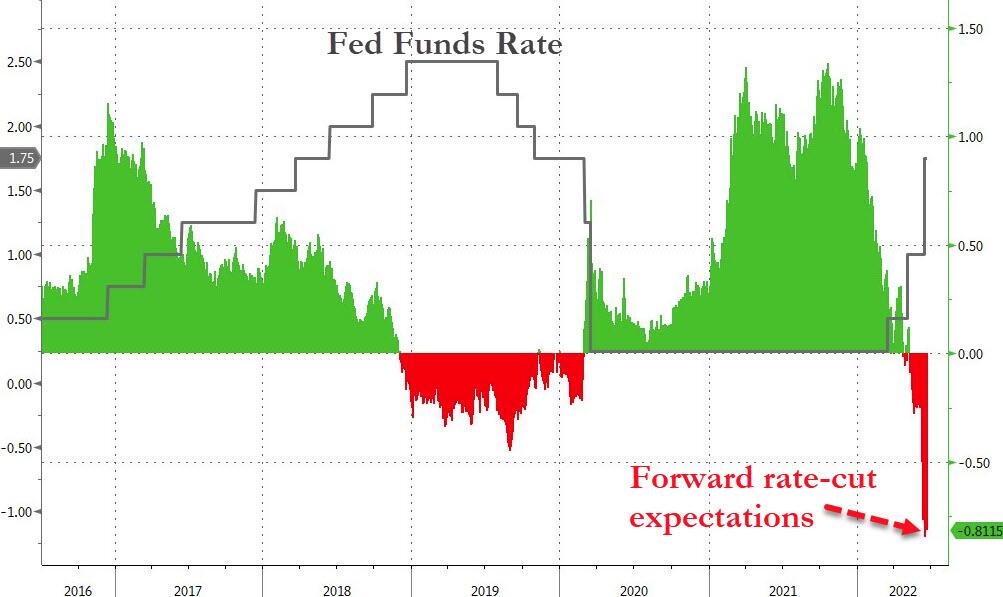
This negative talk was immediately translated as being a positive for the markets, as it would move the recession into the more immediate future, which would then result into inevitable rate cuts and a new QE program. That “should” translate into a revival of the bull market, or so the theory goes.
Regarding inflation, the Fed is way behind the curve and needs to implement a far more aggressive tightening cycle. Analyst Simon Ree tweeted this amazing stat:
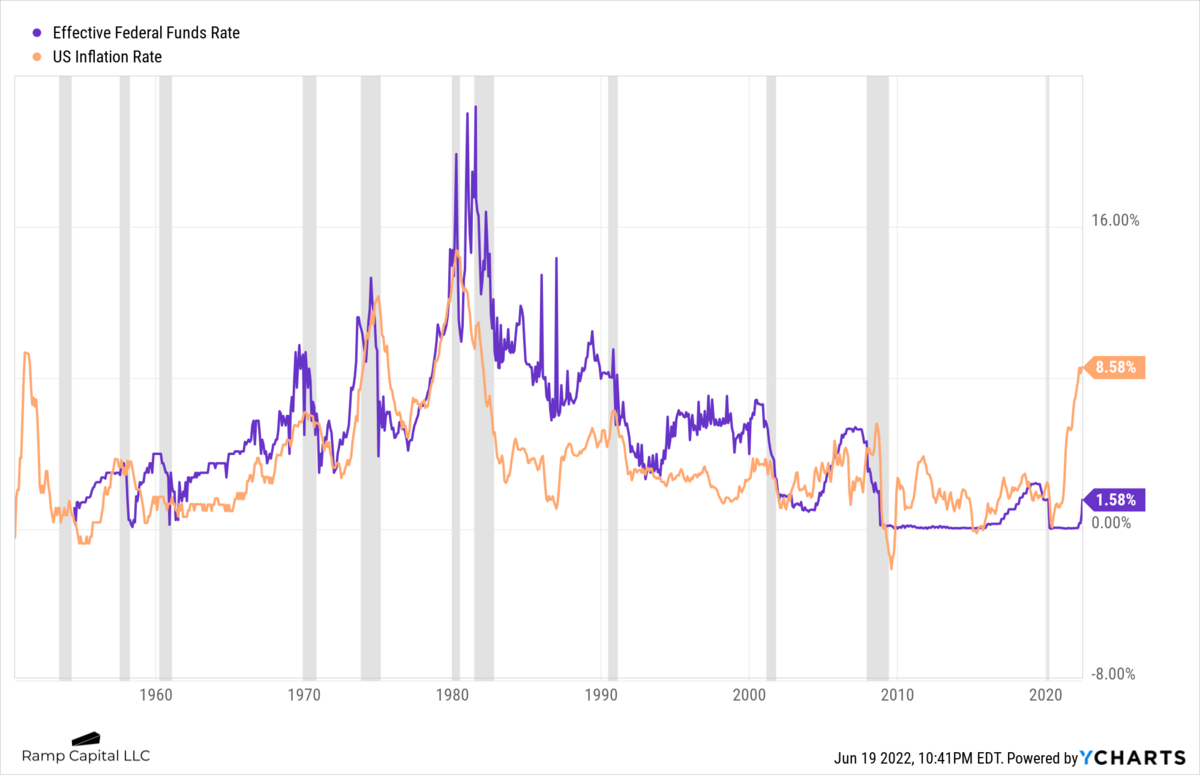
Once inflation goes above 5%, it has never come back down without the Fed Funds rate exceeding the CPI.
As ZH explained, the problem is that the current CPI is 8.58% and the Fed Funds rate is only 1.58%. Graphically, it looks like this. That means the Fed would need to hike at least 7% until inflation would start to roll over and potentially allow for the so-called soft landing. Good luck with that…
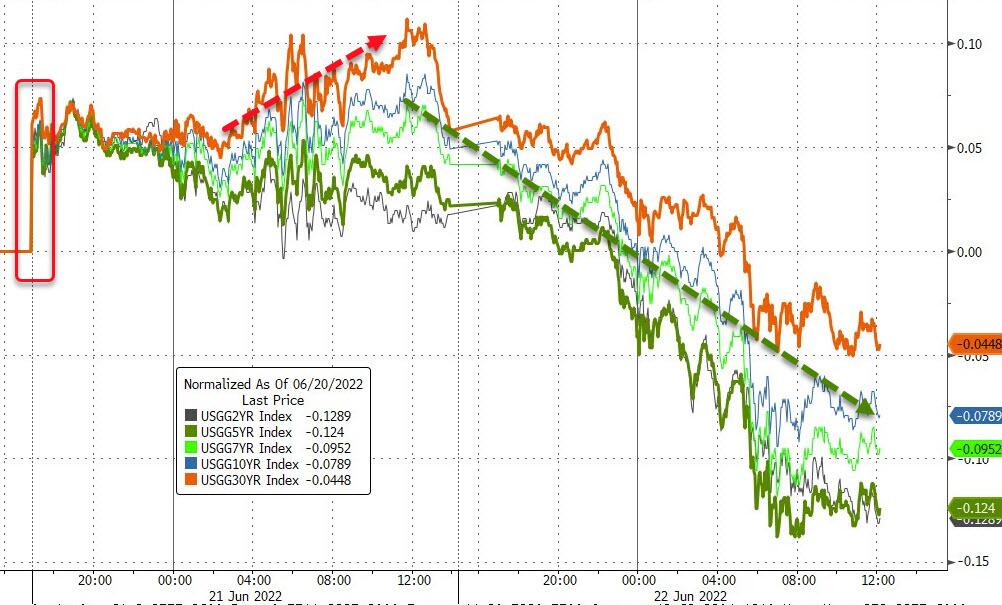
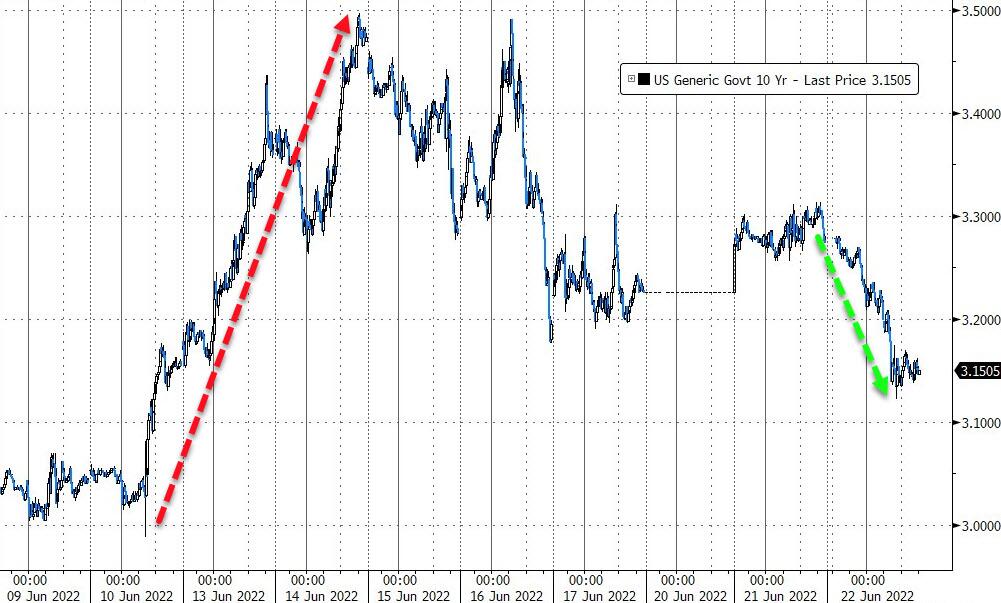
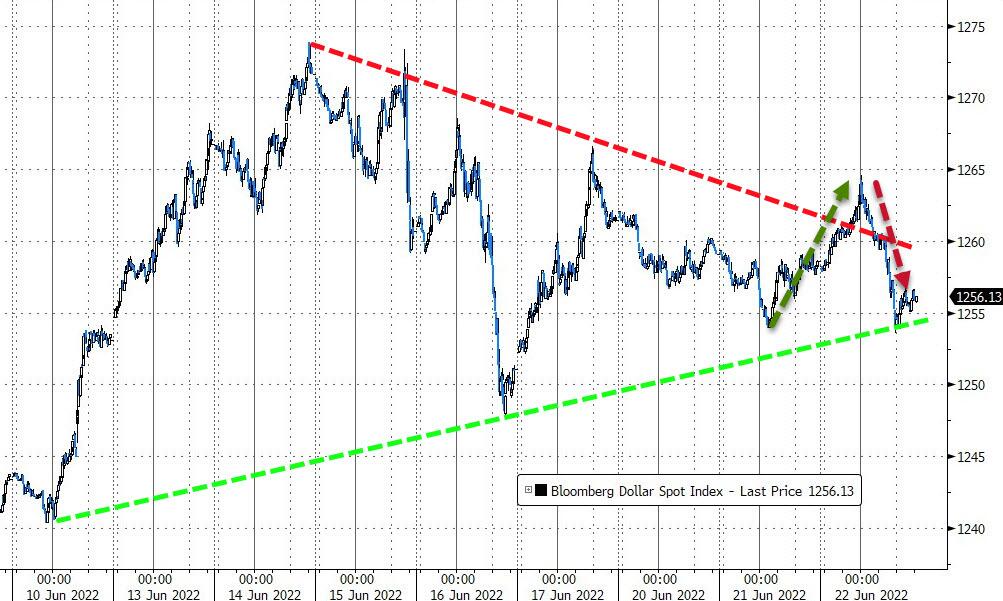
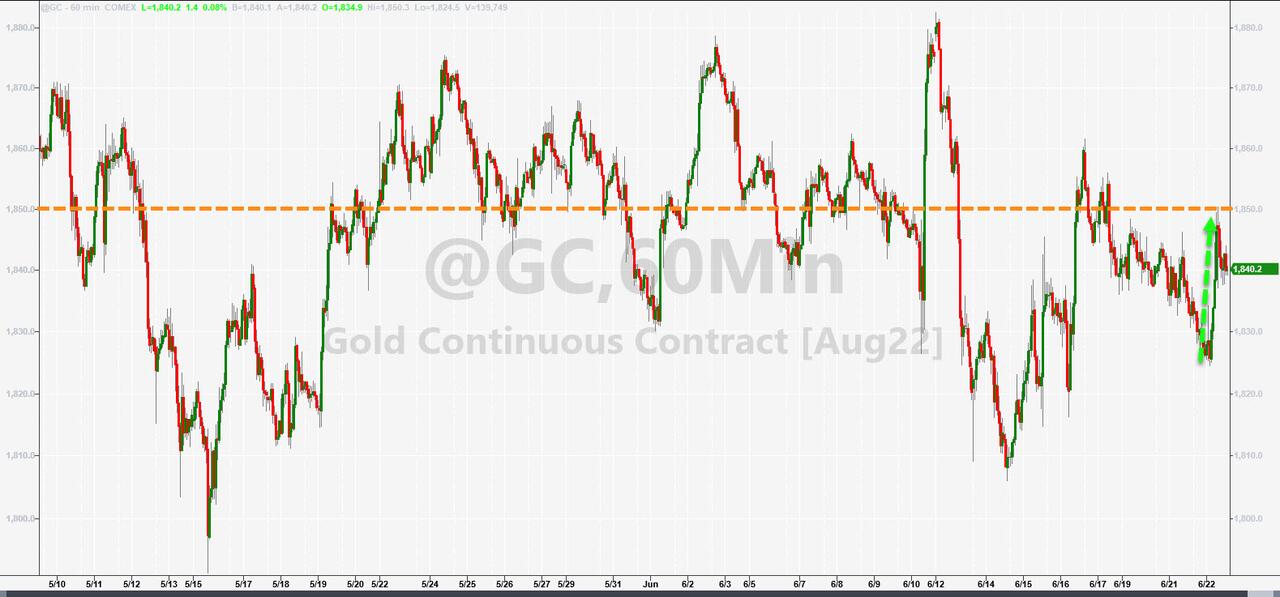
Despite falling bond yields, equities could not sustain any upward momentum. The 10-year plunged 12 bps to close at 3.16%. The US Dollar dumped after yesterday’s pump, while gold meandered aimlessly but closed a tad in the green.
Sure, we could see another short squeeze into the end of this quarter, but in my mind, its duration will be questionable.
2. ETFs in the Spotlight
In case you missed the announcement and description of this section, you can read it here again.
It features some of the 10 broadly diversified domestic and sector ETFs from my HighVolume list as posted every Saturday. Furthermore, they are screened for the lowest MaxDD% number meaning they have been showing better resistance to temporary sell offs than all others over the past year.
The below table simply demonstrates the magnitude with which these ETFs are fluctuating above or below their respective individual trend lines (%+/-M/A). A break below, represented by a negative number, shows weakness, while a break above, represented by a positive percentage, shows strength.
For hundreds of ETF choices, be sure to reference Thursday’s StatSheet.
For this closed-out domestic “Buy” cycle (2/24/2022), here’s how some of our candidates have fared:
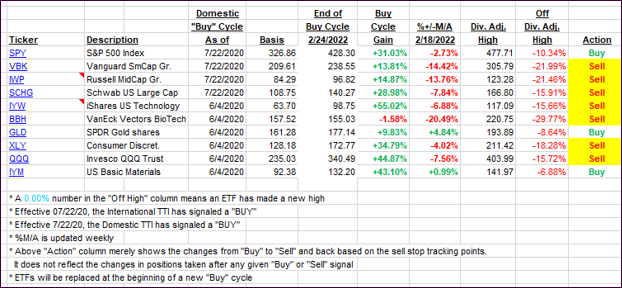
Click image to enlarge.
Again, the %+/-M/A column above shows the position of the various ETFs in relation to their respective long-term trend lines, while the trailing sell stops are being tracked in the “Off High” column. The “Action” column will signal a “Sell” once the -12% point has been taken out in the “Off High” column, which has replaced the prior -8% to -10% limits.
3. Trend Tracking Indexes (TTIs)
Our TTIs barely changed, as the tug-of-war between bulls and bears did not produce a clear winner.
This is how we closed 06/22/2022:
Domestic TTI: -13.55% below its M/A (prior close -13.50%)—Sell signal effective 02/24/2022.
International TTI: -12.17% below its M/A (prior close -11.55%)—Sell signal effective 03/08/2022.
Disclosure: I am obliged to inform you that I, as well as my advisory clients, own some of the ETFs listed in the above table. Furthermore, they do not represent a specific investment recommendation for you, they merely show which ETFs from the universe I track are falling within the specified guidelines.
All linked charts above are courtesy of Bloomberg via ZeroHedge.
Contact Ulli