
- Moving the markets
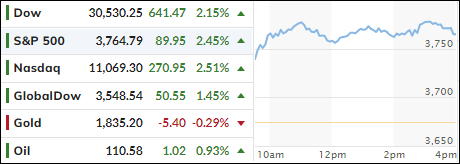
It comes as no surprise that the major indexes would eventually manage a bounce back from the brutal losses not only YTD but also from last week, which saw the S&P 500 surrender -5.8%—its worst 5-day stretch since 2020.
A more aggressive stance on interest rate hikes by the Fed, and increasing odds of a recession, combined forces to give the bears the upper hand. Considering the ever-worsening economic numbers, any rebound may be short-lived, but opinions also abound that the sell off was way overdone.
For sure, rebounds or rallies into the end of any quarter occur with great regularity, which means we’ll have to wait till July to get a better handle on whether this is simply a dead-cat-bounce or a true bottom. I believe it’s the former and not the latter.
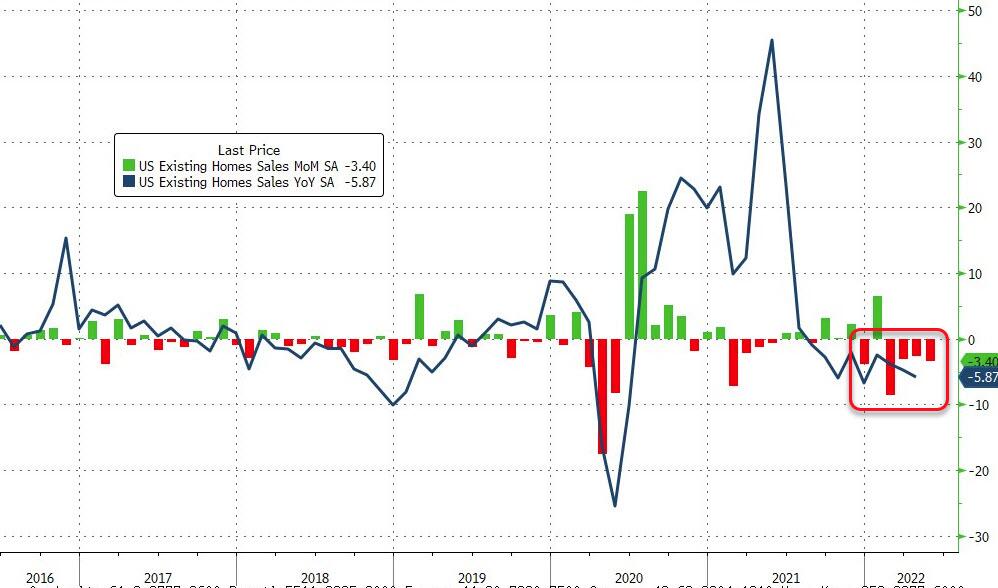
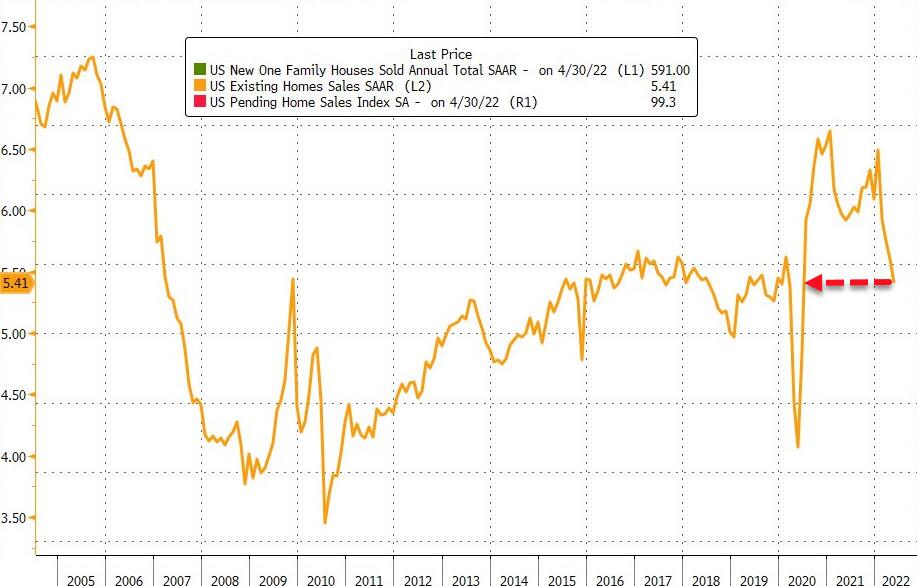
Looking at economic numbers, you must wonder what drove today’s rally. Existing Home Sales tumbled to a 2-year low, according to ZeroHedge, with the NAR warning that “worse is to come.”
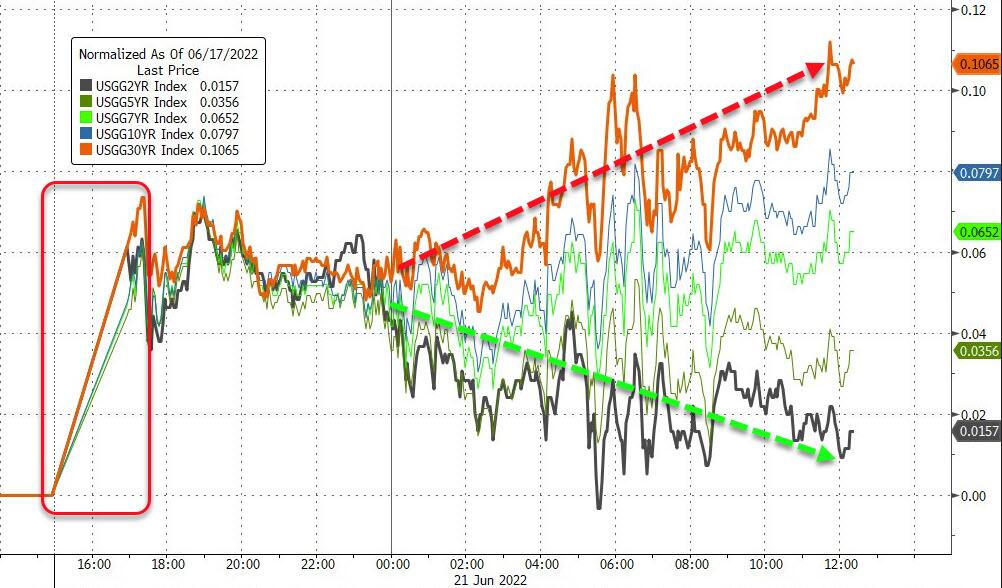
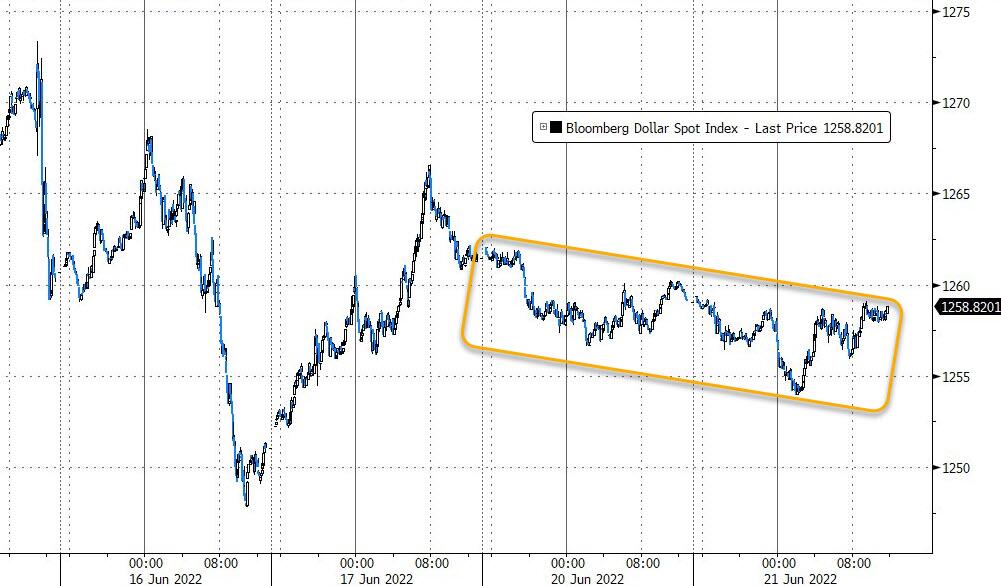
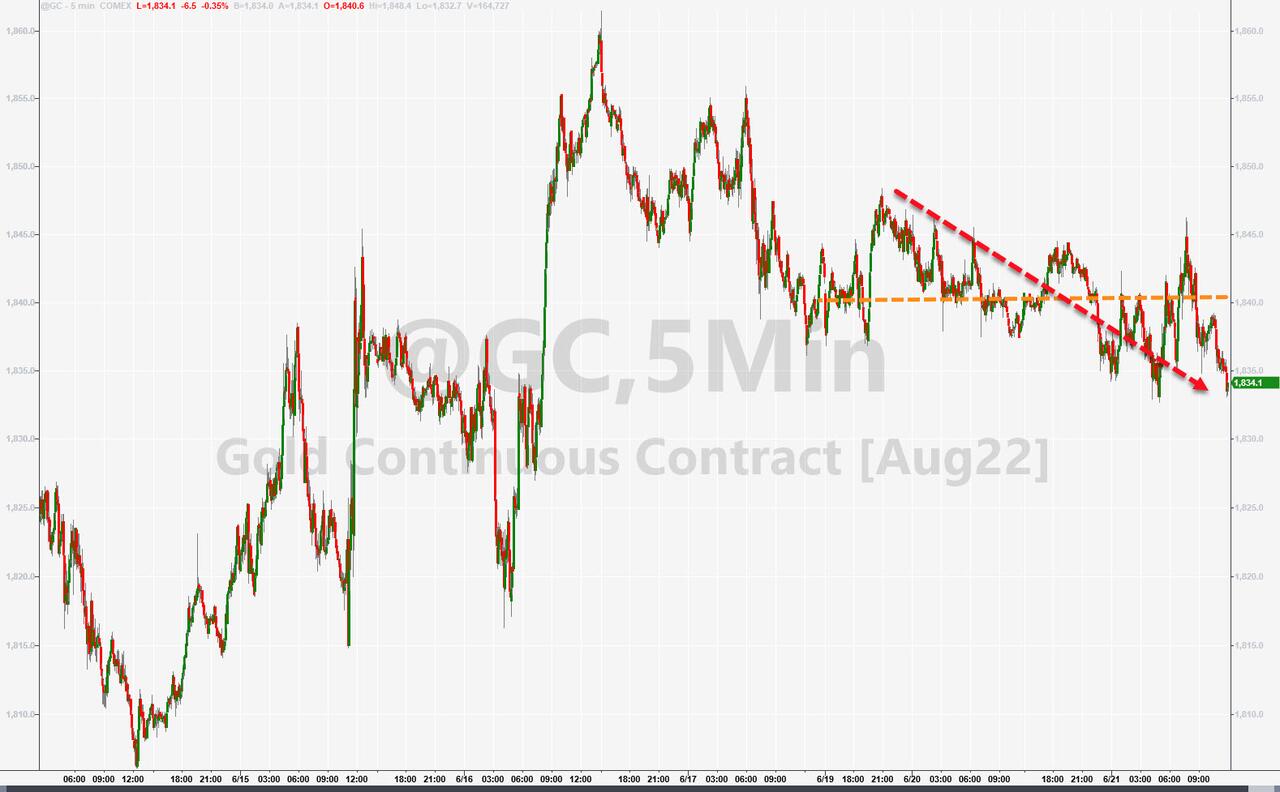
Adding to that negativity was a deteriorating Chicago’s National Activity index. As a result, we can see that the Economic Surprise index keeps worsening. Bond yields were mixed with the 10-year adding 6 bps to close at 3.30%. The US Dollar slid, but it was not enough to lend support to gold, as the precious metal lost -0.42%.
In the end, today was simply a reprieve for the buy-and-holders, but keep in mind that one bullish day does not indicate a directional trend change.
2. ETFs in the Spotlight
In case you missed the announcement and description of this section, you can read it here again.
It features some of the 10 broadly diversified domestic and sector ETFs from my HighVolume list as posted every Saturday. Furthermore, they are screened for the lowest MaxDD% number meaning they have been showing better resistance to temporary sell offs than all others over the past year.
The below table simply demonstrates the magnitude with which these ETFs are fluctuating above or below their respective individual trend lines (%+/-M/A). A break below, represented by a negative number, shows weakness, while a break above, represented by a positive percentage, shows strength.
For hundreds of ETF choices, be sure to reference Thursday’s StatSheet.
For this closed-out domestic “Buy” cycle (2/24/2022), here’s how some of our candidates have fared:
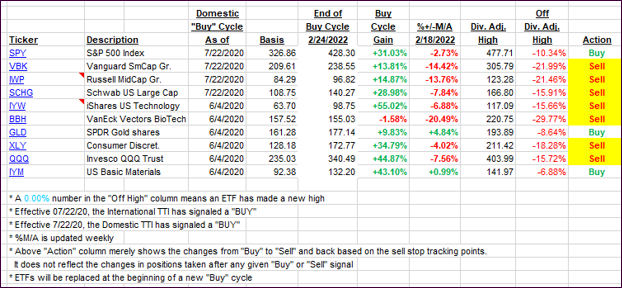
Click image to enlarge.
Again, the %+/-M/A column above shows the position of the various ETFs in relation to their respective long-term trend lines, while the trailing sell stops are being tracked in the “Off High” column. The “Action” column will signal a “Sell” once the -12% point has been taken out in the “Off High” column, which has replaced the prior -8% to -10% limits.
3. Trend Tracking Indexes (TTIs)
Our TTIs improved in view of today’s rebound, but it does not change the fact that we are still stuck deep in bear market territory.
This is how we closed 06/21/2022:
Domestic TTI: -13.50% below its M/A (prior close -14.51%)—Sell signal effective 02/24/2022.
International TTI: -11.55% below its M/A (prior close -13.08%)—Sell signal effective 03/08/2022.
Disclosure: I am obliged to inform you that I, as well as my advisory clients, own some of the ETFs listed in the above table. Furthermore, they do not represent a specific investment recommendation for you, they merely show which ETFs from the universe I track are falling within the specified guidelines.
All linked charts above are courtesy of Bloomberg via ZeroHedge.
Contact Ulli