- Moving the markets
An opening puke in the markets gave way to a rebound back above the unchanged line, but that gain was short lived, and down we went in the afternoon session.
A last hour rebound reduced some of the losses, but the three major indexes ended up in the red with the Nasdaq producing the worst performance with a beating of -2.11%.
Much hope was given to Fed head Powell’s speech, but that turned into a nothing burger with no indication of any assistance, like how to deal with the recent bond volatility, that could have had a soothing effect on the bond market and by extension on the stock market.
General platitudes prevailed with only two sentences indicating something worthwhile, as ZH opined:
“We monitor a broad range of financial conditions and we think that we are a long way from our goals.”
“I would be concerned by disorderly conditions in markets or persistent tightening in financial conditions that threatens the achievement of our goals.”
That lack of specifics in the face of soaring bond yields, with the 10-year now well above 1.5%, and staying there, pulled equities back below the unchanged line and kept them down.
At the same time those rising yields also wiped out the early climb in gold, with the US Dollar giving the assist via a rally to November highs.
The major indexes have now slipped into the red for the year with the Nasdaq now in correction territory, which is defined as a 10% drop from its recent high.
In the end, the Fed failed to do what it does best, namely provide reassuring comments to investors. The lack of such makes we wonder if they have lost control, did not want to assist, or simply ran out ammunition for the time being.
2. ETFs in the Spotlight
In case you missed the announcement and description of this section, you can read it here again.
It features some of the 10 broadly diversified domestic and sector ETFs from my HighVolume list as posted every Saturday. Furthermore, they are screened for the lowest MaxDD% number meaning they have been showing better resistance to temporary sell offs than all others over the past year.
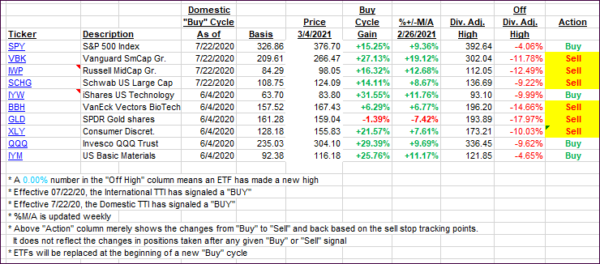
The below table simply demonstrates the magnitude with which these ETFs are fluctuating above or below their respective individual trend lines (%+/-M/A). A break below, represented by a negative number, shows weakness, while a break above, represented by a positive percentage, shows strength.
For hundreds of ETF choices, be sure to reference Thursday’s StatSheet.
For this current domestic “Buy” cycle, here’s how some our candidates have fared:

Click image to enlarge.
Again, the %+/-M/A column above shows the position of the various ETFs in relation to their respective long-term trend lines, while the trailing sell stops are being tracked in the “Off High” column. The “Action” column will signal a “Sell” once the -8% point has been taken out in the “Off High” column. For more volatile sector ETFs, the trigger point is -10%.
3. Trend Tracking Indexes (TTIs)
Our TTIs dove as the major indexes booked another session in the red.
This is how we closed 3/4/2021:
Domestic TTI: +15.54% above its M/A (prior close +17.13%)—Buy signal effective 07/22/2020.
International TTI: +15.94% above its M/A (prior close +17.39%)—Buy signals effective 07/22/2020.
Disclosure: I am obliged to inform you that I, as well as my advisory clients, own some of the ETFs listed in the above table. Furthermore, they do not represent a specific investment recommendation for you, they merely show which ETFs from the universe I track are falling within the specified guidelines.
Contact Ulli