ETF Tracker StatSheet
You can view the latest version here.
DUMPING INTO THE WEEKEND

- Moving the markets
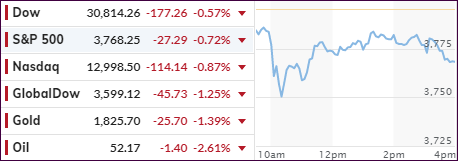
The futures already painted bleak picture based on doubts whether Biden really would be able to pass its $1.9 Trillion stimulus package. Some see it as untenable, so the cash market took a dive at the opening. As slow climb out of that early hole reduced losses somewhat, but in the end, the major indexes closed in the red registering a rare weekly loss.
Tom Essaye, founder of The Sevens Report, said the proposal was “being met by a ‘sell the news’ reaction as markets already priced in most of what was included.”
“Plans for future historical stimulus, easy Fed policy and vaccines are now well known, and as such those catalysts simply don’t have the positive influence on stocks that they have over the past few months,” he added.
There you have it. Much of the announcement was already priced in, and in typical market fashion, only a blow-out statement of epic proportions would have sent the indexes higher, because merely meeting expectations is considered a nonevent in today’s world.
Earnings season got underway for the banks and, despite better-than-expected results, banking stocks fell. Go figure…
Not helping markets was an announcement by Pfizer that EU vaccines will be delayed, thereby contributing to a spanking of stocks in Europe and in the US as well.
From a weekly perspective, Tuesday’s spike in bond yields reversed with prices vacillating around the 1.1% level, which appears to be the inflection point at this time.
The US Dollar Index went for a wild ride but dashed higher today thereby influencing Gold prices negatively again. It seems that the precious metal can’t find enough of a footing to launch a sustainable rally from.
I expect this volatility to continue next week.
2. ETFs in the Spotlight
In case you missed the announcement and description of this section, you can read it here again.
It features some of the 10 broadly diversified domestic and sector ETFs from my HighVolume list as posted every Saturday. Furthermore, they are screened for the lowest MaxDD% number meaning they have been showing better resistance to temporary sell offs than all others over the past year.
The below table simply demonstrates the magnitude with which these ETFs are fluctuating above or below their respective individual trend lines (%+/-M/A). A break below, represented by a negative number, shows weakness, while a break above, represented by a positive percentage, shows strength.
For hundreds of ETF choices, be sure to reference Thursday’s StatSheet.
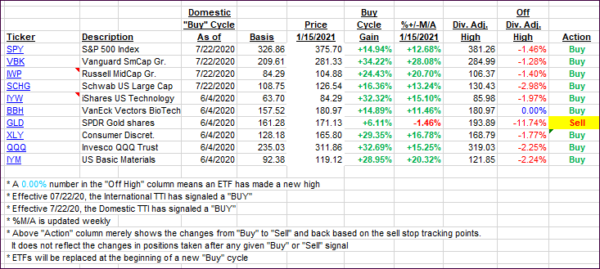
For this current domestic “Buy” cycle, here’s how some our candidates have fared:

Click image to enlarge.
Again, the %+/-M/A column above shows the position of the various ETFs in relation to their respective long-term trend lines, while the trailing sell stops are being tracked in the “Off High” column. The “Action” column will signal a “Sell” once the -8% point has been taken out in the “Off High” column. For more volatile sector ETFs, the trigger point is -10%.
3. Trend Tracking Indexes (TTIs)
Our TTIs came off their recent highs.
This is how we closed 1/15/2021:
Domestic TTI: +19.30% above its M/A (prior close +20.91%)—Buy signal effective 07/22/2020.
International TTI: +18.39% above its M/A (prior close +20.32%)—Buy signal effective 07/22/2020.
Disclosure: I am obliged to inform you that I, as well as my advisory clients, own some of the ETFs listed in the above table. Furthermore, they do not represent a specific investment recommendation for you, they merely show which ETFs from the universe I track are falling within the specified guidelines.
———————————————————-
WOULD YOU LIKE TO HAVE YOUR INVESTMENTS PROFESSIONALLY MANAGED?
Do you have the time to follow our investment plans yourself? If you are a busy professional who would like to have his portfolio managed using our methodology, please contact me directly or get more details here.
———————————————————
Back issues of the ETF Tracker are available on the web.
Contact Ulli