
ETF Tracker StatSheet
You can view the latest version here.
RECORD TECH SALES—STOCKS TANK
- Moving the markets
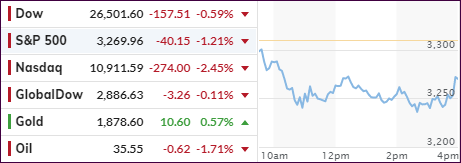
As I noted yesterday, tech earnings dominated the news with quarterly sales coming in worse than expected, which soured the mood for the session with Dow being down over 400 points before cutting its losses.
It was amazing to watch the lows being made mid-session, with technical support points about to be taken out, when Fed head Powell suddenly announced easier terms for its Main Street lending program for smaller businesses.
ZH summarized it like this:
*FED LOWERS MINIMUM LOAN IN MAIN ST PROGRAM TO $100K FROM $250K
*FED: PPP LOANS OF UP TO $2M CAN BE EXCLUDED FROM BORROWER DEBT
*FED: MAIN ST. TO DATE HAS MADE ALMOST 400 LOANS TOTALING $3.7B
As if by magic, equities turned around, as the sell-off eased, and a late rally into the close not only prevented a further rout but also cut the losses for the day. Yes, it’s that easy, if hang around the upper layers of the food chain.
Still, Wall Street posted not only its worst one-week selloff since March but also its worst pre-election plunge in history, as ZH called it.
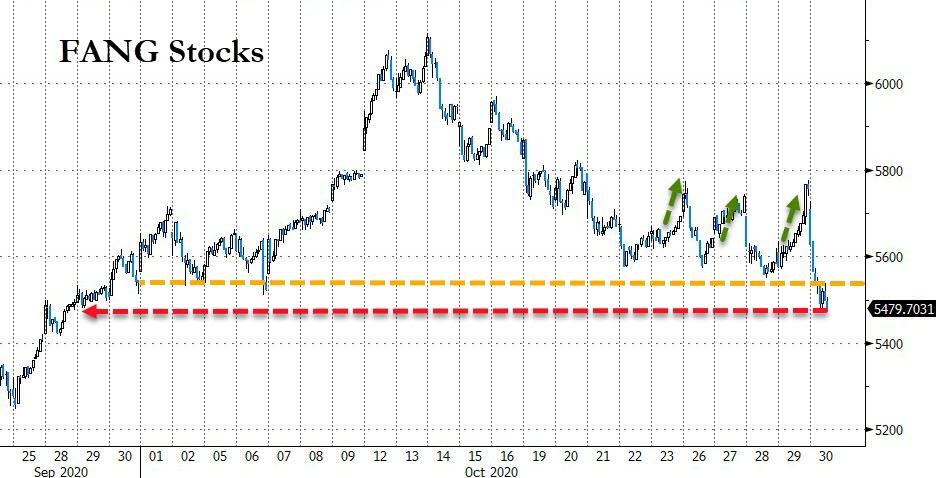
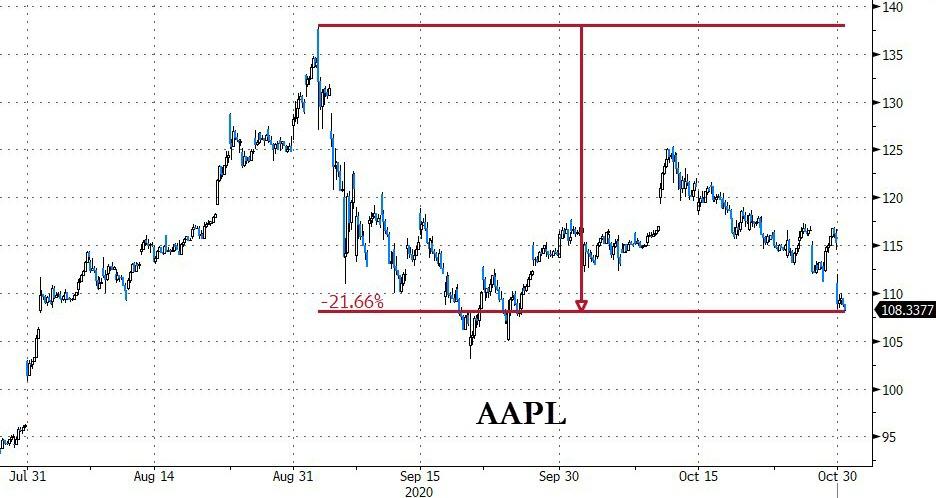
In the end, the Dow and Nasdaq are both in correction territory, which means they are down more than 10% from their recent highs. Obviously, this has impacted the FANG stocks, which ended down for the second month in a row. Even tech behemoth Apple headed into a bear market (more than 20% off its highs), while Twitter hit the skids as well.
For sure, we are at the crossroads and, depending on the election outcome, could see a resumption of the bullish cycle, due to seasonal factors, but that could easily be offset by the realities of a slowing economy and an overvalued stock market.
Will this chart be of a prophetic nature?
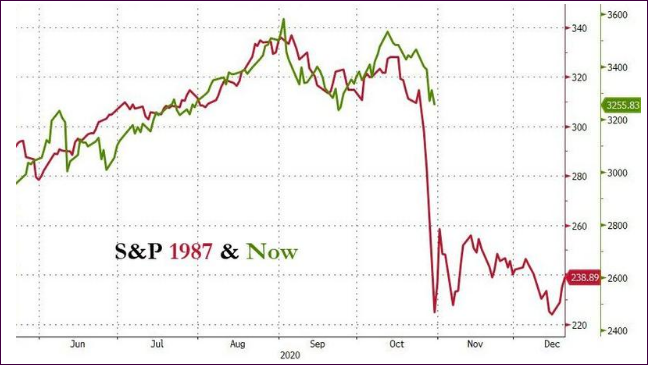
We will find out soon.
2. ETFs in the Spotlight
In case you missed the announcement and description of this section, you can read it here again.
It features some of the 10 broadly diversified domestic and sector ETFs from my HighVolume list as posted every Saturday. Furthermore, they are screened for the lowest MaxDD% number meaning they have been showing better resistance to temporary sell offs than all others over the past year.
The below table simply demonstrates the magnitude with which these ETFs are fluctuating above or below their respective individual trend lines (%+/-M/A). A break below, represented by a negative number, shows weakness, while a break above, represented by a positive percentage, shows strength.
For hundreds of ETF choices, be sure to reference Thursday’s StatSheet.
For this current domestic “Buy” cycle, here’s how some our candidates have fared:
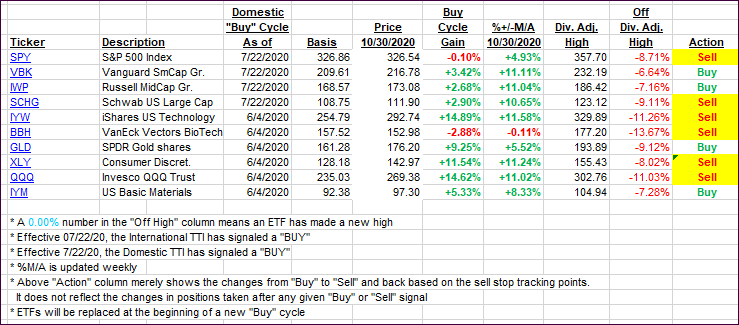
Click image to enlarge
Again, the %+/-M/A column above shows the position of the various ETFs in relation to their respective long-term trend lines, while the trailing sell stops are being tracked in the “Off High” column. The “Action” column will signal a “Sell” once the -8% point has been taken out in the “Off High” column. For more volatile sector ETFs, the trigger point is -10%.
3. Trend Tracking Indexes (TTIs)
Our TTIs slipped a tad but remain in bullish territory for the time being.
This is how we closed 10/30/2020:
Domestic TTI: +5.23% above its M/A (prior close +5.47%)—Buy signal effective 07/22/2020
International TTI: +1.25% above its M/A (prior close +1.39%)—Buy signal effective 07/22/2020
Disclosure: I am obliged to inform you that I, as well as my advisory clients, own some of the ETFs listed in the above table. Furthermore, they do not represent a specific investment recommendation for you, they merely show which ETFs from the universe I track are falling within the specified guidelines.
———————————————————-
WOULD YOU LIKE TO HAVE YOUR INVESTMENTS PROFESSIONALLY MANAGED?
Do you have the time to follow our investment plans yourself? If you are a busy professional who would like to have his portfolio managed using our methodology, please contact me directly or get more details here.
———————————————————
Back issues of the ETF Tracker are available on the web.
Contact Ulli