- Moving the markets
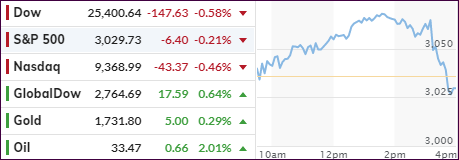
A follow-through rally ran into a brick wall, took a U-turn, and headed south with the major indexes being pulled off their lofty levels and below their respective unchanged lines.
The early burst higher was based on hope that the worst economic damage is now in the past with shutdowns continuing to ease. While that is a step in the right direction, I think there is more fallout to come, but the markets don’t see it yet.
The economic numbers keep worsening, as this list shows (hat tip goes to ZH):
Initial jobless claims kept rising by another 2.123 million over the past week, which now brings the ten-week total to 40.767 million. That’s more than at any time period in American history. What’s more disturbing is that in the past 10 weeks almost twice as many people have filed for unemployment than jobs gained in the last decade since the end of the Great Recession.
Pending Home Sales plummet 35% YoY—biggest drop ever
Q1 GDP revised to -5%—corporate profits plunge 14%
Collapse in Durable Goods Orders accelerates in April
None of these issues mattered throughout most of today’s session. The quick turnaround came on a report that Trump was set to hold a news conference on China tomorrow.
That hurled a cloud of uncertainty over the markets, especially due to the recent war of words and current ratcheting up of tensions not just between the two countries, but also regarding the uprising in Hong Kong and the potential imposition of a national security law.
For once, the Fed was out of the limelight, and we will have to see how this event shapes up.
2. ETFs in the Spotlight
In case you missed the announcement and description of this section, you can read it here again.
It features some of the 10 broadly diversified domestic and sector ETFs from my HighVolume list as posted every Saturday. Furthermore, they are screened for the lowest MaxDD% number meaning they have been showing better resistance to temporary sell offs than all others over the past year.
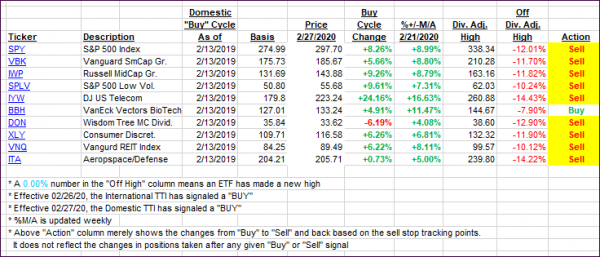
The below table simply demonstrates the magnitude with which these ETFs are fluctuating above or below their respective individual trend lines (%+/-M/A). A break below, represented by a negative number, shows weakness, while a break above, represented by a positive percentage, shows strength.
For hundreds of ETF choices, be sure to reference Thursday’s StatSheet.
For this past domestic “Buy” cycle, which ended on 2/27/2020, here’s how some our candidates have fared:

Click image to enlarge
Again, the %+/-M/A column above shows the position of the various ETFs in relation to their respective long-term trend lines, while the trailing sell stops are being tracked in the “Off High” column. The “Action” column will signal a “Sell” once the -8% point has been taken out in the “Off High” column. For more volatile sector ETFs, the trigger point is -10%.
3. Trend Tracking Indexes (TTIs)
Our TTIs slipped as the markets took a dive during the last hour of trading.
This is how we closed 05/28/2020:
Domestic TTI: -3.31% below its M/A (prior close -2.33%)—Sell signal effective 02/27/2020
International TTI: -6.50% below its M/A (prior close -7.00%)—Sell signal effective 02/26/2020
Disclosure: I am obliged to inform you that I, as well as my advisory clients, own some of the ETFs listed in the above table. Furthermore, they do not represent a specific investment recommendation for you, they merely show which ETFs from the universe I track are falling within the specified guidelines.
Contact Ulli